HAL Id: in2p3-00617510
http://hal.in2p3.fr/in2p3-00617510
Preprint submitted on 29 Aug 2011
HAL is a multi-disciplinary open access
archive for the deposit and dissemination of sci-entific research documents, whether they are pub-lished or not. The documents may come from teaching and research institutions in France or abroad, or from public or private research centers.
L’archive ouverte pluridisciplinaire HAL, est destinée au dépôt et à la diffusion de documents scientifiques de niveau recherche, publiés ou non, émanant des établissements d’enseignement et de recherche français ou étrangers, des laboratoires publics ou privés.
R. Dominguez-Reyes, N. Adimi, M. Alcorta, A. Bey, M.J.G. Borge, M.
Carmona-Gallardo, Francois de Oliveira Santos, C. Dossat, H.O.U. Fynbo, J.
Giovinazzo, et al.
To cite this version:
R. Dominguez-Reyes, N. Adimi, M. Alcorta, A. Bey, M.J.G. Borge, et al.. Detailed β-decay study of 32Ar. 2011. �in2p3-00617510�
R. Dom´ınguez-Reyes1 , N. Adimi2,3, M. Alcorta1 , A. Bey2 , B. Blank2 , M.J.G. Borge1 , M. Carmona-Gallardo1 , F. de Oliveira Santos4 , C. Dossat2 , H.O.U. Fynbo5 , J. Giovinazzo2 , H.H. Knudsen5 , M. Madurga1 , I. Matea2,6 , A. Perea1 , K. S¨ummerer7 , O. Tengblad1 , and J.C. Thomas4 1
Instituto de Estructura de la Materia, IEM-CSIC, C/Serrano 113bis, E-28006, Madrid, Spain.
2
Centre d’´Etudes Nucl´eaires de Bordeaux Gradignan, Universit´e Bordeaux 1, UMR 5797 CNRS/IN2P3, Chemin du Solarium, BP 120, F-33175 Gradignan, France. 3Facult´e de Physique, USTHB, B.P.32, El Alia, 16111 Bab Ezzouar, Alger, Algeria. 4Grand Acc´el´erateur National d’Ions Lourds, CEA/DSM-CNRS/IN2P3, B.P. 55027, F-14076 Caen Cedex 05, France
5
Department of Physics and Astronomy, University of Aarhus, Ny Munkegade 1520, DK-8000 Aarhus C, Denmark
6
Institut de Physique Nucl´eaire, CNRS-IN2P3 / Universit´e Paris-Sud 11, Orsay, France
7GSI Helmholtzzentrum f¨ur Schwerionenforschung GmbH, Planckstrasse 1, D-64291 Darmstadt, Germany
E-mail: [email protected]
Abstract. Beta-delayed proton and γ-ray emission from the 32Ar decay has been studied at the low-energy identification station of SPIRAL at GANIL. The study of β-delayed charged-particle emission and electromagnetic radiation allowed us to achieve a nearly complete decay scheme of the 32Ar nucleus. With the distinction between β-delayed protons emitted to the ground and to the first excited state in31
S and the new values of half-life and QEC we have deduced the Gamow-Teller strength distribution over a large part of the QEC window. The GT strength is compared to advanced shell-model calculations. The experimental Gamow-Teller strength is wider distributed than theoretically predicted and the onset of the Gamow-Teller Giant Resonance happens at lower energy. This explains why the deduced value for the quenching factor depends strongly on the explored excitation energy in the daughter nucleus. When the energy window is chosen large enough the standard quenching factor for the sd-shell is recovered.
PACS numbers: 23.40.-s,23.50.+z,27.30.+t,29.30.Ep
1. Introduction
One of the most important methods to study the atomic nucleus is nuclear β decay. The very restrictive selection rules of the β-decay process make it a powerful tool to deduce information about nuclear structure. Studies close to the valley of beta stability allow us to precisely test our understanding of the structure at low excitation energies. However, in the region near the proton drip-line the differences in the isobaric masses result in a wide decay window, which extends nuclear structure studies using beta-decay towards much higher excitation energies. Due to the very low binding energy of the last proton in very proton-rich nuclei, excitation energies in the daughter nucleus beyond the proton separation energy can be explored through β-delayed particle emission.
The high sensitivity for charged-particle detection compared to γ-ray detection explains why most of the studies of light neutron-deficient nuclei have been based on charged-particle detection and the β-decay scheme was often built with the assumption that most of the β-delayed protons feed the ground state of the proton-daughter nucleus. A step further is the detection of both types of emissions providing us with a more complete scenario for nuclear-structure studies. Thanks to the fact that in nuclei with Z>N the isobaric analog state (IAS) is within the QEC window, a major part of the
allowed β-decay strength can be directly measured. In the decay of 32
Ar, where the IAS is located in the lower half of the QEC window, we expect to detect a substantial
part of the Gamow-Teller (GT) Giant Resonance (GR), or at least the onset of the GTGR. Therefore it is worth to perform a complete study with good γp information to determine the GT strength distribution and to determine the quenching factor of the Gamow-Teller strength B(GT). This factor which relates experimental and theoretical B(GT) distributions has been calculated to be substantially lower than unity in different kinds of studies, from β decay to charge-exchange reactions, in many different nuclei. Two main explanations have been proposed to cause this quenching. On the one hand, the contribution of sub-nuclear excitations, such as the ∆ resonance, that may shift the transition strength to high excitation energies. On the other hand, the limited amount of nuclear orbitals taken into account in shell-model calculations to describe the transition strength. In particular, intruder orbitals giving rise to higher-energy excitations are usually not included in order to keep the model calculation tractable. Recently, the
90
Zr(p,n) and (n,p) reactions were measured up to 70 MeV to study the contribution to the GT strength of the continuum beyond the GTGR [1]. It was found that most of the quenching disappeared when the continuum was taken into account. It was concluded that second-order configuration mixing was the main mechanism responsible for the quenching of the Gamow-Teller strength. For details in the same direction see also the discussion in [2].
The decay of 32
Ar (Tz=-2) was studied several times [3, 4, 5, 6] with different aims
and methods. In the first work, Hagberg et al. [3] managed to identify the most intense βp branch from the IAS and confirmed that the quadratic form of the isobaric multiplet mass equation (IMME) was valid also for nuclei with isospin T=2 as this was the first
isobaric quintet studied. Later, Bj¨ornstad et al. [4] did the first overall study of the decay properties and states in 32
Cl. Comparison of the B(GT) strength of the light
32−34
Ar isotopes with shell model calculations indicated an almost inexistent quenching of the B(GT) strength in the energy window studied [7]. Schardt & Riisager [5] used a very small cooled detector, with very good energy resolution (8 keV FWHM), to study the proton line shapes and thus tentatively assign the transitions to the first excited state of 31
S through the difference in width of the proton lines in the spectrum. The more recent work of Bhattacharya et al. [6] studied the superallowed 0+
to 0+
Fermi decay to deduce the isospin symmetry breaking corrections. To this aim the absolute branching ratio to the IAS was determined with high precision to be equal to 22.71(15)% including a 1.92(9)% γ-emission branch. This result, combined with very precise determinations of the half-life T1/2= 100.5(3) ms and of the QEC value of the
IAS obtained from mass measurements [8], allowed them to determine the IAS decay strength and from that the f t value. Comparison with the average value of the corrected Ft from T=1 superallowed transitions enabled the authors to extract an isospin mixing of the IAS of 2.1(8)%, in good agreement with a shell model prediction by Brown, ref. 3 in [6], of 2.0(4)%. This good agreement indicates the degree of reliability of shell model calculations to describe these nuclei and to deduce the quenching factor from the comparison of the experimental B(GT) distribution with the one obtained from shell-model calculations [9]. The determination of the decay of the IAS in 32
Cl [6] by proton and γ emission yields a more precise proton separation energy (Sp), changing
from Sp=1574(7) keV [10] to Sp=1581.3(6) keV. The ground state mass of32Cl has been
determined recently by measuring the32
S(3
He,t)32
Cl reaction with a Q3D (quadrupole-dipole-dipole-dipole) magnetic spectrograph [11]. The value obtained agrees with the one of [10], but is more precise [11]. Furthermore the mass of 31
S has recently been measured with the double Penning trap JYFLTRAP [12]. These measurements result in a recommended mass excess value of ∆M(32
Cl)= -13334.64(57) keV and Sp=1581.06(62)
keV [6, 12, 11].
In this work, we present a detailed study of the B(GT) distribution of 32
Ar and compare it with recent shell-model calculations. In addition, we have identified a state potentially responsible for the isospin mixing of the IAS. The main advantage of the present work is the combined high efficiency for γ-ray and charged-particle detection. 2. Experiment
The 32
Ar beam was produced from the fragmentation of a 36
Ar primary beam at 95 MeV/u from the CSS1 and CSS2 cyclotrons of GANIL in the carbon target of the SPIRAL facility. The secondary beam was ionized in an Electron Cyclotron Resonance Ion Source (ECRIS) to obtain the 32
Ar3+
low-energy beam, which was directed to the SPIRAL identification station where the experimental setup was mounted. The 30 keV
32
Ar beam was stopped in a 0.9 µm thick aluminised mylar foil (1 cm × 2 cm) mounted on a thin metallic frame. The beam shape and the transmission to the catcher, that was
placed in the center of the setup, were controlled by beam profilers and Faraday cups. The total32
Ar data correspond to 13 hours of data taking. The average intensity of the beam at the setup was at least of 100 pps. The low energy and noble gas character of the incoming beam made possible that some32
Ar ions could scape from the mylar foil.
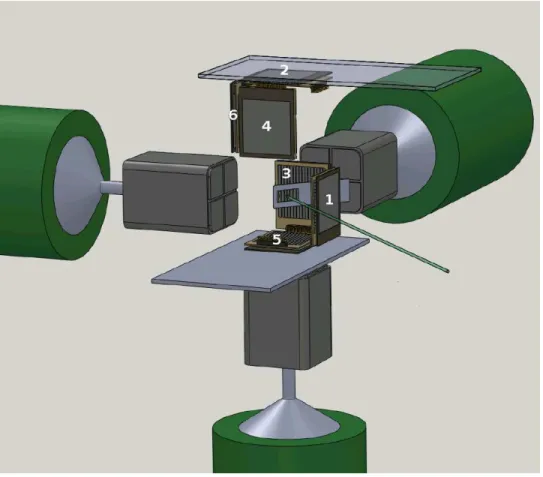
Figure 1. Schematic drawing of the experimental setup. Three detectors of the telescope array (detectors 2, 4, and 6) have been shifted upwards in the figure to show the beam stopper (gray plate in the center of the cubic structure with a hole for the foil). The beam direction is shown by the green line.
The setup, identical to the one used in [13], consisted of the Silicon Cube detector array [14] surrounded by three high-efficiency HPGe Clover detectors from the EXOGAM array [15]. The Silicon Cube consisted of six telescopes, formed in front by doubled-sided silicon strip detectors (DSSSDs) with 16×16 strips, and a pitch of 3 mm forming a cube facing the mylar catcher foil. These DSSSDs are backed by six large-area (50×50 mm2
) passivated implanted planar silicon (PIPS) detectors used to detect β particles. The thicknesses of the front DSSSD detectors were chosen to cover the full energy range of the decay, with 4 DSSSDs with thicknesses close to 300 µm, one thin DSSSD detector of 64 µm and one thick DSSSD of 1000 µm. The thicknesses of the back detectors of the telescopes varied from 300 to 1500 µm. The telescope on top of the catcher foil (number 2 in figure 1) did not function correctly and was not used in the present analysis. A schematic view of the detectors and the whole setup can be
seen in figure 1.
The 32×6 channels from the DSSSDs were read out via a printed circuit board incorporated in the detector housing. The 16-channel pre-amplifier cards were mounted directly onto the detector chamber allowing for a rather compact configuration. This setup had in the present experiment an effective geometrical efficiency for particle detection of 41(1)% of 4π. More details about the general performance of the Silicon Cube can be found in [14].
The three EXOGAM clover detectors surrounding the Silicon Cube consisted of 4 high-purity germanium (HPGe) crystals in a common cryostat each with a height and width of 60 mm and a length of 90 mm.
3. Calibration
We have used the spectrum of three 300 µm DSSSDs (detectors 1, 3 and 6 in figure 1) to determine the energies and intensities of the proton peaks in the region between 1.2 MeV and 5.8 MeV. For proton peaks below 1.2 MeV, the data were taken from the 64 µm detector (detector 4 in figure 1) as the β response of this detector was negligible. The region between 1.2 and 2 MeV was studied both by the 64 µm and 300 µm thick DSSSD detectors. The proton spectrum from the 1000 µm thick detector (detector 5 in figure 1) was used for proton energies above 5.8 MeV as the protons at this energy start to punch through the 300 µm thick detectors producing a decrease in the detection efficiency. Due to its thickness, this detector had a relatively large β response and worse energy resolution so its use to extract spectroscopic information was restricted to high-energy protons. To obtain the relative intensities of the proton spectra in the full high-energy range, the results from the 64 µm and 1000 µm thick detectors have been normalized using the relative geometric efficiency with respect to the 300 µm thick detectors and the renormalization was checked with the peak area of the IAS proton transition to the
31
S ground state for the 1000 µm thick detector and the 2.1 MeV proton peak in the case of the 64 µm thick detector.
The reduction of β contribution to the proton spectrum has been done in several steps. Only events which deposited energy in the front and in the back side of the DSSSD differing by less than 50 keV in the 300 and 1000 µm thick detectors were considered. In this way, effects such as charge-sharing between different strips were avoided, for more details see [16]. In order to reduce the β-summing in the 300 and 1000 µm thick detectors, the PIPS detectors were used as veto requiring the positron of the βp event to be detected in the back detector of a different telescope in order to consider a proton event valid. This led to a better resolution as well as a decrease in the β-summing and a clean low-energy part of the spectra decreasing the β contribution to the 1% level. In the case of the 64 µm thick detector, we have used its own PIPS detector as a veto for the punch-through protons in order to isolate the low energy protons that were fully stopped in the front detector.
Table 1. List of γ-ray transitions in the 32Ar β decay. The energies are taken from [18]. The 89.9(1) keV transition was below the detector threshold. See text for an interpretation of the γ-ray intensities given.
Nucleus Eγ Iγ(%) Iγ(%) (this work) [4] 32 Cl 89.9(1) - 36.5 461.1(1) 83(17) 100 707.4(2) 100(3) 100 1078.7(2) 33(5) 36.5 1168.5(2) 39(5) 37.0 31 S 1248.8(3) 54(6) 5.9
standard triple α-source (239
Pu,241
Am, and244
Cm). The α-source spectra allowed us to fix the noise level in the PIPS detectors in order to optimize the removal of β-summing. Due to the difference in mean energy required for a proton and α particle to create a electron-hole pair in Silicon [5, 17] it is better to use an internal calibration based on βp transitions for the DSSSDs. For the 300µm and the 1000µm detectors, we used five reference points for the internal calibration based on the most intense and most accurately determined transition energies. These transitions correspond to the proton emission from levels at excitation energies in 33
Cl at 3971.9(12) keV [18], 4438.2(15) keV [18], 5547.9(8) keV [19], and 6248(3) keV [18] and at 5046.3(4) keV excitation energy (IAS) in 32
Cl. While writing this paper a revision of the 33
Cl levels has been published [20], the excitation energies of the reference levels coincide within 1 keV with those used here for calibration. An additional energy correction was performed in the energy region below 1.6 MeV to account for the difference in energy losses in the stopper foil and in the detector dead layers for the low energies. For the thin 64 µm detector, as protons are only fully stopped up to 3 MeV, we used three β-delayed proton lines for the calibration. They correspond to proton transitions at 1.318, 1.643 and 2.097 MeV from the levels at 3971.9(12) keV, 4438.2(15) keV and 5868(2) keV excitation energy [18] in
33
Cl. The energy resolution for the proton spectrum was 70 keV for the thin detector and 45 keV (FWHM) for the thick detectors. The β-gated proton spectrum is shown in detail in figure 2. The proton spectrum is shown in two parts to facilitate the observation of details of the low intensity peaks.
The three CLOVER detectors from EXOGAM for γ detection were efficiency and energy calibrated using standard calibration sources (60
Co, 133
Ba, 137
Cs, 152
Eu and
207
Bi). The energy resolution (FWHM) was 6 keV at 1.3 MeV. We obtained a total efficiency of 3.0(2)% at 1249 keV, the energy of the γ ray de-exciting the first excited state in 31
Energy (keV) C o u n ts / 8 k e V 34 5 6 7 8 10 12 15 16 18 19 20 21 a) 1 2 34 5 Energy (keV) C o u n ts / 8 k e V 22 23 2526 27 28 29 3031 32 33 34 35 36 37 38 394041 4243 44 45 46 47 48 49 50 c) 48 49 50 51 52 Energy (keV) C o u n ts / 8 k e V 2 4 5 9 11 13 14 1516 17 18 20 *** ** b) Energy (keV) C o u n ts / 8 k e V 23 24 25 30 32 35 d) 1 10 102 103 104 105 500 1000 1500 2000 2500 3000 3500 1 10 102 103 3500 4000 4500 5000 5500 6000 6500 7000 1 10 10 102 500 1000 1500 2000 2500 3000 3500 10 102 3500 4000 4500 5000 5500 6000 6500 7000
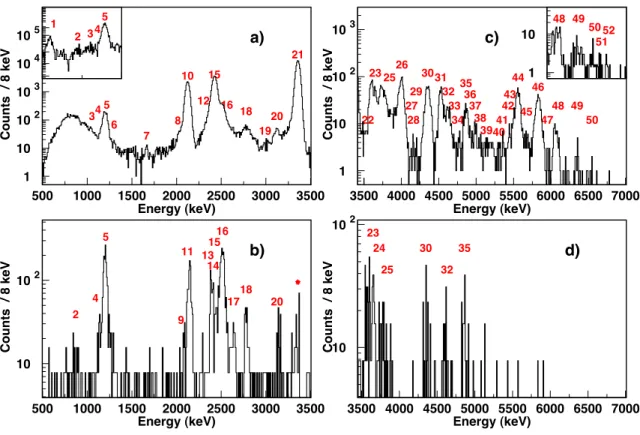
Figure 2. (a) The β-gated proton spectrum up to 3.5 MeV from the 300 µm detectors. In the inset, the low energy part of the spectrum from the 64 µm detector is shown with a veto condition in the PIPS detector of the telescope. (b) Charged particle spectrum in coincidence with the 31
S 1248 keV γ-ray up to 3.5 MeV. The random coincidence level is given by the intensity of the proton peak from the IAS at 3.3 MeV marked with a star. (c) The β-gated proton spectrum above 3.5 MeV. Peaks above number 48 have been confirmed with the 1000 µm detector (inset). (d) Charged particle spectrum above 3.5 MeV in coincidence with the31S 1248 keV γ-ray.
4. Analysis procedure
In the γ-ray spectrum, we identified (see figure 3a) γ transitions at 461.09(11), 707.4(2), 1078.5(3) and 1168.4(3) keV in 32
Cl (see table 1) and the 2230.3(2) keV γ transition from the 32
Cl decay. The 89.9(1) keV γ transition from the 89.89 keV state was below the γ threshold of some of the detectors. Throughout the experiment, the event trigger was fired only by the DSSSDs. This trigger condition strongly favours βp events over βγ events. The γ transitions in 32
Cl were triggered by the detection of a β particle in the DSSSDs, whereas the γ line in31
S was triggered by β particles or β-delayed protons in the DSSSDs which had a much higher trigger probability. Therefore, the intensity of this last γ ray should not be compared directly to the other γ rays nor to the intensity of this line in the work of Bj¨ornstad et al. [4] where the trigger was different.
Despite an assignment of Jπ = 0+
or Jπ = 1+
for the 461.1 keV state in32
cannot assign any β feeding to the 461.1 keV state as we get Iγ(707 keV) ≥ Iγ(461 keV).
Therefore, we favour a Jπ = 0+
assignment for this level as proposed by (3
He,t) reaction work [21, 22] and shell model predictions [23, 24]. Furthermore, no direct feeding to the states at 89.9(1) and 461.1(1) keV has previously been reported [4]. So in the following no β feeding is assumed for these states.
The data from the charged particle spectra were analyzed first assuming that all the peaks were β-delayed protons to the ground state of the daughter nucleus 31
S (spectra (a) and (c) in figure 2). The peaks were fitted with a Gaussian peak shape using the CERN package PAW and the centroids and the areas of the peaks were extracted.
In a second step, we analyzed the charged particle data in coincidence with γ rays. The deexcitation of the two lower excited states in31
S occurs mainly by two independent γ rays of 1248.8(3) keV and 2235.5(5) keV energy, respectively. The latter could not be distinguished from the more intense 2230.3(2) keV γ-ray from the decay of 32
Cl. When gating on the proton spectrum the only prominent γ-ray is the 1248.8(3) keV line (see figure 3b) corresponding to the de-excitation of the first excited state of 31
S. Feeding from the IAS to the 2235.5(5) keV second excited state in 31
S of the order of 0.025(4)% is suggested in [6]. We have searched for a proton peak around 680 keV in our thin detector without success. However, a very weak indication of a relatively broad peak around 715(10) keV with a similar intensity of 0.028% was observed, but we have neglected this contribution due to the broad shape and difference with the expected energy if assumed to be a proton transition connecting the IAS to the second excited state in 31
S.
We selected a narrow window around the 1248.8(3) keV peak in the γ-ray spectrum to obtain the γ-gated proton spectrum and made the same selection over the background at both sides of the peak to subtract the background contributions. With this procedure, we obtained the γp coincidence spectrum that can be seen in parts (b) and (d) of figure 2. In order to determine our random coincidence level, we considered that the proton peak at 3356(2) keV comes only from the proton transition from the IAS in32
Cl to the ground state of31
S. The area of the γp 3356 keV peak relative to its area in the charged particle spectrum determines the random coincidence level to be 10−4.
After the first analysis, it was obvious that some of the βp peaks that were assumed to correspond to transitions to the 31
S ground state (p0 from now on) overlay with
protons to the 31
S first excited state at 1248.8 keV (p1). There are two possibilities:
either some of the considered p0 transitions in the β-gated spectrum were totally p1
transitions, or within our energy resolution the proton peaks were found to be double with a combination of p0 and p1 peaks. The analysis just described was also performed
for the spectra (singles and coincidence spectra) obtained with the thin detector. To distinguish between the different possibilities, we use the fact that the γ-gated proton (γp) spectrum is clearly dominated by the proton peak at 1218(3) keV. We scaled the γp spectrum with the total γ-ray efficiency at 1248.8 keV and the extra factors due to the conditioning done to remove the β summing leading to a total normalization factor of 7.8(1). When doing this one notices that the two spectra match in intensity at
1218(3) keV as illustrated in the bottom part of figure 3. Therefore, the intensity of the 1218(3) keV proton peak can be used to scale the γp spectrum to the β-gated proton spectrum in order to obtain the p1 branching ratios relative to those for βp decay to
the31
S ground state. A similar procedure to distinguish the components p0 and p1 from
the same peak was used by Bhattacharya et al. [6] for the proton peak at 4527(3) keV. The contribution of β-delayed proton transitions feeding the first excited state is 5.5 % of the full proton spectrum.
energy (keV) C o u n ts / 1 k e V a) 4 6 1 .1 7 0 7 .4 1 0 7 8 .7 1 1 6 8 .4 2 2 3 0 .3 energy (keV) C o u n ts / 1 k e V b) 1 2 4 8 .9 energy (keV) C o u n ts / 1 0 k e V c) 102 103 104 105 500 750 1000 1250 1500 1750 2000 2250 10 102 103 104 105 500 750 1000 1250 1500 1750 2000 2250 1 10 102 103 104 1000 2000 3000 4000 5000 6000 7000
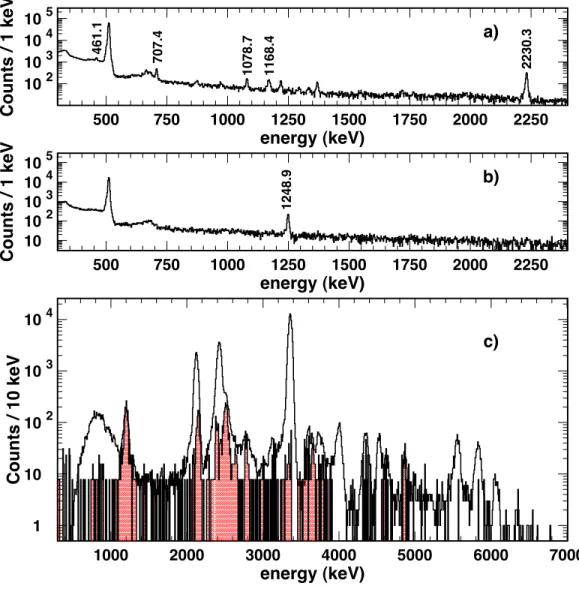
Figure 3. a) β-gated γ-ray spectrum with the main transitions from 32
Ar β decay. The 2230.3(2) keV γ-ray from the decay of32Cl is also marked. b) Proton-gated γ-ray spectrum with the main transition from32
Ar βp decay. Only the γ-ray from the decay of the first excited state to the ground state in32Cl is visible, whereas the γ-rays from the second excited state, expected at 986.6 keV and 2235.6 keV, are absent. c) β-gated proton spectrum (white) from the 300 µm detectors and γp spectrum (shaded) scaled to the β-gated proton spectrum with a factor 7.8(1).
The proton peaks which have a contribution from decays to the ground and the first excited states appear with the centroid energy of the most intense contribution in table 2. They are given with their individual p0 and p1 centroid energies in table 3.
5. Discussion of the results
A complete list of all the proton transitions observed in this work can be found in table 2 where they are compared to the results from previous works [4, 5, 6]. For this comparison, we have corrected the βp energies determined in [4, 5] because the reference points used in their internal calibrations have changed. An internal energy calibration was performed in [4, 5] using the proton transition energies from states at 3971.9(12) and 5544(1) keV in 33
Cl, see compilation [18]. The latter value, from [25], was recently remeasured to be 5547.9(8) keV [19] in better agreement with the expected value from the quadratic form of the IMME formula. Due to the recently found shift of 3 keV in the IAS position of 33
Cl [19], we do not compare and average with previous βp energy values from [4, 5, 6], but rather state the new ones.
Comparing the excitation energies obtained from p0 protons with energies from p1
protons, we find many coincident values. Therefore, we could identify fourteen states that decay by proton emission both to the ground and the first excited state of 31
S. Only three p1 transitions are assigned to levels with no p0 contribution.
To determine the β feeding we calculated first the relative intensity of all proton lines with respect to the p0 line from the IAS in
32
Cl (3356(2) keV proton peak) and then renormalized the results to the IAS p0 branching ratio of 20.50(13)% recently
published [6]. We have renormalized the branching ratios from [4] and the relative intensities in [5] to the new reference value, 20.50(13)%, to ease the comparison. To convert the counting rates of the γp peaks into branching ratios we used the relative intensity of the 1218(3) keV proton peak obtained in the βp spectrum.
All the proton transitions from previous studies [4, 5, 6] have been observed in this work and, due to the new γp information, we have been able to identify twice the number of proton transitions. The use of the 64 µm thick detector with a low β response enables us to identify new proton transitions below 2.1 MeV. We identified the proton peak at 603(4) keV, observed previously [4, 5, 6], but we got a much lower intensity compared to them. In order to resolve this discrepancy, we compared the ratio of the intensity of the 603 and 1218 keV proton transitions for the different strips of the thin detector and found that the ratio varies from strip to strip. We attributed this effect to the trigger thresholds for the different strips which cut the peak to some extent. As it was not possible to correct for this effect, we used for the calculation of the B(GT) distribution the average branching ratio for this proton transition from previous works [4, 5, 6]. This threshold effect did not affect the proton lines with higher energy. The recent work of Bhattacharya et al. [6] gives proton transitions to the first excited state in 31
S and to the ground state with proton energies higher than 4 MeV plus the proton line at 610 keV. We have identified all their p1 transitions with one
exception. In our work, we detect a prominent p1 proton group at 2779(7) keV, not
listed in [6], while they proposed a proton group at 2870(5) keV where we do not see any contribution. As they claim that the proton peak is broad, we will assume for the comparison that we are observing the same transition, although the energies differ by 90 keV. When comparing our branching ratios to those of previous works, they are in reasonable agreement in most of the cases, except for the 603 keV proton peak already mentioned and the proton lines just above the IAS where the influence of β-summing can cause the differences observed, see table 2.
Due to the enhanced γp coincidence efficiency, we have improved the quality of the measured p1 proton spectrum. Most likely due to the low statistics of the γp
spectrum in [4] where only six p1 transitions were identified, the authors assumed that
all γp transitions observed were fully feeding the 31
S first excited state. So the main discrepancy with previous works is the assignment of the proton peaks to the different possible transitions. For instance, the 2424(2) and 4352(3) keV peaks were assigned previously to the 31
S ground state only, a weak transition to the 31
S first excited state has been found in this work. The 2514(5) and 2779(7) keV peaks were assigned either to the ground state [4, 5] or to the excited state [6], both branches could be disentangled in our work. The proton peak at 4527(3) keV has been reported to correspond to a p1
transition in [4], but no clear indication was found in our γp spectrum although a weak component at the level stated in [6] could not be excluded. On the contrary, a proton line at 3123 keV was assigned as a transition to the31
S ground state [4]. But, this proton peak was identified in our work to feed the first excited state in 31
S, so the previously proposed level at 4788(20) keV [4] was moved to an excitation energy of 6066(2) keV. A level at this excitation energy was already identified both by β-decay [4] and reaction work [21]. More detailed information can be extracted by looking at table 3. This re-organization of the assignments modified the B(GT) distribution at high excitation energies.
The 32
Ar and 31
S masses have been measured using Penning traps [8, 12] and the mass of 32
Cl was revisited by measuring the 32
S(3
He,t)32
Cl reaction with a Q3D magnetic spectrograph [11]. With these values we get a QEC = 11134.4(19) keV that
together with the 32
Ar half-life of T1/2=100.5(3) ms [6], and the absolute branching
ratios, allowed for the determination of the log(ft) values for all states. In table 3, the excitation energies in32
Cl determined from the observed protons and γ-rays are compared with the states determined by the 32
S(p,n) [26] and 32
S(3
He,t) [21, 27] reaction studies. The32
S(p,n) reaction was measured at 135 MeV by a time-of-flight technique. This measurement gives an estimate of the 32
Cl resonance positions. The uncertainties given in table 3 were added by the reviewer in the compilation work [18]. We have chosen to compare with the resonant states deduced in the 32
S(3
He,t) reaction work of [21] directly because the 11 keV shift in the 32
Cl excitation energy added by the rewiewer seems to be valid for low energy states but not over the full excitation energy range. The advantage of populating the states by β-decay is that the feeding to 1+
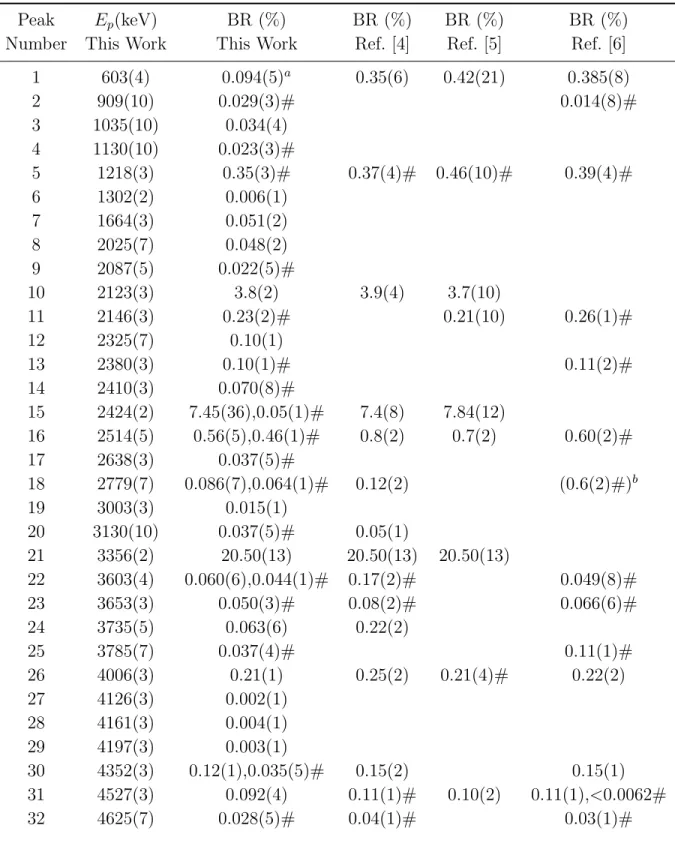
Table 2. List of observed β-delayed proton transitions from 32Ar decay. The numbering corresponds to the labels in figure 2. Transitions to the first exited state in 31
S at 1248 keV are marked with #. The branching ratios are compared with values from previous works [5, 4, 6]. The values from [4, 5] were renormalized to the new value of the branching ratio for the IAS [6].
Peak Ep(keV) BR (%) BR (%) BR (%) BR (%)
Number This Work This Work Ref. [4] Ref. [5] Ref. [6] 1 603(4) 0.094(5)a 0.35(6) 0.42(21) 0.385(8) 2 909(10) 0.029(3)# 0.014(8)# 3 1035(10) 0.034(4) 4 1130(10) 0.023(3)# 5 1218(3) 0.35(3)# 0.37(4)# 0.46(10)# 0.39(4)# 6 1302(2) 0.006(1) 7 1664(3) 0.051(2) 8 2025(7) 0.048(2) 9 2087(5) 0.022(5)# 10 2123(3) 3.8(2) 3.9(4) 3.7(10) 11 2146(3) 0.23(2)# 0.21(10) 0.26(1)# 12 2325(7) 0.10(1) 13 2380(3) 0.10(1)# 0.11(2)# 14 2410(3) 0.070(8)# 15 2424(2) 7.45(36),0.05(1)# 7.4(8) 7.84(12) 16 2514(5) 0.56(5),0.46(1)# 0.8(2) 0.7(2) 0.60(2)# 17 2638(3) 0.037(5)# 18 2779(7) 0.086(7),0.064(1)# 0.12(2) (0.6(2)#)b 19 3003(3) 0.015(1) 20 3130(10) 0.037(5)# 0.05(1) 21 3356(2) 20.50(13) 20.50(13) 20.50(13) 22 3603(4) 0.060(6),0.044(1)# 0.17(2)# 0.049(8)# 23 3653(3) 0.050(3)# 0.08(2)# 0.066(6)# 24 3735(5) 0.063(6) 0.22(2) 25 3785(7) 0.037(4)# 0.11(1)# 26 4006(3) 0.21(1) 0.25(2) 0.21(4)# 0.22(2) 27 4126(3) 0.002(1) 28 4161(3) 0.004(1) 29 4197(3) 0.003(1) 30 4352(3) 0.12(1),0.035(5)# 0.15(2) 0.15(1) 31 4527(3) 0.092(4) 0.11(1)# 0.10(2) 0.11(1),<0.0062# 32 4625(7) 0.028(5)# 0.04(1)# 0.03(1)#
Peak Ep(keV) BR (%) BR (%) BR (%) BR (%) Number This Work This Work Ref. [4] Ref. [5] Ref. [6]
33 4670(5) 0.006(1) 34 4775(3) 0.006(1) 35 4864(3) 0.042(5)# 0.05(1)# 0.053(6)# 36 4920(5) 0.006(1) 37 4987(5) 0.012(1) 0.013(4) 0.021(4) 38 5054(5) 0.006(1) 39 5138(5) 0.009(1) 40 5305(5) 0.006(1) 41 5350(5) 0.004(1) 42 5445(5) 0.009(1) 43 5510(5) 0.005(1) 44 5560(3) 0.110(5) 0.12(1) 0.15(2) 0.16(2) (45 5670(5) 0.013(1) 0.010(6) 0.04(2) ) 46 5828(3) 0.124(6) 0.09(1) 0.11(1) 47 5930(5) 0.009(1) 48 6065(5) 0.020(2) 0.020(4) 0.023(4) 49 6350(15) 0.010(3) 0.010(4) 0.012(4) 50 6550(15) 0.005(2) 51 6650(15) 0.002(1) 52 6750(15) 0.002(1)
a The intensity of this peak is most likely affected by the trigger threshold (see
text).
b Observed as a broad peak centrered at 2870(5) keV in [6].
With the branching ratios to the proton-bound and proton-unbound states, the excitation energies in 32
Cl, the QEC and the half-life, it is possible to determine the
Gamow-Teller strength B(GT) and its cumulative value in a large energy window in order to compare with shell-model calculations. We use the formula B(GT) = cte/ [(-1.2695(29))2
f (T1/2 / BR)] where cte = K/g2V = 6144.2(16) s [28]. The results are
listed in table 3.
The feeding to the 32
Cl ground state has been reported to be smaller than 2% [4], which corresponds to a log(ft) value larger than 5.7. The mirror decay, 32
Si(g.s.)−→
32
P(g.s.), has a log(ft) value of 8.2(1). This very large log(ft) value for a 0+−→
1+
transition is due to its ℓ-forbidden character. Assuming perfect mirror symmetry, we obtain for our case a branching ratio of 5.9(3)×10−3 %. This value is consistent with
the experimental limit and is adopted for the feeding of the32
Cl ground state.
To determine the B(GT) distribution from the proton-bound states, we calculate the total βγ branching ratio as 100% minus our total βp branching ratio and the β decay to the ground state. We assumed that γ decay from proton-unbound states is
Figure 4. a) Experimental B(GT) strength distribution for 32
Ar. All identifed states are shown. b) Comparison of the summed experimental B(GT) strength with the summed theoretical B(GT) strength distributions for individual transitions from shell-model calculations using the USD, USDa, and USDb effective interactions [23, 24], a curve is also shown, where we used only the states (tentatively) identified as 1+ states. A quenching factor of 0.5 was used for the predictions.
negligible except for the de-excitation found in [6] for the IAS with a branching ratio of 1.92(9)%. The uncertainty in β feeding to the 32
Cl ground state has a small effect on the final result, but rather affects the error of the βγ branching ratio. With a total βp branching ratio of 35.3(2)%, we obtain 64.7(10)% for the βγ decay. If the γ decay from the IAS in32
Cl (1.92(9)%) is subtracted, we obtain a feeding to the 1168.5(2) keV state in32
Cl of 62.8(10)%.
Comparing our total β-delayed proton branching ratio (35.3(2)%), obtained by summing all the branching ratios for proton transitions in table 2, with the value of Bhattacharya et al. [6] of 35.58(22)%, we obtain very good agreement.
In figure 4a), we show the experimental B(GT) distribution for all levels for all levels assigned in this work. In figure 4b), we compare the summed B(GT) distribution with the theoretical shell model predictions with different effective interactions [23, 24] using a 0.5 quenching factor for the theoretical calculations. All these calculations reproduce the main experimental characteristics mainly at low excitation energy in32
Cl up to the IAS. The summed experimental B(GT) value (see figure 4b and table 4) matches best with USDb shell-model calculations [23, 24], but we observe an excess in
the experimental B(GT) sum above 4 MeV and the shape differs above 7.5 MeV. This is also the case, if we use only the states identified or tentatively identified as 1+
states. For a more quantitative comparison, we have calculated the quenching factor from the summed B(GT) distribution within different energy intervals. The results can be seen in table 4. The comparison with models yield quenching factors of 0.5, as expected for sd shell nuclei, for levels in 32
Cl up to 4 MeV. As the excitation energy increases, the quenching factors tend to differ from this average value of 0.5, but when we reach the full energy range of this study (8.6 MeV excitation energy in32
Cl), the calculations agree again with the expected value.
A possible explanation for the disagreement at mid-excitation energies is that we are assigning GT strength to lower energies when it is supposed to be at higher energies. If any of the p0 or p1 proton transitions has a p2 component, the B(GT) strength
associated with that transition will be partially shifted to higher energies. But neither the energetics nor the penetrability favoured this possibility as the 2235.6 keV excited state in 31
S has spin/parity of 5/2+
. Therefore, proton emission from excited states fed by an allowed β transition to this 2235.6 keV state will be only possible with an angular momentum ℓ=2, be it both from the IAS (0+
) or from the 1+
states. This means that the p2 proton decay from the IAS in this experiment has an upper branching ratio limit
of 1.2×10⁻³ %, a factor of 10 lower than the measured p
1 branch. Furthermore, the
main de-excitation mechanism of the level at 2235.6 keV in 31
S is a γ transition to the ground state [29]. We have evaluated the detection limit of our experiment based on the proton-gated γ spectrum (see figure 2c). From the peak areas in this spectrum and the γ efficiencies at 1248.4 keV and 2235.6 keV, we obtain a ratio limit of Np2/Np1 of
0.54% which means that less than 0.03% of the decays of 32
Ar go through the second excited state of 31
S.
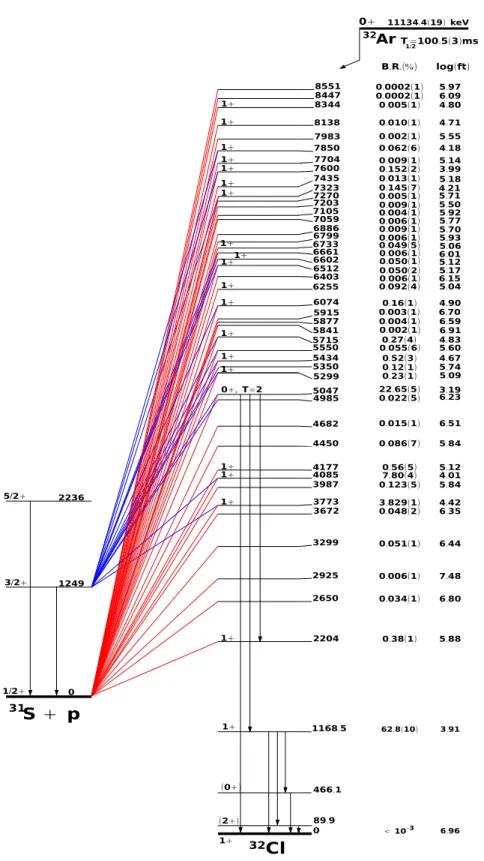
From the information gathered in this work, we have elaborated a decay scheme that can be seen in figure 5. Branching ratios and log(ft) values are given. Previously known Jπ values are given as well. Levels fed with a log(ft) value lower than 5 are
considered allowed transitions and a 1+
spin/parity value has been assigned. Levels fed with log(ft) values between 5 and 5.9 are tentatively considered allowed transitions and the spin/parity is given as (1+
). According to the compilation of Singh et al. [30], less than 1% of all known forbidden transitions have a log(ft) value smaller than 5.9. For instance, the state at 4080(7) keV was tentatively assigned a spin/parity value of (1-3)+
in [21]. As this level is fed by the allowed β decay of 32
Ar (log(ft)=4.01), we can conclude that the state has a spin/parity of 1+
. Proton emission from all these levels to the ground or to the first excited states in 31
S can proceed via ℓ=0 transitions and are thus not hindered by the angular momentum barrier.
Table 3. List of levels in 32Cl fed by 32Ar β+ decay. We compare the excitation energies deduced for these states in the present work with previous reaction studies [21, 22] and assign spin/parity values based on log(ft) values (see text). Energies in the fourth column are always for proton energies, except those labeled by γ that are for γ-rays. Experimental B(GT) values are given for each individual transition. Excitation energies have been calculated from the proton energies in the center of mass (ECM=Ep×1.032532(2)), the proton separation energy 1581.06(62) keV [6], and the energy of the γ-ray (1248.8(3) keV) in the case of transitions to the first excited state in 31S. The B(GT) strength of the ground state is not included in PB(GT) as it is expected to be negligible.
Ex Ex(32Cl) Jπ Eγ/Ep BR log(ft) B(GT) PB(GT)
(this work) [21, 26] (keV) (%)
0 0 1+ – <2% >5.67 <0.0082 1168.3(12) 1168.5(2) 1+ 707.4(2)γ 36.5(18) 3.91 0.4671 0.4671 1078.7(2)γ 12.0(7) 1168.5(5)γ 14.2(7) 2204(4) 2209.5(5)a 1+ 603(4) 0.38(1)b 5.88 0.0051 0.4722 2650(10) 2665(10) 1035(10) 0.034(4) 6.80 0.0006 0.4728 2925(2) 2941(5) 1302(2) 0.006(1) 7.48 0.0001 0.4729 3299(3) 3290(10) 1664(3) 0.051(2) 6.44 0.0014 0.4743 3672(7) 3692(7) 2025(7) 0.048(2) 6.35 0.0017 0.4760 3773(3) 3730(100) 1+ 909(10) 0.029(3) 4.42 0.1450 0.6210 2123(3) 3.8(2) 3987(6) 4002(6) (1+ ) 1130(10) 0.023(3) 5.84 0.0055 0.6265 2325(7) 0.10(1) 4085(2) 4080(7) 1+ 1218(3) 0.35(3) 4.01 0.3739 1.0003 2424(2) 7.45(36) 4177(5) 1+ 2514(5) 0.56(5) 5.12 0.0288 1.0292 4450(7) (1+ ) 2779(7) 0.086(7) 5.84 0.0055 1.0347 4682(3) 3003(3) 0.015(1) 6.51 0.0012 1.0358 4985(5) 2087(5) 0.022(5) 6.23 0.0022 1.0381 5047.5(16) 5046.3(4)d 0+ 2146(3) 0.23(2) 3.19 2838(1)γ 0.24(3)d 3356(2) 20.50(13)d 3878(1)γ 1.58(8)d 5046(1)γ 0.10(2)d 5299(3) 1+ 2390(4)c 0.17(1) 5.09 0.0313 1.0694 3603(4) 0.060(6) 5350(10) 5340(50) (1+ ) 2440(10) 0.05(1) 5.73 0.0071 1.0765 5434(3) 5466(6) 1+ 2514(5) 0.46(1) 4.67 0.0812 1.1577 3735(3) 0.063(6) 5550(2) 5578(8) (1+ ) 2638(3) 0.037(5) 5.60 0.0096 1.1673 3841(3) 0.018(1)
Ex Ex(32
Cl) Jπ E
γ/Ep BR log(ft) B(GT) PB(GT)
(this work) [21, 26] (keV) (%)
5715(3) 1+ 2779(7) 0.064(1) 4.83 0.0566 1.2239 4006(3) 0.21(1) 5841(3) 5813(7) 4126(3) 0.002(1) 6.91 0.0005 1.2244 5877(3) 4161(3) 0.004(1) 6.59 0.0010 1.2253 5915(3) 5905(7) 4197(3) 0.003(1) 6.70 0.0008 1.2261 6074(2) 6076(8) 1+ 3130(10) 0.037(5) 4.90 0.0478 1.2740 4352(3) 0.12(1) 6255(3) 6290(100) 1+ 4527(3) 0.092(4) 5.04 0.0346 1.3085 6403(5) 4670(5) 0.006(1) 6.15 0.0027 1.3112 6512(3) 1+ 3603(10) 0.044(1) 5.17 0.0257 1.3369 4775(3) 0.006(1) 6602(3) 1+ 3653(3) 0.050(3) 5.12 0.0288 1.3657 6661(5) 6680(15) 4920(5) 0.006(1) 6.01 0.0037 1.3694 6733(5) 1+ 3785(7) 0.037(4) 5.05 0.0335 1.4030 4987(5) 0.012(1) 6799(5) 6820(15) (1+ ) 5054(5) 0.006(1) 5.92 0.0045 1.4075 6886(5) (1+ ) 5138(5) 0.009(1) 5.70 0.0076 1.4151 7059(5) (1+ ) 5305(5) 0.006(1) 5.77 0.0065 1.4215 7105(5) (1+ ) 5350(5) 0.004(1) 5.92 0.0046 1.4262 7203(5) (1+ ) 5445(5) 0.009(1) 5.50 0.0121 1.4382 7270(5) (1+ ) 5510(5) 0.005(1) 5.71 0.0074 1.4457 7323(3) 7360(100) 1+ 4352(3) 0.035(5) 4.21 0.2347 1.6803 5560(3) 0.110(5) 7435(5) 7434(20) 1+ 5670(5) 0.013(1) 5.18 0.0252 1.7056 7600(3) 7580(20 1+ 4625(7) 0.028(5) 3.99 0.3914 2.0970 5828(3) 0.124(6) 7704(5) 7720(100) 1+ 5930(5) 0.009(1) 5.14 0.0279 2.1249 7850(3) 7831(20) 1+ 4864(3) 0.042(5) 4.18 0.2535 2.3784 6065(5) 0.020(1) 7983(15) (1+ ) 6200(15) 0.002(1) 5.55 0.0107 2.3891 8138(15) 8130(20) 1+ 6350(15) 0.010(1) 4.71 0.0742 2.4633 8344(15) 8300(100) 1+ 6550(15) 0.005(1) 4.81 0.0589 2.5231 8447(15) 6650(15) 0.0002(1) 6.09 0.0031 2.5262 8551(15) 8600(100) (1+ ) 6750(15) 0.0002(1) 5.97 0.0041 2.303 a From [11].
b Average from references [4, 5, 6].
c Average of the proton peaks in the γ-gated proton spectrum at 2380(3) and
2410(3) keV.
0.049(5) 1+ 6661 5.88 5.77 3672 0.009(1) 22.65(5) 5434 5.55 0.022(5) 6799 0.015(1) 5.06 4682 0.092(4) 0.006(1) 0.123(5) 0.152(2) 466.1 0.27(4) 4.90 5.09 3/2+ 1249 4.42 1+ 2204 1+ 7435 4.01 5.60 0.003(1) 0.048(2) 8447 0.56(5) 0.062(6) 7059 0.086(7) 0.051(1) 1+ 4085 7704 5.50 4.80 6.91 0.010(1) 0.050(1) 0.034(1) 5.84 7983 5.17 0.004(1) 8344 6733 0.006(1) 7.48 3.91 1/2+ 0 62.8(10) 0.52(3) 1+ 6074 1+ 5299 1+ 3773 5.70 4450 5550 0.0002(1) 0.006(1) 6.80 6.59 0.145(7) 0.004(1) 5.84 4.18 0.0002(1) 8551 5841 5.04 5.74 7203 3.99 6.96 1+ 7323 4.83 1+ 6512 6.23 5.97 5.14 0.013(1) 6.70 6.35 4.21 5.12 0.002(1) 0.38(1) 1168.5 0.006(1) 6.44 0.009(1) 5.71 6886 1+ 7850 0.006(1) 0+, T=2 5047 4.71 5.12 0.002(1) 5.92 4985 6.15 2925 5877 6255 6.01 3987 1+ 7600 1+ 5715 0.16(1) 0.23(1) 3.829(1) 6.09 2650 0.055(6) 5915 3.19 5.93 1+ 4177 4.67 5/2+ 2236 3299 7.80(4) 0.005(1) 0 0.005(1) 6.51 1+ 8138 6602 0.009(1) 0.050(2) 7270 7105 5.18 89.9 6403 11134.4(19) keV B.R.(%) log(ft) 0+ Cl 32 S + p 31 1+ (0+) 1+ (2+) 5350 0.12(1) 1+ 1+ 1+ 1+ 1+ Ar 32 =100.5(3)ms 1/2 T < 10-3
Figure 5. Partial 32Ar β+ decay scheme. Transitions to the31S ground state and to the first excited state are shown. Branching ratios and log(ft) values for the feeding of all states are given. The IAS branching ratio is taken from reference [6]. Spin and parities are assigned from the log(ft) values (see text). The feeding to the32Cl ground state is deduced from the mirror decay.
Table 4. Summed experimental and shell-model B(GT) distributions calculated up to the indicated limits. Quenching factors deduced from these values for each effective interaction agree with values accepted for the sd shell below 4 MeV and in the full energy range (8.6 MeV).
E limit Exp. USD USDa USDb q2
q2
q2
(MeV) PB(GT) PB(GT) PB(GT) PB(GT) USD USDa USDb 4 0.63(7) 1.071 1.06 1.58 0.59(6) 0.59(6) 0.40(4) 7 1.42(12) 2.56 2.45 2.10 0.55(5) 0.58(5) 0.68(6) 8 2.39(14) 2.61 2.67 4.01 0.92(5) 0.90(5) 0.60(3) 8.6 2.53(15) 5.23 5.47 4.87 0.48(3) 0.46(3) 0.52(3)
In spite of the large isospin symmetry breaking correction predicted for the 32
Ar 0+ −→
0+
transition, it is surprising that in none of the USD calculations a 0+
state is predicted near the IAS. We find an 1+
state 250 keV above the IAS and a level at 62(5) keV below the IAS. The β transition to the latter has a log(ft) value of 6.2(12). This value is a bit too low for an isospin forbidden 0+
−→ 0+
transition as the known log(ft) values are according to [30] between 6.4 to 8.17 for nuclei with A < 100. But it cannot be excluded due to the large uncertainty. It is argued in [31] that in the A = 32, T = 2 quintet a cubic term in the isobaric mass multiplet equation (IMME) is needed. The authors adressed the three aspects of isospin mixing using different interactions, USD [32], USDa and USDb [24]. They argued that the energy difference needed for a single T=1 state in 32
Cl to reproduce the coefficient of the cubic term is 73 keV for an average of the matrix elements for the three interactions. The level at 4985(5) keV identified from our γp coincidence data fulfils the energy requirement and could be responsible for the strong isospin symmetry breaking correction found recently [6]. While the log(ft) value argument is not conclusive for this level to be responsible of the mixing with the IAS, the level should however have a similar decay pattern to the one of the IAS. This means that a βp peak at around 3297(5) keV in the βp spectrum should be observed. Although a shoulder on the right hand side of the IAS proton peak is observed, our resolution does not allow to draw any firm conclusion.
6. Summary
We have performed a rather complete study of the β+
decay of 32
Ar through coincident proton and γ-ray spectroscopy. Using an experimental setup with high geometric proton detection efficiency, high granularity and high γ-ray detection efficiency, we have been able to extend the knowledge about this β+
decay and new states in 32
Cl have been established. We have detected new transitions to the31
S first excited state and we have been able to separate proton transitions into their ground-state and first excited state components where two transitions overlap in energy.
Comparing our experimental results with shell-model calculations, we checked the validity of the shell-model approach near the proton drip-line. We compared the summed B(GT) distribution from our work to shell model calculations. These results, together with those recently published on the33
Ar decay [13], settle the problem of the reduced quenching factor observed in the neutron-deficient argon isotopes. Differences between the summed experimental decay strength B(GT) with the one from shell model calculations could motivate a further experiment where low intensity proton transitions to the 31
S second excited state should be looked for.
We have determined from the γp spectrum a new level 62(5) keV below the IAS that could be partially responsible of the isospin symmetry breaking correction found in [6]. A proton transition from this state at 4985(5) keV to the31
S ground state could not be ruled out. A new experiment with better resolution is needed to search for this proton transition.
Acknowledgements
We thank the GANIL staff and, in particular, the accelerator crew for their support during the experiment. We are indebted to B.A. Brown for providing us with the shell-model calculations and for sending us the paper of reference [31] prior to publication. We express our gratitude to the EXOGAM collaboration for providing us with the germanium detectors. R. Dom´ınguez-Reyes acknowledges the support of the Spanish MEC under the FPI program, BES-2006-12480. This work was partly funded by the Conseil r´egional d’Aquitaine and the EU through the Human Capital and Mobility program. We acknowledge support from MICINN via contracts AIC10-D000584 and CICYT FPA2009-07387.
References
[1] Ichimura M, Sakai H and Wakasa T 2006 Progress in Particle and Nuclear Physics 56 446 [2] Caurier E, Martinez-Pinedo G, Nowacki F, Poves A and Zuker A P 2005 Rev. Mod. Phys. 77 427 [3] Hagberg E, Hansen E G, Hardy J C, Huck A, Jonson B, Mattsson S, Ravn H, Tidemand-Petersson
P and Walter G 1977 Phys. Rev. Lett. 39 792
[4] Bj¨ornstad T, Borge M J G, Dessagne P, von Dincklage R D, Ewan G T, Hansen P G, Huck A, Jonson B, Klotz G, Knipper A, Larsson P O, Nyman G, Ravn H L, Richard-Serre C, Riisager K, Schardt D and Walter G 1985 Nucl. Phys. A443 283
[5] Schardt D and Riisager K 1993 Z. Phys. A 345 283
[6] Bhattacharya M, (Melconian D M D, Komives A, Triambak S, Garc´ıa A, Adelberger E G, Brown B A, Cooper M W, Glasmacher T, Guimaraes V, Mantica P F, Oros-Peusquens A M, Prisciandaro J, Steiner M, Swanson H, Tabor S L and Wiedeking M 2008 Phys. Rev. C 77 065503
[7] Borge M, Hansen P, Jonson B, Mattson S, Nyman G, Richter A and Riisager K 1989 Z. Phys. A332413
[8] Blaum K, Audi G, Beck D, Bollen G, Herfurth F, Kellerbauer A, Kluge H J, Sauvan E and Schwarz S 2003 Phys. Rev. Lett. 91 260801
[10] Audi G, Bersillon O, Blachot J and Wapstra A H 2003 Nucl. Phys. A729 3
[11] Wrede C, Clark J A, Deibel C M, Faestermann T, Hertenberger R, Parikh A, Wirth H F, Bishop S, Chen A A, Eppinger K, Garc´ıa A, Kr¨ucken R, Lepyoshkina O, Rugel G and Setoodehnia K 2010 Phys. Rev. C 81 055503
[12] Kankainen A, Eronen T, Gorelov D, Hakala J, Jokinen A, Kolhinen V S, Reponen M, Rissanen J, Saastamoinen A, Sonnenschein V and ¨Ayst¨o J 2010 Phys. Rev. C 82 052501(R)
[13] Adimi N, Reyes R D, Alcorta M, Bey A, Blank B, Borge M, de Oliveira Santos F, Dossat C, Fynbo H, Giovinazzo J, Knudsen H, Madurga M, Matea I, Perea A, S¨ummerer K, Tengblad O and Thomas J 2010 Phys. Rev. C 81 024311
[14] Matea I, Adimi N, Blank B, Canchel G, Giovinazzo J, Borge M J G, Dom´ınguez-Reyes R, Tengblad O and Thomas J C 2009 Nucl. Instrum. Meth. A 607 576
[15] Azaiez F 1999 Nucl. Phys. A645 1003c
[16] Bergmann U C, Fynbo H O U and Tengblad O 2003 Nucl. Instrum. Meth. A515 1106
[17] Lennard W N, Geissel H, Winterbon K B, Phillips D, Alexander T K and Forster J S 1986 Nucl. Instrum. Meth. A248 454
[18] Endt P 1998 Nucl. Phys. A633 1
[19] Pyle M C, Garc´ıa A, Tatar E, Cox J, Nayak B K, Triambak S, Laughman B, Komives A, Lamm L O, Rolon J E, Finnessy T, Knutson L D and Voytas P A 2002 Phys. Rev. Lett. 88 122501 [20] Chen J and Singh B 2011 Nuclear Data Sheets 112 1393
[21] Jeanperrin C, Rosier L H, Ramstein B and Obiajunwa E I 1989 Nucl. Phys. A503 77
[22] Vouzoukas S, Browne C P, Giessen U, G¨orres J, Graff S M, Herndl H, Iliadis C, Lamm L O, Meissner J, Ross J G, Scheller K, van Wormer L, Wiescher M, and Rollefson A A 1994 Phys. Rev. C. 50 1185
[23] Brown B A and Wildenthal B H 1985 At. Data Nucl. Data Tables 34 347 [24] Brown B A and Richter W A 2006 Phys. Rev. C 74 034315
[25] Abbondanno et al U 1973 Nuovo Cimento 13A 321
[26] Anderson B, Chittrakarn T, Baldwin A R, Lebo C, Madey R, Tandy P C, Watson J W, Foster C C, Brown B and Wildenthal B H 1987 Phys. Rev. C 36 2195
[27] Wrede C, Clark J A, Deibel C M, Faestermann T, Hertenberger R, Parikh A, Wirth H F, Bishop S, Chen A A, Eppinger K, Freeman B M, Kr¨ucken R, Lepyoshkina O, Rugel G and Setoodehnia K 2010 Phys. Rev. C 82 035805
[28] Hardy J C and Towner I S 2009 Phys. Rev. C 79 055502 [29] D´etraz C, Moss C and Zaidins C 1989 Phys. Lett. 34 B 128
[30] Singh B, Rodriguez J, Wong S M and Tuli J 1998 Nuclear Data Sheets 84 487 [31] Signoracci A and Brown B A 2011 Phys. Rev. C submitted
![Table 1. List of γ-ray transitions in the 32 Ar β decay. The energies are taken from [18]](https://thumb-eu.123doks.com/thumbv2/123doknet/12842199.367308/7.918.276.609.219.442/table-list-ray-transitions-ar-decay-energies-taken.webp)

![Table 3. List of levels in 32 Cl fed by 32 Ar β + decay. We compare the excitation energies deduced for these states in the present work with previous reaction studies [21, 22] and assign spin/parity values based on log(ft) values (see text)](https://thumb-eu.123doks.com/thumbv2/123doknet/12842199.367308/17.918.115.783.344.1147/compare-excitation-energies-deduced-present-previous-reaction-studies.webp)