HAL Id: hal-01629903
https://hal.archives-ouvertes.fr/hal-01629903
Submitted on 6 Nov 2017
HAL is a multi-disciplinary open access
archive for the deposit and dissemination of sci-entific research documents, whether they are pub-lished or not. The documents may come from teaching and research institutions in France or abroad, or from public or private research centers.
L’archive ouverte pluridisciplinaire HAL, est destinée au dépôt et à la diffusion de documents scientifiques de niveau recherche, publiés ou non, émanant des établissements d’enseignement et de recherche français ou étrangers, des laboratoires publics ou privés.
Chemical vapour infiltration and mechanical properties
of carbon open-cell foams
Georges Chollon, Sophie Delettrez, Francis Langlais
To cite this version:
Georges Chollon, Sophie Delettrez, Francis Langlais. Chemical vapour infiltration and
me-chanical properties of carbon open-cell foams. Carbon, Elsevier, 2014, 66, pp.18 - 30.
Chemical vapour infiltration and mechanical properties of carbon open-cell foams
Georges CHOLLON*, Sophie DELETTREZ, Francis LANGLAIS
Laboratoire des Composites Thermostructuraux, CNRS-CEA-Safran-University of Bordeaux 1, 3, allée de La Boétie, 33600 Pessac France
Abstract
In order to improve their mechanical properties, carbon open-cell foams of two different pore sizes were infiltrated with pyrocarbon by chemical vapour deposition at reduced pressure and using pure propane as precursor. The optimal conditions in terms of deposition rate and uniformity in coating thickness, structure and anisotropy were first investigated for. Foam specimens were infiltrated at various stages, with two pyrocarbons of distinct microtextures and their morphology, relative density and geometrical features were evaluated.
Compressive crushing tests were conducted to determine the influence of the pore size, the pyrocarbon type and the relative density on the mechanical properties of the pyrocarbon-infiltrated foams. They retain their non-brittle and dissipating behaviour up to relative densities of 0.15. The stiffness, crushing strength and dissipated energy increase significantly with the relative density. The crushing behaviour of the pyrocarbon-foam specimens can be essentially explained using simple structural models and failure mechanisms, according to the Gibson & Ashby’s approach for brittle cellular solids.
1. Introduction
Open-cell vitreous carbon foams are refractory, lightweight and gas permeable materials which offer many potential applications in multiple fields. They could be used, for instance –in some cases with a protective ceramic coating–, as heat exchangers, catalysis supports or gas burners [1]. Their high electrical conductivity makes them also attractive for high temperature electrical devices such as fuel cells [2]. But their mechanical behaviour is also remarkable. In spite of the intrinsic brittle behaviour of vitreous carbon, the compressive stress-strain curves of the foams
*
display a long collapse plateau and a high energy absorption capability [3-6]. These materials may for instance find use as high temperature shock absorbers, for the transportation of hazardous or sensitive materials. However, the as-processed foams are extremely fragile because of their high porosity (98%), and their crushing strength is often too low for such demanding structural applications. Moreover, their thermal or electrical properties may also be inadequate for certain applications. The desirable thermal properties are indeed obviously disparate for a usage in heat exchangers or thermal insulators. The densification of the vitreous carbon foams with high a strength material appears naturally very attractive to improve their mechanical properties.
Chemical vapour deposition (CVD) is a versatile process of prime interest to achieve this goal. CVD coatings are generally smooth, dense and crack free, leading to particularly high fracture strength [7-10]. In proper experimental conditions, this process allows an accurate control of the composition, the structure of the coatings, and more particularly the thickness uniformity through porous substrates. It is usually referred to as CVI –I standing for infiltration– in this case. It has led to the development of high performance carbon and ceramic matrix composites (CMC) [11]. The CVD or CVI of refractory carbides has already been applied to reinforce reticulated vitreous carbon or mesophase-pitch-based carbon foams. [12-15]. But these few studies have not reported in details on the beneficial effect of the densification degree on the mechanical properties of the foams.
As in Lin et al.’s recent work [15], pyrocarbon (PyC) was the material selected to infiltrate the foams. PyC was chosen because of its high levels of electrical and thermal conductivities [16-18], two advantageous characteristics in the present case, as well as both strength and strain at failure [19, 10]. These properties, moreover, are all preserved up to extremely high temperatures. It is well known, however, that these characteristics, together with the ability to graphitize, strongly depend on both the structure at short range (i.e. the presence of defects in the carbon sheets) and the microtexture of PyC, i.e. the spatial arrangement of the layers and the anisotropic degree in particular [20-21]. Numerous studies on the CVD from methane (CH4) or propane (C3H8) have
shown that the structure and the microtexture of PyC are themselves directly related to the CVD experimental conditions (precursor type, P, T, residence time tr) [22-27]. It was well established
that the key factor controlling the growth mechanism, and thus the PyC structural and textural features, is the “maturation” of the gas phase [27], i.e., the succession of reactions occurring in
the gas phase [28-34]. The thickness gradient usually observed in porous substrates of high surface area to volume ratio (S/V) and the microtexture transition sometimes observed (due to S/V variation during infiltration) are also a consequence of local variations in the hydrocarbon species concentrations in the gas phase [25, 35-37].
The first purpose of this paper is to adjust the main CVD parameters (precursor type, P, T, tr) to a
proper infiltration of the vitreous carbon foams with pyrocarbon, i.e. conditions leading to a homogeneous deposit, in terms of both thickness and microtexture, of a well-defined type of PyC, while keeping the deposition rate at a reasonably high level. Pure propane as the precursor and reduced pressure (P < 10 kPa) were chosen as a compromise between reactivity and infiltration ability, as well as because of our experience with such a system [27]. In a second step, the infiltrated specimens have been characterized to correlate the structure, the microtexture of the coatings and the relative density of the foams, i.e. the thickness of the coating, with their mechanical properties. Uniaxial compressive crushing tests were chosen because they were found appropriate for all applications and especially for the most demanding one: shock absorption.
2. Material and experimental procedures
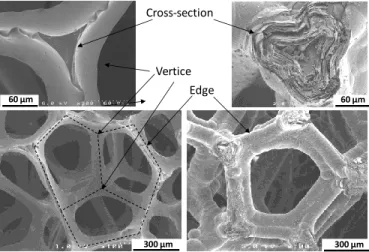
The initial vitreous carbon foams were synthesized by impregnation of polyurethane foams by a phenolic resin, thermal curing and pyrolysis (~1000°C) [38]. During the early stages of pyrolysis (~1000°C), the main part of polyurethane is vaporized, leaving the reticulated phenolic resin gradually forming a dense and continuous carbon skeleton which has the same structure as the polymeric foam. The resulting three-dimensional vitreous carbon foam consists of an arrangement of edges and vertices (Figure 1). Two different carbon foams were studied, having cell size of either 60 or 100 pores per inch (ppi). They have a common porosity of about 96%, resulting in a very lightweight material. Their apparent density is approximately of * = 0.06 gcm-3.
The hot-wall CVD reactor used to infiltrate the foams was described elsewhere [25]. The deposition chamber is a vertical silica tube heated by radio-frequency induction. The reactor was equipped with systems controlling accurately the temperature T, the total pressure P and the propane flow rate Q. For the kinetic study, the in situ measurements of the deposition rate were
achieved by hanging foam cylinders of dimension = h = 10 mm and positioned in the hot zone of the reactor, to a microbalance (Setaram B92) connected to the top of the reactor and allowing the acquisition of the weight gain versus time. The deposition rate (R, in μgcm−2s−1) was calculated assuming a constant specific surface area Sv0 = S/V, where S is the true surface and V
the apparent volume, for all the foam specimens of given cell size. An accurate value of Sv0 was
obtained by recording the initial weight gain rate using a specific CVD condition leading to a constant thickness through the whole specimen (see section 4.1). Sv0 was deduced from the
weight gain recorded during a short deposition time within the linear domain, the thickness and the density of coating (see paragraph below).
Figure 1: 60 ppi foam: non-infiltrated on the left side and infiltrated with HAL pyrocarbon on the right. Cell overview at bottom and edge cross-section on top.
The true density s of the foams was assessed by He-pycnometry (Accupyc 1330 from
Micromeretics). The morphology of the coatings was examined by field emission gun scanning electron microscopy (FEG-SEM, Hitachi S-4500, operating at 3kV). The structure and the anisotropic degree of the coatings were evaluated by polarized Raman microspectroscopy (RMS, from Horiba Jobin-Yvon, excitation wavelength He/Ne = 632.8 nm) according to a specific
procedure describes elsewhere [39].
The foam specimens were monitored by X-ray microfocus computed microtomography (Nanotome, from Phoenics X-ray) with a pixel size, after reconstruction, equal to 3 m.
The uniaxial compressive tests were performed with a universal testing instrument (Instron, model 4505) equipped with 1000 N load cell. The cylindrical specimens, 10 mm in height, were inserted between two stiff iron platens and crushed at a crosshead speed of 0.2 mmmin-1 (i.e. at a
Vertice Edge
300 µm 300 µm
60 µm 60 µm
strain rate of 3.3 10-4 s-1), with a simultaneous recording of the load, displacement and acoustic emission signal (A.E., in cumulated counts). The compliance of the compressive tooling was evaluated and found negligible compared with that of the stiffest foams. More details on the choice of the testing procedure and specimen geometry are discussed in section 4.2.1.
3. Microstructure of the non-infiltrated foams and preliminary remarks on infiltration
The cellular structure of the non-infiltrated vitreous carbon foams has been observed by SEM. The edges are solid and have a common three-cusp hypocycloid cross-section of Plateau borders (Fig. 1) [40-41]. The size of the cells and the section of the edges are relatively homogeneous. As in most foam materials, the edge connectivity i.e. the number of edges meeting at a vertex, is almost always equal to four, while the face connectivity i.e. the number of faces meeting at an edge, is equal to three. Most of the faces are bordered by five edges of relatively uniform length. Except the pentagonal faces, the structure of these polyurethane-based foams can be well represented as a regular packing of tetrakaidecahedron (or Kelvin) cells [40-46]. The 60 and 100 ppi foams both share common geometric features and differ essentially in scale, i.e. in cell size, strut length and thickness.
The apparent or geometric density: *, the index “0” referring to the non-infiltrated material and
the true density of the vitreous carbon solid: s, were both measured to assess the relative
density: */s and the porosity 1-*/s of the foams (Table 1).
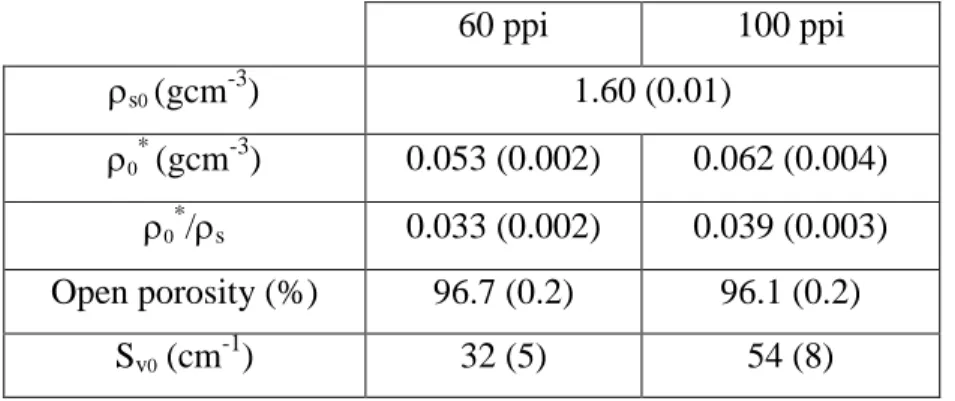
60 ppi 100 ppi s0(gcm -3 ) 1.60 (0.01) 0 * (gcm-3) 0.053 (0.002) 0.062 (0.004) 0 * /s 0.033 (0.002) 0.039 (0.003) Open porosity (%) 96.7 (0.2) 96.1 (0.2) Sv0 (cm -1 ) 32 (5) 54 (8)
Table 1: Geometrical properties of the non-infiltrated vitreous carbon foams. The standard deviation is given in brackets.
Both foams have a common value of s, as determined by He-pycnometry. This value of 1.60
gcm-3 is slightly higher than those generally reported for equivalent material: e.g. 1.55 gcm-3 in reference [47]. It is likely due to the highly divided structure of the foam, as opposed to bulk materials, favouring the gas removal during pyrolysis. The apparent, relative densities and the open porosity are relatively close for the two foams. Yet, * and */s are respectively slightly
higher for the 100 ppi foam than for 60 ppi specimen. Conversely, the specific surface Sv is
scale-dependant and significantly higher for the 100 ppi than for the 60 ppi specimen. As expected, the respective values of aSv, where a is the cell size or Sv/nppi, where nppi is the
number of ppi, are indeed constant for the two specimens.
The architecture of the foams at micrometer scale was also examined by X-ray microtomography. Binary 3D images were generated from the data after reconstruction, thresholding and segmentation. A discrete marching cubes algorithm and smoothing was used to compute the surface and calculate the main macroscopic features: */s and the specific surface area Sv =
S/V. The grey-level threshold was selected by adjusting Sv, as calculated from the 3D images, to
the experimental value determined from the weight gain and thickness measurements (see section 4.1). An algorithm based on isodistance maps was also developed to estimate the theoretical evolution of */s and Sv during infiltration, i.e. by assuming a uniform growth of the coating
throughout the foam, which occurs typically when mass transfer is much faster than chemical reactions. For the 60 and 100 ppi specimens, * and */s are expected to increase continuously
during deposition (Fig. 2).
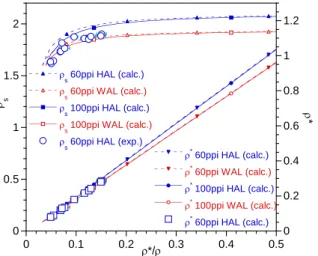
Figure 2: Correlation between true s, apparent * and relative */s densities of infiltrated PyC
foams. Symbols are for measured values and line drawings for calculated values.
0 0.5 1 1.5 2 0 0.2 0.4 0.6 0.8 1 1.2 0 0.1 0.2 0.3 0.4 0.5
s 60ppi HAL (calc.)
s 60ppi WAL (calc.)
s 100ppi HAL (calc.)
s 100ppi WAL (calc.)
s 60ppi HAL (exp.)
*
60ppi HAL (calc.)
*
60ppi WAL (calc.)
*
100ppi HAL (calc.)
*
100ppi WAL (calc.)
* 60ppi HAL (calc.)
s
*
*/
The calculated Sv value also increases with the density up to a maximum, for */s ≈ 0.4, and
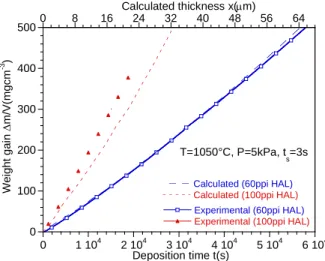
decreases for a higher densification (Fig. 3). For given volume of foam and deposition rate, the higher initial specific surface area of the 100 ppi foam is expected to result in a higher densification rate in terms of specific weight gain (m/V) versus time (see Fig. 4, the power-law shape of the curves is discussed in section 4.1.2).
Figure 3: Correlation between specific surface area S/V and relative density */s of infiltrated
PyC foams, as calculated. The insets show the same element of foam at two infiltration rates.
Figure 4: Weight gain of PyC foams and thickness of the PyC coating as a function of time. Symbols and solid lines are for measured values and dotted lines for calculated values.
4. Results and discussion
4.1 Infiltration of carbon foams
0 20 40 60 80 100 120 0 0.1 0.2 0.3 0.4 0.5 60ppi 100ppi S v0 = S0 / V ( cm -1 ) */ s 0 100 200 300 400 500 0 1 104 2 104 3 104 4 104 5 104 6 104
Experimental (60ppi HAL) Experimental (100ppi HAL)
Wei gh t ga in m /V (m gcm -3 ) Deposition time t(s) T=1050°C, P=5kPa, t s=3s
Calculated (60ppi HAL) Calculated (100ppi HAL)
0 8 16 24 32 40 48 56 64 Calculated thickness x(m)
The pyrocarbon coatings were prepared using pure propane as the precursor. The selection of the substrate temperature T, total pressure P, and residence time tr is essential to control the
microtexture of the pyrocarbon coating [27]. In the present study two different microtextures of pyrocarbon were aimed at in order to evaluate the respective properties of the PyC foams: a highly anisotropic laminar HAL, sometimes referred to as “regenerative laminar” ReL, and a weakly anisotropic laminar pyrocarbon WAL, often called smooth laminar SL [20, 27]. The first one, which has a high density and anisotropy, is obtained for a high maturation of the gas phase, promoting the formation of polycyclic aromatic hydrocarbons (PAH). The second one, with lower density and anisotropy, results from a lower maturation, i.e., rather from light aliphatic species [27]. Both HAL and WAL pyrocarbons were chosen because of their distinct longitudinal Young’s modulus (perpendicular to the growth direction) [10]. The high open porosity and the large pore size favour the gas diffusion and prevent the formation of closed porosity. But high S/V ratios can sometimes lead to thickness gradients and transitions in the pyrocarbon microtexture (see section 1). The influence of the experimental conditions of the CVD from propane is known but only for flat substrates [27]. A homogeneous PyC infiltration, in terms of both thickness and microtexture, requires extending this study specifically to the high porosity carbon foams.
4.1.1 Kinetic study of the pyrocarbon coatings
For thin coatings, while the surface of the substrate (S0) is assumed to be constant, the linear
variation of the weight gain m versus time t reveals a steady-state deposition regime and allows the assessment of the deposition rate R = (m/t)/S0 in gmin-1cm-2.
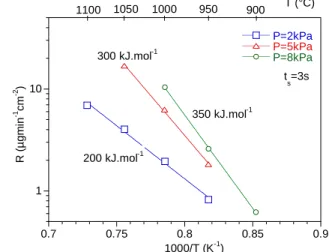
The preliminary stage of the kinetic study consisted in fixing a residence time tr= 3 s, a total
pressure P of 2, 5 or 8 kPa and increasing the temperature step by step from 900 to 1100°C. The weight gain varies linearly with time within the whole temperature range for P = 2 kPa and only below 1050 and 1000°C, respectively for P = 5 and 8 kPa (see initial curve parts in Fig. 4). At higher temperatures, a homogeneous nucleation phenomenon is observed, resulting in a catastrophic weight gain due to the surface increase of the sooty specimen. Within the stationary
regime, the deposition rate R obeys an Arrhenius law throughout the whole temperature domain (Fig. 5).
Figure 5: Deposition rate R on 60 ppi foams as a function of total pressure P and deposition temperature T, for a residence time tr = 3 s.
The apparent activation energy varies from 200 to 350 kJmol-1, while the pressure increases from 2 to 8 kPa, similarly to what was observed for the CVD on flat substrates [33]. On the basis of this initial study, a set of three (T; P) conditions were chosen to investigate the influence of the residence time. tr is indeed the most influential parameter for the maturation of the gas phase and,
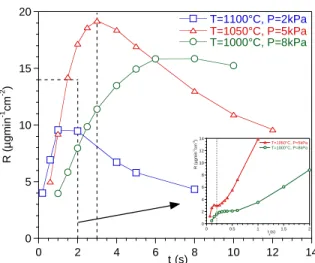
consequently, for WAL HAL microtexture transition [27]. The influence of tr on R is shown in
Figure 6 for the same three (T; P) conditions as above. The curves reveal a maximum, which is again very similarly as already observed for dense substrates [25, 27]. The first increasing part was suggested to result from the gradual increase of the PAH concentration in the gas phase. It is associated with the high activation energy (Fig. 5) and is expected to give rise to a HAL pyrocarbon. On the other hand, the second -decreasing- part of the curves would be caused by the depletion of PAH at higher residence time, likely due to deposition on the reactor walls. It should be associated with a lower activation energy and may result in a WAL pyrocarbon, smaller aliphatic species being again predominant in the gas phase.
1 10 0.7 0.75 0.8 0.85 0.9 P=2kPa P=5kPa P=8kPa 900 950 1000 1050 1100 R ( µ gm in -1 cm -2 ) 1000/T (K-1) T (°C) 300 kJ.mol-1 200 kJ.mol-1 350 kJ.mol-1 t s=3s
Figure 6: Deposition rate R on 60 ppi foams as a function of total pressure P, deposition temperature T and residence time tr.
4.1.2 Infiltration of HAL pyrocarbon
The above study allows the selection of CVD conditions that are a priori favourable to the synthesis of HAL pyrocarbon. The condition T = 1050°C, P = 5kPa and tr = 3s was chosen to
characterize the morphology, structure and microtexture of the coating, to check that it effectively belongs to the HAL microtexture category, to control its thickness uniformity and finally, to prepare several specimens of different relative densities, i.e. of different PyC thicknesses, for mechanical characterization. This condition indeed gives rise to a high deposition rate and likely results in a high concentration of PAH in the gas phase, which is propitious for the deposition of HAL pyrocarbon.
An example of weight gain curve (m/V) recorded in the same above conditions is reported in Figure 4. Several specimens were prepared in the same conditions, leading to a scattering of the deposition rate of about 20%, most likely because of a slight temperature change due to the specimen positioning in the reactor. As expected (see section 3), the weight gain rate of the 100 ppi foam is significantly higher than that of the 60 ppi foam, due to the higher specific surface Sv
of the former (Table1, Fig. 3). The shape of the weight gain curves denotes an increase of the weight gain rate at the beginning of deposition, due to the increase of the surface area of the specimen at low densities. This effect is well described by calculation: see Fig. 3 for */s < 0.4
and Fig. 4. 0 5 10 15 20 0 2 4 6 8 10 12 14 T=1100°C, P=2kPa T=1050°C, P=5kPa T=1000°C, P=8kPa R ( µ gm in -1 cm -2 ) t s(s) 0 2 4 6 8 10 12 14 0 0.5 1 1.5 2 T=1050°C, P=5kPa T=1000°C, P=8kPa R (µ g m in -1cm -2) ts(s)
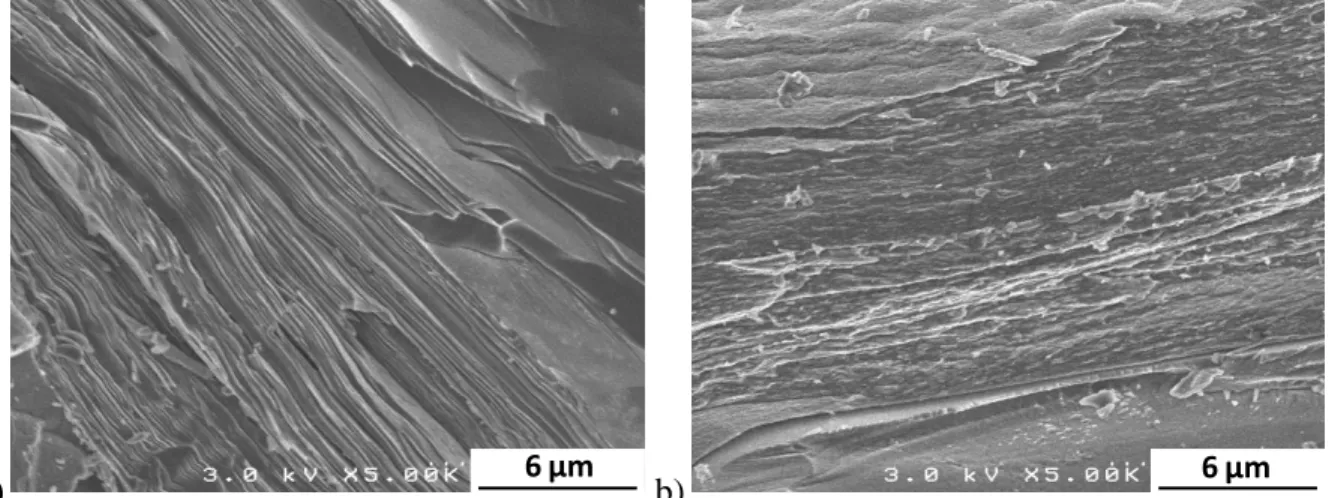
The surface of the coating is smooth and the fractured cross-section shows a flat and lamellar morphology (Fig. 7a) typical of highly anisotropic pyrocarbons such as the rough laminar RL [10, 48] or the HAL. The latter is referred to as either ReL, by Bourrat et al., or “RL-PCVD”, by Sauder et al. [10, 20, 49].
a) b)
Figure 7: Fractured cross-section of PyC coatings. Processing conditions: T = 1050°C, P = 5 kPa. (a) HAL-PyC: tr = 3s, (b) WAL-PyC: tr = 0.2 s.
The structural and textural features of the coating were investigated by Raman microspectroscopy (RMS). This technique indeed reveals the short range structural ordering of the graphene layers, which is related to the density of in-plane defects, through the bandwidth of the D peak (FWHMD) [20]. Placing a polarizer in the scattered light beam allows measuring the anisotropy at
the micrometer range, i.e. the preferential orientation degree of the carbon sheets, through the parameter RA. The incident laser beam being plane-polarized parallel to the coating, along Y axis,
the anisotropy is quantified by the ratio RA of the Raman intensities obtained without polarizer
(Y+Z) and with the polarizer oriented perpendicularly to the coating, along Z: RA = I(Y,Y+Z)/I(Y,Z)
[39, 50]. Several measurements were performed at different positions along the cross-section of the specimens. Two ReL and SL-PyC references, similar specimens as in [20, 39, 49], were also analysed by RMS for comparison. The FWHMD and RA values of respectively ~160cm-1 and
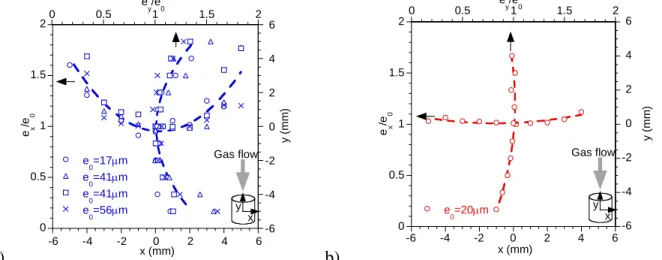
6.5-7.5, confirm that the coating belongs to the category of HAL (or ReL) pyrocarbons (Fig. 8) [39]. The thickness uniformity was evaluated along several longitudinal cross-sections, at different densification degrees (Fig. 9a). For both the 60 and 100 ppi foams, the radial and longitudinal thickness profiles are nearly symmetrical with a steep gradient at the edges, the thickness being about 30-35% less in the middle of the specimen. Such a thickness gradient reveals that
heterogeneous reaction kinetics is faster than gas diffusion through the porosity of the foam. The depletion of the most reactive species (PAH) from the near surface to the interior of the foam leads to a lower deposition rate inwards [51]. In agreement with the prediction, the true density s
of the foams, as measured by He-pycnometry, increases rapidly with both apparent and relative densities to reach a nearly constant level corresponding to the value for pure pyrocarbon (see Fig. 2, in the case of HAL-PyC).
Figure 8: Structural (RA) and textural (FWHMD) features of the PyC coatings, as-deduced from
RMS. Processing conditions: T = 1050°C, P = 5 kPa. HAL-PyC: tr = 3s, WAL-PyC: tr = 0.2 s.
The inset shows an example of coating cross-section submitted to RMS.
a) b)
Figure 9: PyC thickness profiles of the 60 ppi foams (T = 1050°C, P = 5 kPa): (a) HAL-PyC: tr =
3s, (b) WAL-PyC: tr = 0.2 s. ex/e0 and ey/e0 are ratios between thicknesses along x and y axes,
respectively (see inset), and the value at the center of the foam e0 (see legend).
60 80 100 120 140 160 180 200 2 3 4 5 6 7 8 9 10 HAL reference t s=3s core t s=3s surface WAL reference t s=0.2s core t s=0.2s surface F WH M D ( cm -1) R A HAL WAL 0 0.5 1 1.5 2 -6 -4 -2 0 2 4 6 e 0=17m e 0=41m e 0=41m e 0=56m e x /e 0 x (mm) Gas flow x y -6 -4 -2 0 2 4 6 0 0.5 1 1.5 2 y (m m ) e y/e0 -6 -4 -2 0 2 4 6 0 0.5 1 1.5 2 y (m m ) 0 0.5 1 1.5 2 -6 -4 -2 0 2 4 6 e 0=20m e x /e 0 x (mm) x y Gas flow e y/e0
The asymptotic value of HAL is however slightly lower than that of 2.09 gcm-3 already reported
for ReL [49]. If both highly anisotropic pyrocarbons can be classified in the same microtextural category, in terms of TEM and RMS features, the ReL-PyC mentioned in the latter work was actually prepared in completely distinct conditions [49]. The pulse-CVI process using toluene might have led to a value of density different from that of the present HAL-PyC, which is deposited from propane at constant pressure.
4.1.3 Infiltration of WAL pyrocarbon
Previous studies have established that WAL pyrocarbon can be obtained either for low residence times, when only light propane-derived species are present in the gas phase, the deposition rate being consequently very low, or for high tr, when the PAH concentration drops due to
heterogeneous reactions [25, 27]. The microtexture of the coatings prepared in the latter conditions (T=1050°C, P=5kPa and tr = 6-12 s) was however found to belong to the HAL-type. A
kinetic study was therefore performed at very short tr (tr < 1 s), to specifically identify the most
favourable conditions to deposit WAL-PyC. The R(tr) curve is again similar to that observed in
similar conditions for the CVD on flat substrates (see inset in Fig. 6) [25, 27], with a characteristic plateau, for which WAL-PyC is expected to be deposited. The gas phase is indeed free of PAH in this case. The effective precursors are rather light C2 species leading to distorted
carbon layers and a low density and anisotropy. Foam specimens were infiltrated in the conditions: T = 1050°C, P = 5 kPa and tr = 0.2 s. The RMS analyses revealed that the pyrocarbon
obtained in this case is indeed less anisotropic and belongs, as expected, to the WAL category (Fig. 8). The morphology of the cross-section of the coating shows a heavily-curved lamellar structure at small scale, characteristic of WAL (or SL) pyrocarbons (Fig. 7b) [10, 48]. The deposition rate is significantly lower than for the HAL, due to the much lower reactivity of C2
species compared to PAH [26]. The thickness of the coating is consequently much more uniform through the section of the specimen (Fig. 9b) [51].
Conditions suitable for the infiltration of HAL and WAL pyrocarbons and leading to a relatively uniform thickness through the foams were proposed. The influence of the experimental parameters on the deposition rate is close to what was already reported for real CVD, on flat
substrate, suggesting similar mechanisms. The WAL HAL transition observed from low to higher residence times probably arises from the maturation of the gas phase, from light aliphatic and poorly reactive species, to more reactive PAH, leading to steeper thickness gradients. Despite the depletion of the most reactive species inwards, the S/V ratio of foams is apparently sufficiently low for the experimental conditions to remain close to those for pure CVD.
4.2 Mechanical properties of the foams
The foams infiltrated with the two different types of pyrocarbon (HAL and WAL), at different stages of densification (*/s ≈ 0.02-0.15), were submitted to compressive tests. Even if
performed in quasi-static conditions, crushing is indeed one of the most relevant tests to evaluate materials for structural and/or impact energy absorption purposes. Long-term static compressive tests indeed showed that the initial vitreous carbon and the infiltrated PyC foams are purely elastic and that the stress-strain behaviour is not time dependent at room temperature in quasi-static loading conditions, as opposed for example to organic foams [6]. Besides, several high-strain-rate impact studies showed that the compressive strength of brittle materials such as rocks, concrete and ceramics (SiC, Al2O3) remains almost constant up to a strain rate of 102-103 s-1, and
increases by a factor of 2 to 3 beyond this limit [52-53]. Such a strain rate typically applies during a 10-100 ms-1 velocity impact on a 100 mm-thick specimen. Even if very little is known about the strain-rate effects on pure carbon materials (e.g. vitreous carbon or graphite), one can presume that PyC foams should retain their quasi-static crushing behaviour during impacts at low or medium velocities (or energies). Pressure increase (the air flowing freely through the cells), shock enhancement and micro-inertia effects should be very limited due to the high open porosity of the PyC foams [54]: this should result in a lesser strain-rate sensitivity than for dense materials.
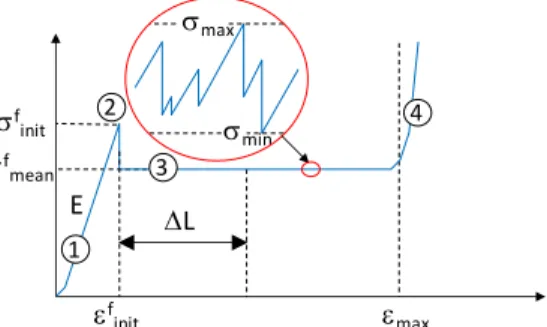
The typical behaviour of brittle cellular solids during compression is generally described as follows (Fig. 10) [3, 55-56]: a short elastic domain is initially observed, corresponding to the elastic strain of each individual cell: (1). It is followed by the initial failure (finit, finit), due to the
simultaneous collapse of several neighbouring cells in the specimen (2). The initial failure is followed by a succession of elastic strain and brittle failures, the load fluctuating between fmin
successively and the debris fill progressively the open porosity of the intact specimen, is observed until certain strain level (d). Beyond d, the porosity of the remaining undamaged part of the
specimen is totally filled with debris and the stress then rises abruptly (4). This final stage is usually referred to as “densification” [55-56].
Figure 10: Typical crushing behaviour of a brittle cellular solid and parameters extracted from the crushing curves.
4.2.1 Preliminary results on non-infiltrated foams and choice of the testing procedure
The mechanical behaviour of brittle foams may be strongly affected by some experimental factors such as the cross sectional area of the specimen and the boundary conditions, i.e. the bonding -or not- of the specimen ends to the loading platens and the containment -or not- of the debris during crushing. As discussed below, the cross-sectional area of the specimen will affect the amplitude of the stress fluctuation and less significantly the mean plateau stress fmean. The
bonding of the specimen ends to the stiff loading platens, or the insertion of a compliant layer in between, leads to a more homogeneous distribution of the load through the section and, consequently, to a higher value of finit [57-59]. The debris confinement allows a more accurate
determination of d, especially for small section specimens. Without confinement, many
fragments produced from the outside of the foam are ejected while those from the interior all remain in the open porosity, leading to an inhomogeneous “densification” of the foam.
Preliminary tests were carried out on cylinders of non-infiltrated foams of various cell sizes (30, 60 and 100 ppi) and cross-sectional areas A and by using different configurations of the contact with the loading platens. Although no visible anisotropy of the cells was observed for the 60 and 100 ppi foams, the cylindrical specimens were all cut along a common axis in the same block.
f mean max L f init f init E min max 1 3 2 4
Contact conditions have a strong influence on finit [57-59]. For a 60 ppi specimen, finit was
indeed improved by a factor 4 by bonding the specimen ends, the rest of the crushing behaviour, including fmean value, remaining almost unchanged (not shown). The extension of the initial
elastic domain before failure allows a better evaluation of the Young’s modulus from the linear part of the stress-strain curve. On the other hand, the higher amount of elastic energy accumulated −and therefore of damage created at the initial failure− induces some instability on the stress plateau after the initial failure, usually as a momentary drop below fmean before
recovery. Furthermore, the adhesive penetrates partially the foam and alters the assessment of d
for thin specimens.
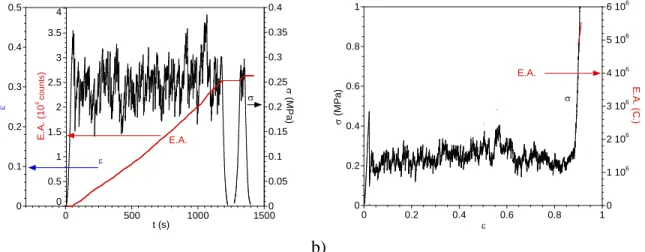
The crushing behaviour of the vitreous carbon foams is very similar to that already reported for similar materials [3-5, 59], and more generally for brittle materials [55-56], as illustrated above (Fig. 11a-b). The acoustic emission signal reveals the gradual damaging of the specimen during crushing, by successive failures of the vitreous carbon edges, (Fig. 11a-b). No damage was detected during elastic deformation, i.e. during the initial loading or an unloading/reloading cycle (Fig. 11a).
a) b)
Figure 11: Typical crushing curves of non-infiltrated 60 ppi foam: (a) stress, strain and A.E. signal versus time, (b) stress and A.E. signal versus strain.
Crushing tests of specimens of various cell sizes: 30, 60 and 100 ppi, for a constant cross-section area A ≈ 700 mm2, showed an increase of mean when the cell size decreases (not shown). The
so-called edge effect i.e., the stress drop due to a too small cell size/specimen diameter ratio, the cells at the specimen’s edges do not contributing to the mechanical properties [60], can be
0 0.1 0.2 0.3 0.4 0.5 0 0.05 0.1 0.15 0.2 0.25 0.3 0.35 0.4 0 500 1000 1500 ( M P a) t (s) E.A. 0 0.5 1 1.5 2 2.5 3 3.5 4 E .A . (10 6 co u n ts ) 0 0.2 0.4 0.6 0.8 1 0 1 106 2 106 3 106 4 106 5 106 6 106 0 0.2 0.4 0.6 0.8 1 ( M P a) E .A . ( C .) E.A.
neglected for both the 60 and 100 ppi specimens. The increase of fmean with nppi likely arises
from the Weibull distribution of the fracture strength of vitreous carbon and the influence of the tested strut volume [61]. Gibson and Ashby (referred to as G&A in the following) calculated a theoretical crushing strength (*cr) assuming a representative cell with an ideal periodic structure
consisting a cubic array of square edges of length l and thickness t, failing in flexion at constant deflection [56]. According to this theory, at given a level of relative density, i.e. at constant t/l ratio, *cr is indeed expected to increase when the strut length l −or the cell size− decreases [56].
The influence of the cross-sectional area A on the crushing strength was also studied, either with two identical compressive cylindrical platens, or with a stiff and flat-ended cylindrical indenter of diameter = 2, 4 or 10 mm. In the former case, the specimens were tested with debris confinement, a thin plastic foil being wound around the specimen and the two platens of diameter
= 10 or 30 mm. The changes of the minimal (fmin), maximal (fmax), mean (fmean) and the
standard deviation of stress fluctuations (f) along the plateau are shown in Figure 12.
Figure 12: Characteristic plateau strengths of non-infiltrated 60 ppi foams, as a function of cross sectional area A. fmean, fmin, and fmax are respectively the mean, minimal and maximal
strengths. f is the standard deviation of stress fluctuations.
f
max, fmean and more particularly f all increase when A decreases. The stress variations along
the plateau are related to the load redistribution at the contact, i.e. essentially to the change of the number of cell vertices or edges in contact with the platen or the indenter. G&A calculated the crushing stress during indentation using a probabilistic description of the contact by assuming a statistical distribution of cells in the volume but having the same ideal structure and failure
0.001 0.01 0.1 f 0.1 1 1 10 100 1000 f max(indent.) f min(indent.) f mean(indent.) f max(comp.) f min(comp.) f mean(comp.) f ( M P a) A (mm2) f ( M P a)
mechanism as described above [56, 59]. This basic approach leads to a stress oscillation amplitude of standard deviation f (or fmax, for low A values) proportional to A-1/2 [56], in good
agreement with the experimental data (Fig. 12). On the other hand, this model does not explain the increase of fmean when A decreases, as observed especially at low A values. This result
reveals the limitations of G&A’s model assuming an ideal geometry of the cells and a fully deterministic failure. The characteristic stresses fmin, fmax, fmean and f, will therefore be
compared at constant section A in the following study of the foams infiltrated at variable density levels.
In conclusion of these preliminary tests, the testing procedure of the infiltrated 60 and 100 ppi foams was defined as follows. The dimensions of the infiltrated specimens were = h = 10 mm (A = 79 mm2). They were tested at a strain rate of 3.3 10-4 s-1, with debris confinement and without bonding. The foams were introduced in a cylindrical die, the specimen being laterally loose enough to avoid friction forces due to the Poisson effect, to maintain a pure uniaxial stress field during compression. Instead of focussing on the maximum strength carrying capability, i.e. the crushing strength *cr, as defined by G&A as in most of the earlier studies [4-6, 58-61], the
priority here was given to an accurate assessment of the various stress plateau features: fmean,
f
and d, which are more relevant considering the impact absorption application. However, in
order to get reproducible finit and E* values, E* being the apparent Young’s modulus, i.e. the
maximal slope along the initial quasi-linear stress-strain domain, the two ends of the specimens were carefully polished before testing to maximize the initial number of contacts with the platens.
4.2.2 Compressive tests on PyC-infiltrated foams
Examples of crushing curves for 60 ppi foams infiltrated with HAL-PyC at different densities, are presented in Figure 13.
Figure 13: Typical crushing curves of 60 ppi foams infiltrated with HAL-PyC at different apparent densities.
As expected, the stiffness and the initial failure strength both significantly increase with the apparent density (Fig. 13-14). The typically brittle crushing-type curves as well as the influence of the relative density on the maximum strength attained are relatively similar to those reported for tannin-based vitreous carbon foams [4]. The same authors reviewed the compressive strength of a variety of carbon foams [5]. They recently modified their initial process and could attain crushing strengths up to 8 MPa at */s = 0.15 [5]. Yet, some of the high density specimens
tended to lose their though behavior and failed by macrocracking rather than multi-fragmentation. For low-density specimens, an initial linear behaviour of the stress-strain curve is clearly observed while simultaneously no damaging is revealed by A.E. E* is probably close to the effective Young’s modulus value in this particular case. For the infiltrated specimens having higher apparent densities, the first isolated edge or cell failures, as evidenced by AE, occur locally at the contact with one of the two loading platens, at a very low macroscopic strain level, before a uniform load distribution through the specimen section is reached. This is due to the fact that thicker cell edges coming into contact with the platen fail at lower strain. Indeed, according to G&A’s model, cell edges of larger thickness t and constant length l break at lower deflection
c, with c = fsl2/Est, the failure stress fs and Young’s modulus Es of the edges being assumed to
be constant [56]. This initial damage at the contact also results in a drop of the apparent stiffness, before the main initial failure occurs, due to the simultaneous collapse of a significant number of
0 1 2 3 4 5 0 0.2 0.4 0.6 0.8 1 * =0.08gcm-3 * =0.12gcm-3 * =0.19gcm-3 * =0.27gcm-3 * =0.30gcm-3 ( M P a)
adjacent cells. The linear elastic domain is not observed in this case and the maximum of the stress-strain slope (E*) leads to underestimated values of the Young’s modulus of the foam. This is probably the reason why E* increases linearly with */s (Fig. 14), in contradiction with the
parabolic law predicted by G&A [56] or other power laws considering a more accurate description of the structure and the elastic response of the foams [40, 42, 46].
Figure 14: Apparent initial Young’s modulus E*
, densification strain d and dissipated energy W
of 60 ppi HAL-PyC foams, as a function of relative density.
Only a few authors have measured the elastic modulus of similar carbon foams. The values obtained from tannin-based vitreous carbon foams were found within 3-100 MPa for a comparable range of relative density: 0.035-0.15 [4-5]. Such E* values, lower than in the present work, could be due the higher stiffness of pyrocarbon compared with tannin-based vitreous carbon. They could also be related to a different damage process occurring in these foams, which might affect the assessment of the elastic modulus, as shown by the particular shape of the crushing curves [5].
As E*, the finit value is also likely lower than the theoretical crushing strength *cr, as defined by
G&A. This ultimate *cr value is indeed expected to be reached for a uniform load distribution
and can only be approached by bonding the specimen ends or by inserting a compliant material between the specimen ends and the platens [59]. For the high density foams, the stress drops to a level generally well below the mean plateau value fmean, immediately after the main initial
failure, before recovering a steady-state crushing behaviour (see in Fig. 13, for * ≥ 0.19 gcm-3).
0 0.5 1 1.5 2 W ( M Jm -3 ) 0 100 200 300 400 500 E * (M P a) 0.7 0.75 0.8 0.85 0.9 0 0.04 0.08 0.12 0.16 d ( M P a) */ s
The same phenomenon was observed for non-infiltrated foams tested with bonded ends (see section 4.2.1). It is due to the sudden elastic energy release resulting from the simultaneous rupture of a large number of cells, which usually occurs at one of the loading platens. For the infiltrated specimens with non-bonded ends, this initial instability is probably related to the polished surfaces promoting a larger number of contact points at the initial loading, than during steady-state crushing. The mean stress fmean, the standard deviation f and the maximal and
minimal stresses fmax and fmin, recorded along the plateau for finit < < d, are plotted in Figure
15 versus the relative density for the 60 ppi HAL-PyC foam.
Figure 15: Characteristic plateau strengths of 60 ppi foams infiltrated with HAL-PyC, as a function of relative density. fmean, fmin and fmax are respectively the mean, minimal and
maximal strengths and f is the standard deviation of stress fluctuations. The error bars represent +/-f.
The mean stress fmean, but also the maximum stress fmax and fluctuations fmean, significantly
increase with the density. Except for the higher densities, fmax is relatively close to finit. This
stress value corresponds to a maximum number of edges in contact with the loading platens, a condition obtained either initially after polishing, for 0 < < finit, or randomly, during
steady-state crushing, for finit < < d. In a first approach, the shape of both fmean and fmax curves
versus */s agrees well with the law established by G&A, connecting the relative density with
the macroscopic (*cr) and microscopic (i.e. of an individual strut, fs) failure strength [56]:
* cr/fs ≈ 0.2(*/s)3/2 (1) 0 1 2 3 4 5 0.02 0.04 0.06 0.08 0.1 0.12 0.14 0.16 f init f max f min f mean f ( M P a) */ s
The best fit power-laws obtained for the fmean and fmax indeed lead to an exponent of 1.37 and
1.29 respectively, to compare with 1.5 in equation 1. However, this law is overly restrictive in terms of structure and damage description. It is even inaccurate, as mentioned above, considering that the macroscopic load is obviously not equally distributed on individual cells, during steady stat crushing, but concentrated at the specimen ends in contact with the platens. The expected value of *cr is indeed probably higher than fmax (see the influence of the load transfer through
contact in section 4.2.1) and even probably several times larger than fmean [59]. The other theory,
often called “indentation approach”, is more relevant in the present case (see again section 4.2.1). The cell structure and the failure process considered are similar but the probabilistic description of the cells coming into contact with the platen and failing, now accounts for the stress oscillations along the whole crushing plateau. The mean and the standard deviation of the number of cells in contact during crushing can be deduced from the individual cell properties (l, t, fs, Es)
and the section of the loading platen A [56],:
f
mean = fs2t2/6Esl2 (2)
f
= fmean(Estl/As)1/2 (3)
We have seen above that this model explains that f increases linearly with A1/2 for a given foam specimen. If fs does not vary significantly when the PyC coating gets thicker, i.e. when t
increases, these equations account for a linear increase of fmean with the relative density, as
opposed to the 3/2-exponent power-law of equation 1. Even if less satisfactory than equation 1, such a linear variation of fmean is still in acceptable agreement with the experimental results if
one considers the large standard deviation at high densities. But the main benefit of this model, as opposed to equation 1, is to describe the entire steady-state crushing behavior and further explain the increase of f with */s (Fig. 15). The validity of the indentation approach must be
considered with care, however, as it does not take into account the dispersion of the failure properties arising from (i) the random structure of the foam, i.e. of each cell and its interacting neighbors, and (ii) the constitutive material itself, which involves a certain flaw size distribution.
As expected, the maximum crushing strain (d) decreases linearly when the density increases
(Fig. 14), according to:
d = 1 - */*resid (4)
where *resid is the residual density at full debris compaction (*resid ≈ 0.7s). The value of *resid
depends on the geometry of the fragments, which itself varies with the densification rate, i.e. with the thickness of the PyC-coated edges. The value of *resid is also likely related to the maximal
crushing stress attained at the end of the compressive test, the densification of the residual material increasing by grinding to smaller PyC fragments.
The energy dissipated (W in MJm-3) was also evaluated by integrating the crushing curves for the PyC foams of different densities (Fig. 14). W rises linearly with */s, while the mean plateau
strength fmean also increases (Fig. 15) and even though the plateau length d decreases, the
product fmeand being a rough estimate of W. This result shows that the densification rate affects
f
mean much more significantly than d. Indeed, when */s increases to 0.15, fmean is improved
by a factor 10, while d is reduced by only 30%. In the case of a brittle material, the energy
dissipated by crushing is related to the creation of new surfaces resulting from the fracture of the struts. A fracture surface energy of the struts (s) can be calculated based the G&A’s brittle foam
model [59]:
s = 0.5fmeanl(*/s)-1 (5)
The linear dependence observed between fmean and */s, for a given cell size (see Fig. 15 for the
60 ppi foam), leads to a nearly constant value of s whatever the density. This result suggests that
the damage process assumed in the model remains valid for the whole density range. The number of struts broken for a given crushed volume stays constant, since both l and nppi are constant,
while the cross-section area of the fractured struts increases with the thickness of the PyC coating, which has a value close to t/2.
The mechanical behaviour of the 60 and 100 ppi foams of a given PyC type is similar, in particular in terms of fmean (Fig. 16), d and E* values (not shown). Only the stress fluctuations
along the plateau are slightly lesser for the 100 ppi than for the 60 ppi foams. At lower cell size but constant relative density, i.e. when t and l both decrease at constant t/l ratio, the mean number of contacts for a given surface area A increases, smoothing the stress oscillations (equation 3), while the Young’s modulus and the mean strength (equation 2) are not significantly affected.
Figure 16: Mean strength fmean of the 60 and 100 ppi foams infiltrated with HAL and WAL-PyC,
as a function of relative density.
The influence of the microtexture of PyC was also examined. Surprisingly, the HAL and WAL-PyC foams have relatively similar mechanical properties. Yet, looking in details, E* becomes slightly higher for the HAL-PyC than for the WAL-PyC foams, when the relative density increases (not shown), while on the other hand fmean and W are slightly higher for WAL-PyC
than for HAL-PyC (Fig. 16). Only a few studies have reported on the properties of pyrocarbons of different microtextures. Furthermore, these studies are usually incomplete due to the high anisotropy of the material. Nanoindentation tests can easily be performed along the two main orientations of the PyC specimen but the complexity of the stress field under the indenter and the poor transverse properties of PyC (ET<<EL) lead to underestimated values of EL [62]. By tensile
testing model 1D composites, Sauder et al. found longitudinal E values of 54 and 205 GPa for two pyrocarbons having microtextures similar as the WAL and HAL-PyCs. These pyrocarbons were respectively referred to as SL and “RL-PCVD” by these authors, the later being later on categorized as ReL by Vallerot et al. [10, 20]. These two very different values reveal the better
0 0.5 1 1.5 2 2.5 3 3.5 4 0 0.05 0.1 0.15 0.2 60ppi HAL 100ppi HAL 60ppi WAL 100ppi WAL f mean ( M P a) */ s
preferential orientation of the carbon layers along the longitudinal axis in the HAL-PyC. They explain the higher E* value measured for the HAL-PyC foam, the macroscopic strain being essentially due to strut bending, according to the G&A’s model, since the contribution of ET to
the stiffness of the strut in bending prevails over that of EL. The mean stress plateau and the
energy dissipated are both expected to be proportional to fs2/Es, according to the “indentation
approach” (see above and equation 2). If f
mean naturally increases with fs, it rises also when Es
decreases, due to the larger number of contacts with the loading platen and the better uniformity of the load through the end section. Even though failure strength data are not available for the two types pyrocarbon, the slightly higher fmean value of the WAL-PyC suggests that the
difference in two elastic moduli (Es) prevails over the fs mismatch. As mentioned above, the
EWAL value is indeed expected to be much lower than that of EHAL.
This study has shown that one can easily control the crushing strength fmean, in a wide range, by
simply monitoring the pyrocarbon infiltration time, i.e. the apparent density. fmean increases with
*
/s to the detriment of the total crushing strain d. However, since W ≈ fmeand, the benefit due
to the rise of fmean still predominates over the d reduction, in terms of dissipated energy. fmean
and d are two essential features to evaluate the shock absorption capability of a material. Indeed,
if one considers for instance an object having a mass m, a velocity of impact vi, a crush working
surface S, and a g-tolerance to deceleration gt, colliding a shock absorbing material, the
acceptable crushing strength fmean (assuming a negligible strain-rate sensitivity: see beginning of
section 4.2) and wall thickness T0 are then respectively:
f
mean ≤ mgt/S (6)
T0 ≥ mvi2/2SW or T0 ≥ vi2/2gtd (7)
The control of the PyC foam crushing properties fmean, d and W, allows an accurate adjustment
of their shock absorption properties with a view to a variety of applications.
Starting from very porous vitreous carbon foams, the CVD from propane has allowed preparing pyrocarbon foams of two distinct microtextures and well-adjusted relative densities, ranging from 0.03 to 0.15. The infiltration process was optimized in terms of deposition temperature, pressure and residence time, in order to obtain a high deposition rate, typically between 1 and 4 μmh-1, and appropriate thickness uniformity.
The influence of the pyrocarbon infiltration on the mechanical properties, have been studied by crushing tests at room temperature. In particular view of a shock absorption application, the whole crushing behaviour, i.e. the mean plateau strength fmean, the stress oscillations on the
plateau f, the maximal strain at “densification” d and the dissipated energy W, was given more
importance than the elastic properties E* or the nominal failure strength *cr, as defined by G&A.
Together with a gradual increase of relative density */s, the pyrocarbon deposition leads to a
significant increase of fmean and W, both by a factor of ten. The variation of the different
properties with the density can be explained on the basis of relatively simple models based on regular structure and damage process, according to the Gibson & Ashby’s approach. At given relative density, the mean strength fmean and the fluctuations f along the plateau are not only
influenced by the failure strength of the pyrocarbon constituent, but also by its stiffness and the cell scale, i.e. the strut length/thickness ratio. Ideally, the cell size of the foam should be small and the constituent of the foam combine a high strength fs with a low stiffness, in order to
maximize fmean and minimize f. In the present conditions, the cell size of the substrates, of 60
or 100 ppi, and the nature of the pyrocabon, were both found to have a limited influence. The slightly higher value of fmean obtained for the weakly anisotropic pyrocarbon is attributed to its
low longitudinal Young’s modulus.
The CVD process allows an easy and accurate control of fmean and d, two key features for a
shock absorption application, simply through the infiltration conditions and time. A better properties prediction might be achieved by a more complete characterization of the pyrocarbon coating itself, in both longitudinal and transverse axes, and by the use of more reliable models. Simple approaches, either fully predictive or partially statistical, are helpful but should be regarded with precautions. A more satisfactory approach should combine an accurate description of the local damage and the stress redistribution induced near the contact, e.g. by in situ microscopic observations during indentation and 3D tomography imaging couple with finite
element analysis, as well as a failure strength distribution through the foam, e.g. using a Weibull analysis.
Acknowledgements
This work was financially supported by “Commisariat d’Energie Atomique (CEA)”. The authors are grateful to Thierry Piquero and Patrick David from CEA for providing the foams and for fruitful discussions. They greatly acknowledge G. Vignoles and G. Couegnat for the microtomography analyses, the 3D image computations, as well as for numerous and fruitful discussions.
References
[1] Scheffler M, Colombo P (eds.). Cellular Ceramics, Structure, Manufacturing, Properties and Applications. Weinheim: Wiley-VCH;2005.
[2] Kim J, Cunningham N. Development of porous carbon foam polymer electrolyte membrane fuel cell. J Power Sources 2010;195(8):2291-300.
[3] Aoki Y, McEnaney B. SiC foams produced by siliciding carbon foams. Br Ceram Trans 1995;94(4):133–7.
[4] Celzard A, Zhao W, Pizzi A, Fierro V. Mechanical properties of tannin-based rigid foams undergoing compression. Mater Sci Eng A 2010;527(16-17):4438-46.
[5] Li X, Basso MC, Braghiroli FL, Fierro V, Pizzi A, Celzard A. Tailoring the structure of cellular vitreous carbon foams. Carbon 2012;50(5):2026-36.
[6] Amaral-Labat G, Sahimi M, Pizzi A, Fierro V, Celzard A. Mechanical properties of heat-treated organic foams. Phys Rev E 2013;87:032156-1-7.
[7] Buck ME. High strength and modulus filaments of boron and silicon carbide. Mater Des 1987;8(5):272–7.
[8] Ritter AM, Dupree PL. Effect of coating thickness on the strength of SCS-6 SiC fibers. Scr Metall Mater 1992;27(7):827-831.
[9] Liu C, Yang Y, Xian L. Effect of Carbon Coating on Tensile Strength of SiC Filament by Chemical Vapor Deposition. Mater Proc Technol P 1-4 2011 ;291-294 :57-60.
[10] Sauder C, Lamon J, Pailler R. The tensile properties of carbon matrices at temperatures up to 2200°C. Carbon 2005;43:2044-2053.
[11] Cavalier JC, Berdoyes I, Bouillon, E. Composites in aerospace industry. Ind Ceram 2009;29(2):119–26.
[12] Sherman AJ, Tufias RH, Kaplan RB, Refractory ceramic foams: a novel, new high-temperature structure, Ceram Bull 1991;70(6):1205-9.
[13] Sourdiaucourt P, Derré A, Delahes P, David P. Mechanical reinforcement of carbon foam by hafnium carbide deposit. J Phys IV 1999;9(8): 1187-94.
[14] Verdugo RA, Ochoa OO, Lara-Curzio E. Tensile evaluation of ceramic foam ligaments. Ceram Eng Sci Proc 2003;24(3);153-8.
[15] Lin QY, Zhihai Feng Z, Li TQ, Hu ZJ, He LL, Ye HQ. The effect of pyrocarbon deposition on the microstructure of graphitic foam. Carbon 2013;56:18-26.
[16] Klein CA. Electrical Properties of Pyrolytic Graphites. Rev Mod Phys 1962;34(1):56–79. [17] Pappis J, Blum SL, Properties of pyrolytic graphite. J Am Ceram Soc 1961;44(12):592-7. [18] Jumel J, Lepoutre F, Roger J-P, Neuer G, Cataldi M, Enguehart F. Microscopic thermal characterization of composites. Rev Sci Instrum 2003;74(1):537-9.
[19] Bertrand P, Vidalsetif M, Mevrel R. LPCVD Pyrocarbon Coating on unidirectional Carbon-Fiber Yarns – An Efficient Interphase For Aluminum-Matrix Composites. J Phys IV 1995;5(C5):769–776.
[20] Vallerot J-M, Bourrat X, Mouchon A, Chollon G. Quantitative structural and textural assessment of laminar pyrocarbons through Raman spectroscopy, electron diffraction and few other techniques. Carbon 2006;44:1833-44.
[21] Leyssale J-M, Da Costa J-P, Germain C, Weisbecker P, Vignoles GL. Structural features of pyrocarbon atomistic models constructed from transmission electron microscopy images. Carbon, 2012;50(12):4388-400.
[22] Dong GL, Huttinger KJ, Consideration of reaction mechanisms leading to pyrolytic carbon of different textures. Carbon 2002;40(14):2515-28.
[23] De Pauw V, Reznik B, Kalhöfer S, Gerthsen D, Hu ZJ, Hüttinger KJ. Texture and nanostructure of pyrocarbon layers deposited on planar substrates in a hot-wall reactor. Carbon 2003;41(1):71-7.
[24] De Pauw V, Kalhöfer S, Gerthsen D. Influence of the deposition parameters on the texture of pyrolytic carbon layers deposited on planar substrates. Carbon 2004;42(2):279-86.
[25] Feron O, Langlais F, Naslain R, Thebault J. On kinetic and microstructural transitions in the CVD of pyrocarbon from propane. Carbon 1999, 37(9):1343-1353.
[26] Lavenac J, Langlais F, Bourrat X, Naslain R. Deposition process of laminar pyrocarbon from propane. J Phys IV 2001;1(3):1013-21.
[27] Le Poche H, Bourrat X, Dourges M-A, Vignoles GL, Langlais F. Influence of the gas-phase maturation on the CVD/CVI process and the micro-texture of laminar pyrocarbon from propane. In: Singh M, Kerans RJ, Lara-Cursio E, Naslain R, eds. Proceedings of high-temperature ceramic matrix composites, vol. 5, Westerville OH: the American Ceramic Society;2005 p. 81–6.
[28] Hüttinger KJ. CVD in Hot Wall Reactors - The Interaction between Homogeneous Gas-Phase and Heterogeneous Surface Reactions. Chemical Vapor Deposition1998;4(4):151-8.
[29] Hüttinger KJ, Fundamentals of chemical vapor deposition in hot wall reactors, in: P. Delhaes, editor. Fibers and composites, World of carbon, vol. 2, London;Taylor & Francis;2003, p. 75–86.
[30] Feron O, Langlais F, Naslain R. In-situ analysis of gas phase decomposition and kinetic study during carbon deposition from mixtures of carbon tetrachloride and methane. Carbon 1999;37(9):1355-61.
[31] Descamps C, Vignoles GL, Féron O, Langlais F, Lavenac J. Correlation between Homogeneous Propane Pyrolysis and Pyrocarbon Deposition. J Electrochem Soc 2001;148(10) C695-708.
[32] Vignoles GL, Langlais F, Descamps C, Mouchon A, Le Poche H, Reuge N, Bertrand N. CVD and CVI of pyrocarbon from various precursors. Surf Coat Technol 2004;188-189 (1-3):241-9.
[33] Langlais F, Le Poche H, Lavenac J, Feron, O. Multiple Experimental Investigation for Understanding CVD Mechanism. Exemple of Laminar Pyrocarbon Deposition. Electrochem Soc Proc 2005;9:73–86.
[34] Diefendorf RJ. Carbon/carbon composites produced by chemical vapor deposition. Ceram Eng Sci Proc 2006;27(2):399-414.
[35] Benzinger W, Hüttinger KJ. Chemistry and kinetics of chemical vapor infiltration of pyrocarbon - VI. Mechanical and structural properties of infiltrated carbon fiber felt. Carbon 1999;37(8):1311-22.
[36] Lavenac J, Langlais F, Féron O, Naslain R. Microstructure of the pyrocarbon matrix in carbon/carbon composites. Comp Sci Technol 2001;61(3):339-45.
[37] Zhang WG, Hüttinger KJ. Formation of carbon textures in chemical vapor infiltration and deposition. Electrochem Soc Proc 2005;9:388-95.
[38] Kocon L, Piquero T. Aerogels and opened-cell structures: Two examples of carbon foams. Actualite Chimique 2006;(295-296):119-123.
[39] Bourrat X, Langlais F, Chollon G, Vignoles GL, Low temperature pyrocarbons : a review. J Braz Chem Soc 2006;17(6):1090-5.
[40] Gong L, Kyriakides S, Jang W-Y. Compressive response of open-cell foams. Part I: Morphology and elastic properties. Int J Solids Struct 2005;42(5-6):1355-79.
[41] Jang WY, Kraynik AM, Kyriakides S. On the microstructure of open-cell foams and its effect on elastic properties. Int J Solids Struct 2008;45(7-8):1845-75.
[42] Zhu HX, Knott JF, Mills NJ. Analysis of the elastic properties of open-cell foams with tetrakaidecahedral cells. J Mech Phys Solids 1997;45 (3):319-43.
[43] Mills NJ. The wet Kelvin model for air flow through open-cell polyurethane foams. J Mater Sci 2005;40(22):5845-51.
[44] Mills NJ. The high strain mechanical response of the wet Kelvin model for open-cell foams. Int J Solids Struct 2007;44(1):51-65.
[45] Sullivan RM, Ghosn LJ, Lerch BA. A general tetrakaidecahedron model for open-celled foams. Int J Solids Struct 2008;45(6):1754-65.
[46] Thiyagasundaram P, Sankar BV, Arakere NK. Elastic properties of open-cell foams with tetrakaidecahedral cells using finite element analysis. AIAA Journal 2010;48(4):818-28.
[47] Fitzer E, Schaefer W, Yamada, S. The formation of glasslike carbon by pyrolysis of polyfurfuryl alcohol and phenolic resin. Carbon 1969;7(6):643-648.
[48] Reznik B, Gerthsen D, Hüttinger KJ. Micro- and nanostructure of the carbon matrix of infiltrated carbon fiber felts. Carbon 2001;39(2):215-229.
[49] Bourrat X, Fillion A, Naslain R, Chollon G, Brendlé M. Regenerative laminar pyrocarbon. Carbon 2002;40(15):2931-2945.
[50] Chollon G, Structural and textural analyses of SiC-based and carbon CVD coatings by Raman Microspectroscopy. Thin Solid Films 2007;516(2-4):388-96.
[51] Vignoles GL, Gaborieau C, Delettrez S, Chollon G, Langlais F. Reinforced carbon foams prepared by chemical vapor infiltration: A process modeling approach. Surf Coat Technol 2008;203(5–7): 510–515.
[52] Walley SM, Historical review of high strain rate and shock properties of ceramics relevant to their application in armour. Adv Appl Ceram 2009;109(8):446-66.
[53] Yu SS, Lu YB, Cai Y, The strain-rate effect of engineering materials and its unified model. Lat Al J Solids Struct 2013;10(4):833-44.
[54] Zhao H, Elnasri I, Abdennadher S, An experimental study on the behaviour under impact loading of metallic cellular materials. Int J Mech Sci 2005;47(4-5):757-74.
[55] Maiti SK, Gibson LJ, Ashby MF. Deformation and energy absorption diagrams for cellular solids. Acta Metall 1984;32(11):1963-75.
[56] Gibson L, Ashby M. Cellular Solids, Structure and Properties, 2nd edition. Cambridge UK: Cambridge University Press;2001.
[57] Dam CQ, Brezny R, Green DJ. Compressive behavior and deformation-mode map of an open-cell alumina. J Mater Res 1990;5(1):163-71.
[58] Brezny R, Green DJ. Uniaxial strength behavior of brittle cellular materials. J Am Ceram Soc 1993;76(9):2183-90.
[59] Mora RJ, Waas AM. Strength scaling of brittle graphitic foam. Proc. R. Soc. London, Ser. A 2002;458(2023):1695-718.
[60] Brezny R, Green DJ. Characterization of edge effects in cellular materials. J Mater Sci 1990;25(11):4571-8.
[61] Brezny R, Green DJ. The effect of cell size on the mechanical behavior of cellular materials. Acta Metall Mater 1990;38(12):2517-26.
[62] Gross TS, Timoshchuk N, Tsukrov II, Piat R, Reznik B. On the ability of nanoindentation to measure anisotropic elastic constants of pyrolytic carbon. Z Angew Math Mech 2012;1-12 (in press: DOI 10.1002/zamm.201100128).
Table captions
Table 1: Geometrical properties of the non-infiltrated vitreous carbon foams (standard deviation in bracket)
60 ppi 100 ppi s0(gcm -3 ) 1.60 (0.01) 0 * (gcm-3) 0.053 (0.002) 0.062 (0.004) 0 * /s0 0.033 (0.002) 0.039 (0.003) Open porosity (%) 96.7 (0.2) 96.1 (0.2) Sv0 (cm -1 ) 32 (5) 54 (8)
Table 1: Geometrical properties of the non-infiltrated vitreous carbon foams (standard deviation in bracket)