HAL Id: hal-02757762
https://hal.inrae.fr/hal-02757762
Submitted on 4 Jun 2020HAL is a multi-disciplinary open access
archive for the deposit and dissemination of sci-entific research documents, whether they are pub-lished or not. The documents may come from teaching and research institutions in France or abroad, or from public or private research centers.
L’archive ouverte pluridisciplinaire HAL, est destinée au dépôt et à la diffusion de documents scientifiques de niveau recherche, publiés ou non, émanant des établissements d’enseignement et de recherche français ou étrangers, des laboratoires publics ou privés.
Visualising changes in agricultural landscapes
Sébastien Griffon, Daniel Auclair
To cite this version:
Sébastien Griffon, Daniel Auclair. Visualising changes in agricultural landscapes. Integrated Assess-ment of Agriculture and Sustainable DevelopAssess-ment (AgSAP), Mar 2009, Egmond aan Zee, Netherlands. �hal-02757762�
AgSAP Conference 2009, Egmond aan Zee, The Netherlands
296
Visualizing changes in agricultural landscapes
S. Griffon, D. Auclair
CIRAD, UMR AMAP, TA A-51/PS2, 34398 Montpellier Cedex 5, France
Contact: [email protected]
Introduction
Rural land managers, foresters and farmers, but also local decision makers, local authorities and members of local governments, are increasingly aware of the necessity to take into account the perception of the landscape by the general public, and to predict the evolution of landscapes according to management decisions (Bergen et al., 1995). Different management choices can lead to similar, or to very different landscapes. The positioning of woodlots, of fields, and of agro-forestry areas, the type of silvi-cultural management (selective or systematic thinning, artificial pruning, clear-cut or shelterwood systems, reforestation, choice of species, etc…) or agricultural system (rotation, land attribution, crop allocation, etc…) and the balance between forest and agriculture, are susceptible of drastically modifying the visual aspect of the landscape. Although land managers generally have a good experience of what result can be expected from their decisions, they are often faced with difficulty when trying to communicate the visual impact of a future management option to all the stakeholders (local and regional decision makers, land managers, landscape planners, and various communities involved in outdoor activities). Three-dimensional visualization of the landscape provides means that are better understood than maps, especially for the general public. With such methods, visual changes of the landscape can be shown very impressively, which can allow for an intuitive assessment of the visual landscape quality.
The present work describes a landscape visualization tool which has been developed within the SEAMLESS project (Van Ittersum et al., 2008). This landscape visualization component should be launched at the end of a policy simulation to allow for exploration of landscape changes, as a post-model analysis, to be used as a basis for discussion and negotiation within the community.
Methods
The users (modeller or policy-maker, or any other stakeholder) who are interested in a specific landscape should initially start with a description of the area they wish to visualize. This requires a description, preferably mapped in GIS format, of environmental data such as land cover and land use. Pressures causing changes in landscape can be simulated by a bio-economic farm model (such as the FSSIM module of the SEAMLESS project). This is then translated into changes in the spatial configuration of the landscape. A 3D data conversion plug-in has been developed and integrated into the open-source GIS software QGIS (http://www.qgis.org/). It works as an external module that allocates each agricultural parcel to a specific land-use by importing the proportion of each land-use class computed by the bio-economical farm model and distributing it on the field pattern according to specific rules (in the present version, randomly). Then the plug-in can export the extent selected by users (most reasonably around 10 km by 10 km). Data are cropped, fused and formatted to be visualized. The generation of the 3D model and its rendering is done by a specific software component, that we have called here ‘Seamless Landscape Explorer’ (SLE).
SLE is then launched and the user can edit the geo-typical configuration (land-use textures and vegetation) for each land-use class. A dynamically optimized elevation mesh from the digital terrain elevation raster is first computed using the Geographic MipMaps technique (De Boer, 2000). Then the mesh is textured with Texture Splatting technique and with satellite imageries or thematic maps and vegetation can be spatialized according to user parameters.
Session B5: Integrated assessment methods for regional and landscape levels
297
The different layers of vegetation consist in trees, shrubs, small plants, and other objects, such as rocks, are added to complete the impression of natural complexity. The rendering is done in real time.
The example of application presented here concerns the Mediterranean territory of Pic Saint Loup (near Montpellier, Hérault, France), where four scenarios were studied, as part of a participatory process for planning the regional peri-urban and agri-environmental policy (Nespoulous, 2004). The scenarios concern high or low biodiversity and high or low urban pressure. Land-use maps were produced for each scenario and the resulting scenes were processed with SLE.
Results and discussion
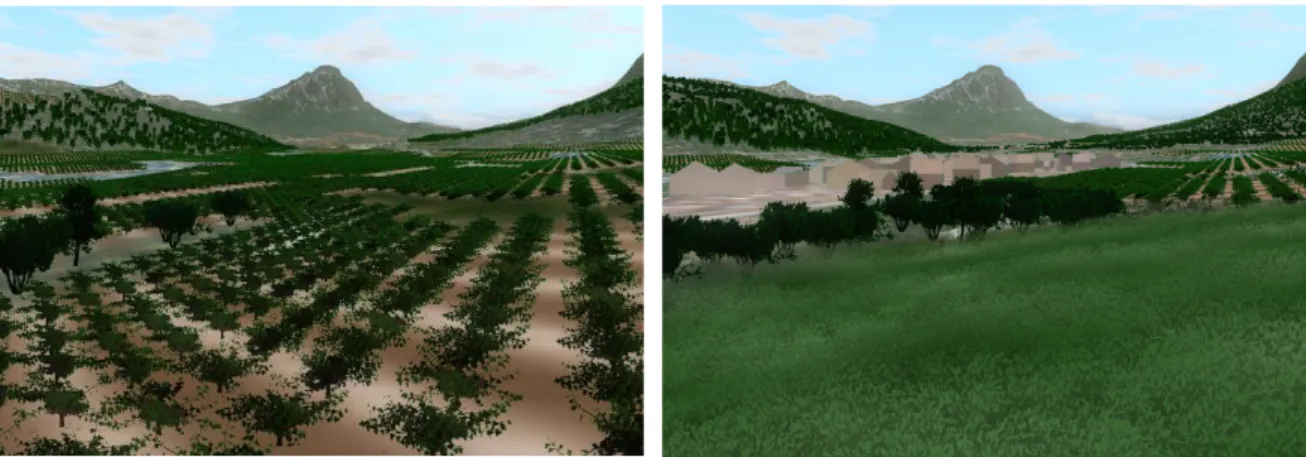
Figure 1 shows an example of land-use change according to two scenarios: biodiversity with agriculture (left) and peri-urban pressure with environmental concern (right).
Figure 1. Example of Pic Saint Loup landscape change.
These images, as well as fly-over videos, were discussed with stakeholders (both professional and general public). These computer simulations were used as a support for understanding and characterizing the landscape.
Decisions support systems are increasingly being applied in spatial planning, and virtual landscapes become an important part of decision making. Planners recognize realism as an important factor in this type of visualization (Appleton & Lovett, 2005). It is important to define an appropriate level of realism, because the ‘photorealism’ can have potential negative effects if it is not linked to real-world data. The tool presented here provides the opportunity to control several aspects, in particular the viewpoint. In the example shown here, the Pic Saint Loup mountain in the distance is important for local stakeholders to recognize clearly their familiar landscape.
References
Appleton, K. & A. Lovett, 2005. Computers, Environment and Urban Systems 29: 321-339. Bergen, S.D., et al., 1995. Journal of Forestry 93: 33-37.
De Boer, W.H., 2000. http://www.flipcode.com/articles/article_geomipmaps.shtml Nespoulous, A., 2004. MA Thesis, Univ. Montpellier, 89 pp.