HAL Id: cea-01559047
https://hal-cea.archives-ouvertes.fr/cea-01559047
Submitted on 10 Jul 2017
HAL is a multi-disciplinary open access
archive for the deposit and dissemination of
sci-entific research documents, whether they are
pub-lished or not. The documents may come from
teaching and research institutions in France or
abroad, or from public or private research centers.
L’archive ouverte pluridisciplinaire HAL, est
destinée au dépôt et à la diffusion de documents
scientifiques de niveau recherche, publiés ou non,
émanant des établissements d’enseignement et de
recherche français ou étrangers, des laboratoires
publics ou privés.
Multipath estimation technique for wideband mm-wave
backscattering channels
Francesco Guidi, Antonio Clemente, Raffaele d’Errico
To cite this version:
Francesco Guidi, Antonio Clemente, Raffaele d’Errico. Multipath estimation technique for wideband
mm-wave backscattering channels. EUCAP, 2017 11th European Conference on Antennas and
Prop-agation, Mar 2017, Paris, France. pp.2540 - 2544, �10.23919/EuCAP.2017.7928245�. �cea-01559047�
Multipath Estimation Technique
for Wideband mm-Wave Backscattering Channels
Francesco Guidi, Antonio Clemente, Raffaele D’Errico
CEA, LETI, MINATEC Campus, 38054 Grenoble, France. Univ. Grenoble-Alpes, 38000 Grenoble, France
e-mail: {francesco.guidi, antonio.clemente, raffaele.derrico}@cea.fr
Abstract—In this paper we describe a method to discriminate multipath components in joint angular and temporal domain by exploiting the a-priori knowledge of the antennas characteristics into an ad-hoc algorithm for wideband backscattering channels. By means of two indoor measurement campaigns performed using millimeter-waves massive arrays in a corridor and in an office room, we show the feasibility of the proposed approach and we compared its performance to those of methods already available in the state of the art.
Index Terms—Multipath Detection, Massive antenna array, personal radar.
I. INTRODUCTION
Next fifth generation (5G) wireless mobile networks is still at its infancy, as its explosion and practical adoption are expected in the next decade [1]. Among the new disrup-tive players for 5G wireless mobile networks, it is foreseen to have a wide-spread adoption of millimeter-wave (mmW) and massive arrays technologies. Consequently, by taking advantage of mmW which gives the possibility to pack a huge number of antennas into a small area, next generation of mobile devices could be able to scan the surrounding environment thanks to the beamsteering capabilities enabled by the integrated massive arrays [2], [3]. From this perspective, personal radars exploiting the joint use of these technologies represent an interesting solution for environment mapping [4], [5]. Notably, the performance of such system depends on: (i) the ability of collecting the backscattered responses from different steering directions; (ii) the exploitation of such measurements as an input for the mapping algorithm. As a consequence, it becomes important to properly characterize the indoor backscattering mmW channel. To this purpose, the first step is to properly detect the multipath components (MPCs) in a 2D scenario, where joint angular and temporal information should be accounted for. At the best of authors’ knowledge, an extensive literature is available on CLEAN-like approaches, their extensions, or on different techniques [6]–[12], but all these methods to retrieve the MPCs, related to the one-way channel, do not usually account for the need to reconstruct the environment. In [11] and [12], extended versions of the CLEAN algorithm accounting for both space and time dimension are described. More specifically, in [11] a Sensor-CLEAN algorithm is proposed, which exploits arrays of measurements to reconstruct the beam direction and time
response by means of delay-and-sum beamforming. In such approach, requiring the construction of the beamforming ma-trix, data from different sensors (antennas) is gathered, and the output of the CLEAN provides an estimate of the time-of-arrival (TOA), angle-time-of-arrival (AOA) and pulse shape. In [12] instead, authors reasonably assume to have point sources blurred due to noise and point-spread-functions (i.e. impulse responses). Thus, once a point-spread-function is estimated, it is exploited to iteratively clean the measured data along the angular and time dimension. A misalignment in the use of this function can cause further artifacts, thus requiring detection schemes with constant false alarm rates, or visual inspection to correct the unwanted gathered components. In [13], an approach accounting for joint temporal and angular information of the collected MPCs in a different manner is proposed.
In this paper, inspired by these methods, we propose an extended version of the CLEAN algorithm to detect MPCs by exploiting the joint delay and angular information in wideband backscattering channels with antenna pattern embedded. More specifically, the a-priori information of the high-directive an-tenna patterns used for measurements is exploited to reduce as much as possible the effect of arrays side-lobes. The output of the proposed algorithm is compared to that of a more tradi-tional CLEAN-like approach, and of the algorithm described in [13], with the aim to put in evidence the benefits carried out by the new approach. Performance is shown by exploiting measurements collected in the V-band adopting transmitarrays (TAs) in two typical office environments at CEA-Grenoble premises, that is an office room and a corridor. In particular, since the exploited measurements are for applications which aim to reconstruct the environment (i.e. for personal radars), through the proposed approach we enable the possibility to reproduce the environment contour.
The rest of the paper is organized as follows. Sec. II reports the description of the proposed method, as well as of the two considered approaches in the state of the art for the comparison. In Sec. III we briefly describe the performed measurement campaign, while in Sec. IV results are reported. Finally, Sec. V draws the conclusions.
II. MULTIPATHCOMPONENTSDETECTION
In our scenario, we assume to have a user equipped with a high directional mmW antenna which moves in an unknwon
environment. For each position, thanks to the beamsteering capabilities of its device, the user is able to steer the an-tenna beam towards different directions, and to collect the backscatter response and thus to reconstruct the surrounding environment. To this purpose, it is important to correctly discriminate the MPCs of such a backscattering channel. Thus, we now first describe two possible approaches reported in the state of the art, as well as the proposed method based on the a-priori knowledge of the antenna pattern.
A. Algorithm 1: CLEAN-like Approach
We now consider a CLEAN-like approach which follows the following steps.
1) For each radar position, generate a temporal-angular map containing the power delay profiles (PDPs) asso-ciated to each steering direction for the different delays; 2) Find the maximum valuePmaxin the PDPs matrix, and
store the corresponding delay, angle and amplitude. 3) ConsideringPmax as a center point along the delay-axis,
set to zero the samples along∆τ . A new cleaned version of the map is obtained, where the local maximum is no more present.
4) If at least a value of the new version of the map is above a pre-defined threshold (e.g. a noise-based one), go to step 2. Otherwise continue to step 5;
5) The recorded elements with a total power above a threshold to be set, give the multipath components with their relative angles and delays.
As it is possible to observe, this simple approach does not account for any angular information of the pattern. Thus, it is quite immediate to conclude that such a method is extremely sensitive to the presence of artifacts due to side-lobes as will be also shown in the results section.
B. Algorithm 2: 2D Approach
We now consider an approach which can be easily adapted to our scenario and that exploits both the angular and temporal information [13]. In particular, from the knowledge of all the measured angular channel responses and their respective PDPs, a marginal PDP is derived by averaging the PDP for all the steering directions. Successively the obtained marginal PDP, which only depends on the delay, is divided into time bins. For each bin, the local maximum is first collected and then compared with a time-dependent threshold, as defined in [13], which is related to the average power level in the bin. If a value overcomes the threshold, such power value and time instant are gathered, as well as the azimuth angle (i.e. steering direction) for which the maximum is achieved at that given time instant by considering all the angular PDPs. In such a manner, for each MPC three parameters are stored.
One could note that for each value crossing the threshold, only one azimuth angle is accounted for. This means that in symmetric environments, where two strong components are collected from opposite steering directions and arrive at about the same time, there is the risk that a useful MPC is discarded.
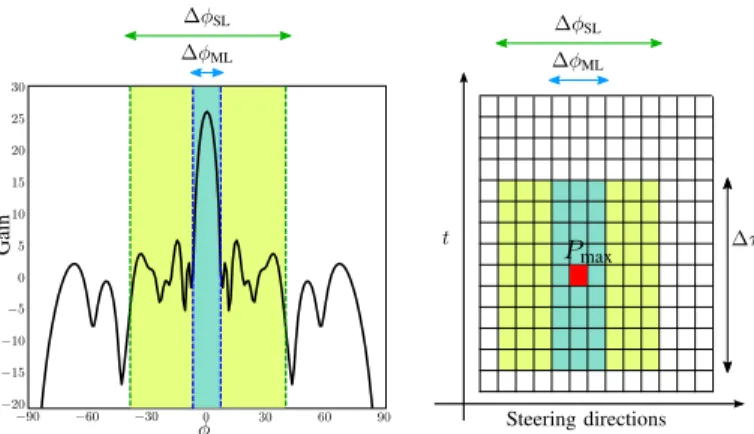
∆φML ∆φML ∆φSL ∆φSL Steering directions Pmax t ∆τ −20 −15 −10 −5 −90 −60 −30 30 60 90 30 25 20 15 10 5 0 0 G ai n φ
Fig. 1. Array pattern (left) and PDP matrix (right) for multipath components identification in the proposed algorithm 3.
C. Algorithm 3: Proposed Approach
In order to overcome part of the aforementioned limitations, and inspired by the necessity to account for the antenna characteristics in the MPCs search, we describe here a variant of the CLEAN approach, which lets to discriminate angular and time components from the knowledge of the antenna pattern (we suppose here high directive antennas). This algo-rithm starts from the definition of the PDP matrix for all the steering directions, and of a delay and two spatial windows. In particular, let ∆φML and∆φSL to be set in accordance to the
array pattern, as reported in the example of Fig. 1-left.∆φML
accounts for the main lobe, whereas∆φSLconsiders the angles
where the side lobe level (SLL), defined as SLL= Gsl/Gmax,
is higher than a pre-determined value. Then, we indicate with ∆τ the temporal window representing the estimated multipath component duration. Once the space and time windows are defined, the two-dimensional version of the CLEAN algorithm follows the hereafter enumerated steps.
1) For each radar position, generate a temporal-angular matrix containing the PDPs associated to all the steering directions;
2) Find the local maximum value Pmax in the PDPs map,
and store its delay, angle and value. In Fig. 1-right this value is represented as a red-colored entry of the space-time matrix;
3) Considering Pmax as a center point, set to zero the
samples in the area between ∆φML and∆τ according
to Fig. 1-right. A new cleaned version of the map is obtained, where the local maximum is no more present. 4) Find if in ∆φSL, there is any component with power
PSL> ξ = Pmax/ζ, with ζ = k ·(Gmax/Gsl) 2
accounting twice the side-lobes effects as the antenna gain enters in the transmitting and receiving mode due to the backscattering nature of the communication, and with Gsl and Gmax being the side-lobe and maximum gain,
respectively.k is a constant which lets to better balance the threshold. If there is no component overcoming the threshold, set to zero the samples in the area comprised by ∆φSL and ∆τ by taking the maximum peak as a
0 0 1 1 2 2 3 3 4 4 5 6 7 0.5 1.5 2.5 3.5 4.5 p1p2p3p4 p5 p6p7p8p9p10 0 0 1 1 2 2 3 3 4 4 5 p1 p2 p3 p4 p5p6 p7 p8 p9 p10 p11 p12
Fig. 2. Plan of the indoor office environment.
center. This operation permits to check if the samples around the considered local maximum are artifacts due to side-lobes and hence they should be discarded or not. In fact, components whose correspondent power is above the threshold could arrive from other steering directions and they should be collected;
5) If at least a value of the new version of the map is above a pre-defined threshold (e.g. a noise-based one), go to step 2. Otherwise continue to step 6;
6) The recorded elements with a total power above a threshold to be set give the multipath components with their relative angles and delays.
In the following, after reporting the measurement campaign, the algorithms performance is shown.
III. CHANNELMEASUREMENT CAMPAIGNS
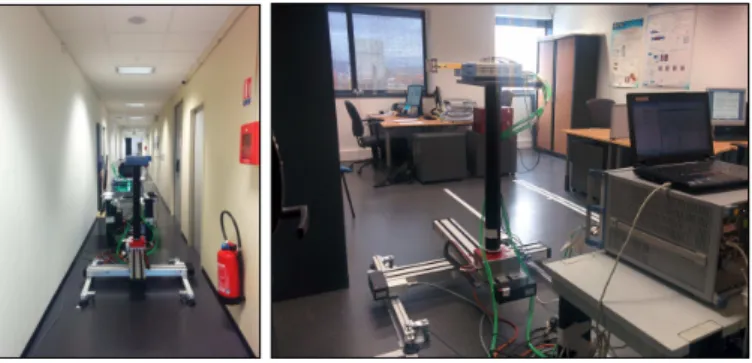
We now describe two measurement campaigns performed in order to assess a characterization of the backscattering channel model, which will be here exploited to assess the performance of the proposed method. Measurements were performed in an office room and a corridor, as shown in Fig. 2. To this purpose, 2 mmW converters in 50 GHz-75 GHz were connected from one side to a vector network analyzer and, from the other side, to 2 linearly polarized TAs with20 × 20 elements each, 1 bit of phase quantization, and a focal distance F/D = 0.5 [14]. The entire set-up was positioned over a X-Y-Azimuth positioner to let possible the mechanical rotation of the structure and thus emulating a steering procedure. In particular, the 2 TAs were placed in a quasi monostatic configuration and spaced apart of 0.16 m [5], [15]. As reported in Fig. 2, in order to emulate the personal radar scenario of [4], measurements were collected in10 and 12 different positions spaced apart of 0.405 m. For each point, steering operations were performed by mechanically rotating the X-Y-Azimuth positioner from −90◦to90◦with a step of5◦(in accordance to the half power
beamwidth (HPBW) of the TA used), in the57.5 − 63.5 GHz bandwidth with a step of5 MHz. Successively, we reported the measured S21(f ) in time-domain through the inverse Fourier
transform, and we performed time gating to eliminate the coupling contribution due to the two arrays proximity. A. Massive Array Characteristics
We now give some insights concerning the TA charac-teristics used for measurements. The aim is then to exploit
Fig. 3. Photos of measurement campaigns in corridor.
such information into the algorithm described in Sec. II-C. The considered multi-antenna systems are composed of a focal source illuminating a planar array constituted of blocks called unit-cells. To achieve high directivity for personal radar applications, it has been shown that TAs with 400 elements are a good choice [5], [14], [16]. Consequently, we considered 20 × 20 unit-cells each with size of 2.5 × 2.5 mm2
(i.e. the spacing between antennas is set to λ0/2 = 5 mm where λ0 is
the wavelength at f0= 60 GHz). The considered TA presents
1-bit of phase compensation corresponding to two possible phase values (0◦ and180◦).
Finally, the focal source is a linearly-polarized pyramidal horn antenna with a gain equal to 10.2 dBi at 60 GHz and a full HPBW of 72◦× 57◦. Results report a maximum gain
of23.3 dBi, a directivity, spill-over loss and power efficiency equal to 26 dBi, 2.24 dB, and 53.6%, respectively. Since we are also interested in the side-lobe region, from the gain characteristics we have that the SLL can be higher than −20 dB in the region ±40◦ centered in the maximum gain
direction, that is SLL= Gsl− Gmax> −20 dB. As previously
mentioned, such array characteristics are matching with the personal radar need to have extremely high directive antennas in order to scan the environment and made the antenna compact and suitable for testing personal radar applications. For more details concerning the TAs, we refer the reader to [14].
IV. RESULTS
We now compare the performance of the previously con-sidered algorithms. In particular, by visual inspection, we show how such known methods fail in reconstructing the environment perimeter. As previously explained, all the three methods start from the generation of the joint angular and temporal matrix for each position, given by putting together measured data considering all the steering directions.
A temporal window of ∆τ ≈ 1.5 ns has been considered for the three approaches, which has been estimated through the TAs coupling. More specifically, for the algorithm 3, according to Sec. II-C and to the TA described in Sec. III, we set ∆φML= ±5◦ and∆φSL= ±40◦ both centered in the
maximum gain. Fig. 1-left shows how the spatial windows are accounted for in the gain pattern. In particular, the value of ±5◦, which means to account for a steering direction on the
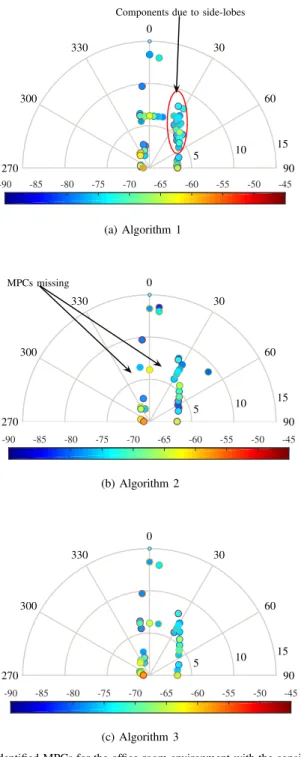
2 4 6 8 30 60 90 270 300 330 0 -90 -85 -80 -75 -70 -65 -60 -55 -50 -45
Components due to side-lobes
(a) Algorithm 1 2 4 6 8 30 60 90 270 300 330 0 -90 -85 -80 -75 -70 -65 -60 -55 -50 -45 MPCs missing (b) Algorithm 2 2 4 6 8 30 60 90 270 300 330 0 -90 -85 -80 -75 -70 -65 -60 -55 -50 -45 (c) Algorithm 3
Fig. 4. Identified MPCs for the corridor environment with the considered algorithms.
left and on the right from the maximum, has been estimated by considering the−10 dB main lobe.
Figs. 4 and 5 show the comparison of the obtained maps for the corridor and the room, respectively. By accounting for algorithm 1 (Fig. 4-top and Fig. 5-top), it is important to notice that for each retrieved component, we experience the presence of several contributions which can be intuitively associated to those of side-lobes. Consequently, as also reported in Table I, the number of MPCs is overestimated and need to be corrected. When instead the algorithm 2 is considered (Fig. 4-middle
5 10 15 30 60 90 270 300 330 0 -90 -85 -80 -75 -70 -65 -60 -55 -50 -45
Components due to side-lobes
(a) Algorithm 1 5 10 15 30 60 90 270 300 330 0 -90 -85 -80 -75 -70 -65 -60 -55 -50 -45 MPCs missing (b) Algorithm 2 5 10 15 30 60 90 270 300 330 0 -90 -85 -80 -75 -70 -65 -60 -55 -50 -45 (c) Algorithm 3
Fig. 5. Identified MPCs for the office room environment with the considered algorithms.
and Fig. 5-middle), there is another main limitation. In fact, if there is environment symmetry with respect to the radar posi-tion, useful components could be discarded. As also reported in the two figures, the detection of specular components is often missed each time two components fall in the same time window. Contrarily to the adoption of the algorithm 1, the number of paths risks to be underestimated, especially for what the corridor (i.e. a more symmetric environment) is concerned (see Table II).
TABLE I
ALGORITHM1 (CLEAN-LIKE APPROACH):NUMBER OF PATHS PER POSITION. Position p1 p2 p3 p4 p5 p6 p7 p8 p9 p10 p11 p12
Corridor 55 57 66 45 47 33 23 26 42 40 38 52
Room 61 48 53 74 49 49 71 75 61 48 -
-TABLE II
ALGORITHM2 [13]:NUMBER OF PATHS PER POSITION.
Position p1 p2 p3 p4 p5 p6 p7 p8 p9 p10 p11 p12
Corridor 16 11 15 12 17 13 18 16 16 16 17 13
Room 31 26 21 21 16 17 25 29 23 21 -
-TABLE III
ALGORITHM3 (PROPOSED APPROACH):NUMBER OF PATHS PER POSITION. Position p1 p2 p3 p4 p5 p6 p7 p8 p9 p10 p11 p12
Corridor 30 26 31 21 23 13 11 13 22 20 20 31
Room 34 25 28 38 23 23 37 36 31 22 -
-we risk to avoid symmetric components of the environment if we use algorithm 2, and from the other we might account for components due to side-lobes if we consider only a time window as in algorithm 1. A compromise is required in order to preserve a good balance between the number of components and undesired effects. As also previously underlined, the main goal is to collect MPCs which let to characterize the environment contour. By looking at Fig. 4-bottom and Fig. 5-bottom, it is possible to observe the benefits carried out by the proposed method for the previously considered four positions in the corridor and in the room, respectively. As it is possible to observe, the selected components follow the environment contour in line with the objective to find a proper channel modeling for environment mapping. Notably, the environment contour is much more defined with respect to the previous cases, and spurious components are avoided.
V. CONCLUSION
In this paper, an extended version of the CLEAN algo-rithm is described in order to discriminate the useful MPCs. Based on mmW backscattering measurements collected from different radar positions and steering directions, through the proposed CLEAN-like mechanism we enabled the possibility to determine the joint angular and delay information of the paths, thus reconstructing the contour of the environments. The obtained paths can be post-processed to obtain a mmW backscattering channel model for personal radars applications.
ACKNOWLEDGMENTS
This research was supported in part by the IF-EF Marie-Curie project MAPS (Grant 659067). Authors would like to thank Anna Guerra for her work in the measurement campaign and for the fruitful discussions.
REFERENCES [1] http://www.huawei.com/5gwhitepaper/.
[2] W. H. Chin, Z. Fan, and R. Haines, “Emerging technologies and research challenges for 5G wireless networks,” IEEE Wireless Commun., vol. 21, no. 2, pp. 106–112, April 2014.
[3] T. Rappaport et al., in Millimeter Wave Wireless Communications. Prentice Hall, 2014.
[4] F. Guidi, A. Guerra, and D. Dardari, “Personal mobile radars with millimeter-wave massive arrays for indoor mapping,” IEEE Trans.
Mobile Comput., 2015.
[5] A. Guerra et al., “Millimeter-wave backscattering measurements with transmitarrays for personal radar applications,” in Proc. IEEE Global
Conf. on Commun. (GLOBECOM), LION Workshop, 2015.
[6] P. F. Smulders, “Statistical characterization of 60-GHz indoor radio channels,” IEEE Trans. Antennas Propag, vol. 57, no. 10, pp. 2820– 2829, 2009.
[7] H. Xu, V. Kukshya, and T. Rappaport, “Spatial and temporal character-istics of 60-GHz indoor channels,” IEEE J. Sel. Areas Commun., vol. 20, no. 3, pp. 620–630, Apr 2002.
[8] T. Manabe, Y. Miura, and T. Ihara, “Effects of antenna directivity and polarization on indoor multipath propagation characteristics at 60 ghz,”
IEEE J. Sel. Areas Commun., vol. 14, no. 3, pp. 441–448, Apr 1996.
[9] P. Pajusco, N. Malhouroux-Gaffet, and G. El Zein, “Comprehensive characterization of the double directional UWB residential indoor chan-nel,” IEEE Trans. Antennas Propag., vol. 63, no. 3, pp. 1129–1139, 2015.
[10] C. Gustafson et al., “On mm-wave multipath clustering and channel modeling,” IEEE Trans. Antennas Propag., vol. 62, no. 3, pp. 1445– 1455, 2014.
[11] R.-M. Cramer, R. A. Scholtz, and M. Z. Win, “Evaluation of an ultra-wide-band propagation channel,” IEEE Trans. Antennas Propag., vol. 50, no. 5, pp. 561–570, 2002.
[12] Q. H. Spencer et al., “Modeling the statistical time and angle of arrival characteristics of an indoor multipath channel,” IEEE J. Sel. Areas
Commun., vol. 18, no. 3, pp. 347–360, March 2000.
[13] K. Haneda et al., “A statistical spatio-temporal radio channel model for large indoor environments at 60 and 70 GHz,” IEEE Trans. Antennas
Propag., vol. 63, no. 6, pp. 2694–2704, 2015.
[14] H. Kaouach et al., “Wideband low-loss linear and circular polarization transmit-arrays in V-band,” IEEE Trans. Antennas Propag., vol. 59, no. 7, pp. 2513–2523, July 2011.
[15] A. Guerra et al., “Delay spread characterization of millimeter-wave in-door backscattering channel,” in Proc. 10th European Conf. on Antennas
and Propag. (EuCAP), April 2016.
[16] A. Clemente et al., “Wideband 400-element electronically reconfigurable transmitarray in X band,” IEEE Trans. Antennas Propag., vol. 61, no. 10, pp. 5017–5027, Oct 2013.