Publisher’s version / Version de l'éditeur:
Vous avez des questions? Nous pouvons vous aider. Pour communiquer directement avec un auteur, consultez la première page de la revue dans laquelle son article a été publié afin de trouver ses coordonnées. Si vous n’arrivez pas à les repérer, communiquez avec nous à [email protected].
Questions? Contact the NRC Publications Archive team at
[email protected]. If you wish to email the authors directly, please see the first page of the publication for their contact information.
https://publications-cnrc.canada.ca/fra/droits
L’accès à ce site Web et l’utilisation de son contenu sont assujettis aux conditions présentées dans le site LISEZ CES CONDITIONS ATTENTIVEMENT AVANT D’UTILISER CE SITE WEB.
Proceedings of the 2007 IEEE International Joint Conference on Neural Networks
(IJCNN 2007), 2007
READ THESE TERMS AND CONDITIONS CAREFULLY BEFORE USING THIS WEBSITE. https://nrc-publications.canada.ca/eng/copyright
NRC Publications Archive Record / Notice des Archives des publications du CNRC :
https://nrc-publications.canada.ca/eng/view/object/?id=03d3a799-fc27-4919-828b-9078809b0199
https://publications-cnrc.canada.ca/fra/voir/objet/?id=03d3a799-fc27-4919-828b-9078809b0199
NRC Publications Archive
Archives des publications du CNRC
This publication could be one of several versions: author’s original, accepted manuscript or the publisher’s version. / La version de cette publication peut être l’une des suivantes : la version prépublication de l’auteur, la version acceptée du manuscrit ou la version de l’éditeur.
Access and use of this website and the material on it are subject to the Terms and Conditions set forth at
Multi-objective Evolutionary Optimization of Neural Networks for Virtual
Reality Visual Data Mining: Application to Hydrochemistry
Multi-objective Evolutionary Optimization of
Neural Networks for Virtual Reality Visual
Data Mining: Application to
Hydrochemistry *
Valdés, J. and Barton, A.
2007
* proceedings of 2007 IEEE International Joint Conference on Neural Networks. Orlando, Florida, USA. August 12-17, 2007. NRC 49296.
Copyright 2007 by
National Research Council of Canada
Permission is granted to quote short excerpts and to reproduce figures and tables from this report, provided that the source of such material is fully acknowledged.
Multi-objective Evolutionary Optimization of Neural Networks for
Virtual Reality Visual Data Mining: Application to Hydrochemistry
Julio J. Vald´es and Alan J. Barton
Abstract— A method for the construction of Virtual Reality spaces for visual data mining using multi-objective optimization with genetic algorithms on neural networks is presented. Two neural network layers (output and last hidden) are used for the construction of simultaneous solutions for: a supervised classification of data patterns and the computation of two unsupervised similarity structure preservation measures be-tween the original data matrix and its image in the new space. A set of spaces is constructed from selected solutions along the Pareto front which enables the understanding of the internal properties of the data based on visual inspection of non-dominating spaces with different properties. This strategy represents a conceptual improvement over spaces computed by single-objective optimization. The presented approach is domain independent and is illustrated with an application to the study of hydrochemical properties of ice and water samples from the Arctic.
I. INTRODUCTION
The purpose of this paper is to explore the construction of high quality VR spaces for visual data mining through the use of multi-objective optimization based on genetic algorithms (MOGA) operating on neural networks. Both the network output and the output of the last hidden layer are used for constructing solutions that simultaneously satisfy class separability and similarity structure preservation. Thus, a set of spaces can be obtained in which the different objectives are expressed to different degrees; with the proviso that no other spaces could improve any of the considered criteria individually (if spaces are selected from the Pareto front). This strategy represents a conceptual improvement over spaces that have been computed from the solutions ob-tained by single-objective optimization algorithms in which the objective function is a weighted composition involving different criteria. This approach is applied to a hydrochemical investigation in the Arctic.
II. HYDROCHEMICALRESEARCH IN THEARCTIC
During the scientific expedition Spitzbergen’85, organized by the University of Silesia Poland in 1985, a scientific team composed by specialists from this university, the National Center for Scientific Research Cuba, and the Academy of
Julio J. Vald´es is with the National Research Council Canada, Insti-tute for Information Technology, 1200 Montreal Rd. Bldg M50, Ottawa, ON K1A 0R6, Canada (phone: 613-993-0887; fax: 613-993-0215; email: [email protected]).
Alan J. Barton is with the National Research Council Canada, Institute for Information Technology, 1200 Montreal Rd. Bldg M50 , Ottawa, ON K1A 0R6, Canada (phone: 613-991-5486; fax: 613-993-0215; email: [email protected]).
Sciences of Cuba, performed glaciological and hydrogeolog-ical investigations in several regions of the Spizbergen island in the Svalbard archipielago (Fig.1).
Fig. 1. The Svalbard archipielago (Spitzbergen is the main island). The area where the samples were taken is the neighborhood of the Werenskiold Glacier, to the north-west of the Hornsund Fiord (highlighted with a circle).
The purpose of the research was to determine the mass and energy balance within experimental hydrogeological basins, to study the interaction between natural waters and rock forming minerals under the severe conditions of polar climate and the comparison with similar processes developed in trop-ical conditions. This has been a long term research of several polish universities (Silesia, Warsaw and Wroclaw) and the Polish Academy of Sciences since the First Geophysical Year in 1957. This research has made an important contribution to the evaluation of the impact of global climatic changes.
In this region there are complex processes taking place under peculiar geological, geomorphological and hydrogeo-logical conditions which are reflected in water geochemistry. During that expedition, a collection of ice and water samples were taken from different hydrogeological zones in the region of the Hornsund fjords in Spitzbergen, specifically in the basin of the Werenskiold Glacier (Fig.1). These samples are representative of different zones from a hydrogeological point of view: subglacier, supraglacier, springs, lakes, snow, ice, and the tundra. Geochemical and hydrogeological studies of these data [8], [9] have shown the relation between the different hydrogeological conditions present in Spitzbergen and the chemical composition of the waters and ice. This is reflected by the existence of several families of waters,
thus enabling an indirect assessment of their hydrogeological origin from the information given by their geochemical parameters. A set of 51 water samples from Spitzbergen corresponding to 5 hydrogeological families of waters were characterized by a collection of physical and chemical pa-rameters which were determined in situ: temperature, pH, electrical conductivity, hydrocarbonate, chloride, sulphate, calcium, magnesium and sodium-potasium.
Fig. 2. Schematic longitudinal section of the Werenskiold Glacier. The different types of waters analyzed are: A) precipitation (snow, ice), B) supraglacier, C) subglacier, D) tundra, E) moraine lakes.
III. VIRTUALREALITYREPRESENTATIONOF
RELATIONALSTRUCTURES ANDVISUALDATAMINING
A visual virtual reality based data mining technique ex-tending the concept of 3D modeling to relational struc-tures was presented in [22], [24], (see also http://www. hybridstrategies.com). With this approach, large highly dimensional, heterogeneous, incomplete and impre-cise data, as well as other forms of structured and un-structured knowledge can be visually explored. The data objects are considered as tuples from a heterogeneous space [23] which is a Cartesian product of a collection of source sets: ˆ
H
n= Ψ1× · · · ×Ψn , where n > 0 is the number of
information sources to consider.
The notion of a virtual reality space is given by the tuple ϒ =< O, G, B, ℜm, g
o, l, gr, b, r >, where O is a relational
structure (O=< O, Γv>, O is a finite set of objects, andΓv
is a set of relations. For example, v different classifications defined on the same set of objects); G is a non-empty set of
geometriesrepresenting the different objects and relations; B is a non-empty set of behaviors of the objects in the virtual world; ℜm⊂ Rm is a metric space of dimension m which
will be the actual virtual reality geometric space. The other elements are mappings: go: O → G, l : O →ℜm, gr:Γv→G, b: O → B which have to be defined for the particular kind of representation desired.
Of particular importance is the mapping l, where several desiderata can be considered for building a VR-space. From a supervised learning point of view, l could be chosen as to emphasize some measure of class separability over the objects in O [14], [24]. From an unsupervised perspective, the role of l could be to maximize some metric/non-metric structure preservation criteria [3], [1], or minimize measures
of information loss [15], [21], defined to be:
Kruskal stress= v u u t ∑i< j(δ2i j−ζ2i j)2 ∑i< jδ4i j (1) Sammon error= 1 ∑i< jδi j ∑i< j(δi j−ζi j)2 δi j (2)
whereδi j is a dissimilarity measure in the original space
between any objects i, j and ζi j a dissimilarity measure
in the new space (the virtual reality space) between the images of objects i, j. Typically, classical algorithms have been used for directly optimizing such measures, like Steep-est descent, Conjugate gradient, Fletcher-Reeves, Powell, Levenberg-Marquardt, and others. However, they suffer from local extrema entrapment. Hybrid approaches have been con-sidered, like combining Particle Swarm Optimization with classical optimization [25]. The l mappings obtained using approaches of this kind are only implicit, as no functional representations are found. However, explicit mappings can be obtained from these solutions using neural network or genetic programming techniques. An explicit l in the form of a general function approximator is useful for both practical and theoretical reasons because the properties of the mapping can be learned from a sample. If the learning process is successful and a reasonable degree of generalization has been achieved, the learnt function can be applied to new incoming patterns (as long as they can be considered as samples from the statistical populations represented in the training set).
IV. MULTI-OBJECTIVEOPTIMIZATION
USINGGENETICALGORITHMS
A genetic algorithm permits particular sequences of opera-tions on individuals of the current population in order to con-struct the next population in a series of evolving populations. The classical algorithm requires each individual to have one measure of its fitness, which enables the algorithm to select the fittest individuals for inclusion in the next population. An enhancement is to allow an individual to have more than one measure of fitness. The problem then arises for determining which individuals should be included within the next population, because a set of individuals contained in one population exhibits a Pareto Front[19] of best current individuals, rather than a single best individual. Most [2] multi-objective algorithms use the concept of dominance when addressing this problem.
A solution↼x(1) is said to dominate [2]↼x(2) for a set of m objective functions < f1( ↼ x), f2( ↼ x), ..., fm( ↼ x) > if 1) ↼x(1) is not worse than↼x(2) over all objectives.
For example, f3( ↼ x(1)) ≤ f3( ↼ x(2)) if f3( ↼ x) is a mini-mization objective.
2) ↼x(1)is strictly better than↼x(2)in at least one objective. For example, f6( ↼ x(1)) > f6( ↼ x(2)) if f6( ↼ x) is a maxi-mization objective.
One particular algorithm for multi-objective optimiza-tion is the elitist non-dominated sorting genetic algorithm
(NSGA-II) [4], [5], [6], [2]. It has the features that it i) uses elitism, ii) uses an explicit diversity preserving mechanism, and iii) emphasizes the non-dominated solutions.
A. Multi-objective Optimization of Neural Networks for Space Transformation
In the supervised case, a natural choice for representing the l mapping is a nonlinear discriminant neural network (NDA) [27], [16], [17], [13]. The classical backpropagation approach to building NDA networks suffers from the well known problem of local extrema entrapment. This problem was approached in [26] with hybrid stochastic-deterministic feed forward networks where training is based on a combi-nation of simulated annealing with conjugate gradient, which improves the likelihood of finding good extrema while con-taining enough determinism. The problem can be approached from an evolutionary computation (EC) perspective with networks trained with evolution strategies, particle swarm optimization, or other EC algorithms. In particular genetic algorithms may be used in the following way: The network weights of the different layers is coded into a real-valued chromosome. Then, the output of both the output layer and the last hidden layer are exported (Fig. 3) and are used for computing three different error measures: one related to supervised learning and the other two - to unsupervised learning.
Fig. 3. Feed forward neural network for 3-objective optimization. ~xiis an
input pattern to the network, ciis the network-predicted class membership
of the input vector as coded by the output network layer and ~xt
iis the output
of the last hidden layer, representing a transformation of the input vector into another space. Objective 1 (supervised): classification error based on ci, Objectives 2-3 (unsupervised): Sammon error and Kruskal stress based
on ~xt i.
The collection of last hidden layer outputs is the image of the data matrix in the original n-dimensional space, to the usually lower m-dimensional Euclidean subspace defined by the hypercube with sides conditioned by the range of the activation function operating in the last hidden layer. A similarity (dissimilarity) measure can be defined for the patterns in the transformed space and an error measure w.r.t another measure in the original space can be computed for evaluating the structure preservation (loss) associated with
the transformation performed by the collection of hidden lay-ers of the network. In a multi-objective setting, both Sammon Error and Kruskal stress (Eq.2) were simultaneously used as measures for characterizing dissimilarity loss.
V. EXPERIMENTALSETTINGS ANDMAINRESULTS
A multi-objective experiment was performed in order to study some of the properties of the data used within this study. The experimental settings for the multi-objective experiment is shown in Table-I.
TABLE I
EXPERIMENTAL SETTINGS FORi)THE INPUT DATAii)THE LEADER
ALGORITHM, iii)THE EVOLUTIONARY MULTI-OBJECTIVE OPTIMIZATION
ALGORITHM(NSGA-II),ANDiv)THE OBJECTIVE FUNCTIONS(E.G.THE
NON-LINEAR DISCRIMINANT ANALYSIS).
Number of attributes 9 Number of objects 51 Number of classes 5 Population Size 100 Max. No. Iterations 2000
Chromosome Length Determined by NN layout (9 · 3 + 3) + (3 · 5 + 5) = 50
Seed 101
Number of New Individuals 20 Probability of Crossover 0.8 Probability of Mutation 0.4
Optimization Direction Minimize (for all three objectives) Crossover Type Uniform, prob.= 0.6
Mutation Type Gaussian
Selection Tournament, prob.= 0.6 Mutation and crossover yes
Initialization bounds [−1, 1] per allele Mutation Bounded NO
Fitness Type Raw
Stopping Rule After max. No. iterations
Restart GA No
3 Objectives Classification Error and Sammon Error and Kruskal stress
Constraints NO
Network Layout 1 hidden layer (3 neurons) output layer (5 neurons) Activation Functions tanhfor both layers NN Output Threshold 0
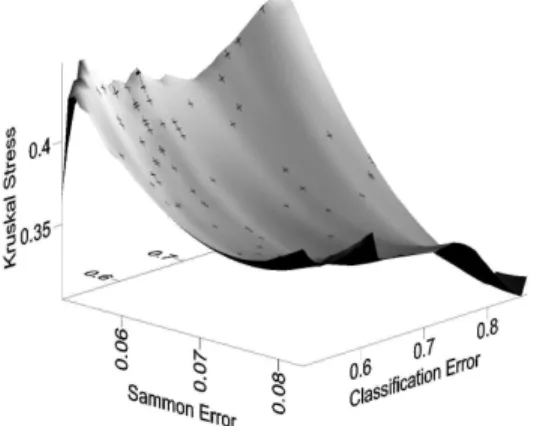
A multi-objective algorithm (NSGA-II) was used to gen-erate and search for solutions minimizing three objectives; namely, two unsupervised measures (Sammon Error and Kruskal Stress) and one supervised measure. The goal was to find a set of solutions (lying in 3-objective space) that would have the best features of all of the objectives. This set of solutions (if global convergence of the optimization procedure has occurred) belong to a surface that is known as the Pareto Front. Fig.4 shows an approximation to the Pareto Front that was obtained using the Werenskiold Glacier data. The minimum value of each of the objectives occurs in the lower left hand corner, which would be the absolute ideal solution (i.e. all objectives with a zero error value) if such a solution were possible. In order to aid visualization, the set of obtained solution points were used to construct a local polynomial surface representation; overtop of which,
the points have been placed (small plus symbols) to give an indication of their location on the surface. Overall, the surface is tending to bend toward the ideal solution surface, as expected. This set of solutions was obtained after 2, 000 iterations of the algorithm. Since this is an evolutionary algorithm consisting of a population of solutions, it can be desirable to consider the evolution of the solution surface. For example, has the surface stabilized to what might be a good approximation to the Pareto Front? Fig.5 shows two sets of solutions. The local polynomial surface representation of the solution points obtained after 1, 800 iterations is shown in light grey, while the local polynomial surface representation of the solution points obtained after 2, 000 iterations is shown in black. It can be seen that the black surface is beneath the light grey surface, indicating that the evolutionary process is moving the approximation of the Pareto Front closer towards the lower left hand corner (the ideal minimum error solution point for all objectives) as expected. Fig.6 is a 2-dimensional representation of an approximation to the 3-dimensional Pareto Front for which the algorithm is searching. It shows all of the 100 solution points plotted in terms of each of their respective objective values; of which the two unsupervised objectives were selected. The best solutions would have minimum Sammon Error and Kruskal Stress (lower left hand corner). It can be seen that when Sammon Error is reduced then Kruskal Stress is increased, leading to a parabolic type of relationship. If the algorithm was only producing 2-objective solutions, then, for example, the clearly dominated solutions at about (0.074, 0.36) would not be in the figure. Hence, this confirms both the 3-dimensional nature and tradeoffs of the objective measures over the obtained solutions.
Fig. 4. Local polynomial surface representation of 100 solutions obtained after 2, 000 iterations of the NSGA-II algorithm. Small plus symbols placed on surface indicate solution locations in the objective space. Lower left hand corner: location of the best theoretical solution (i.e. all objectives with a zero error value).
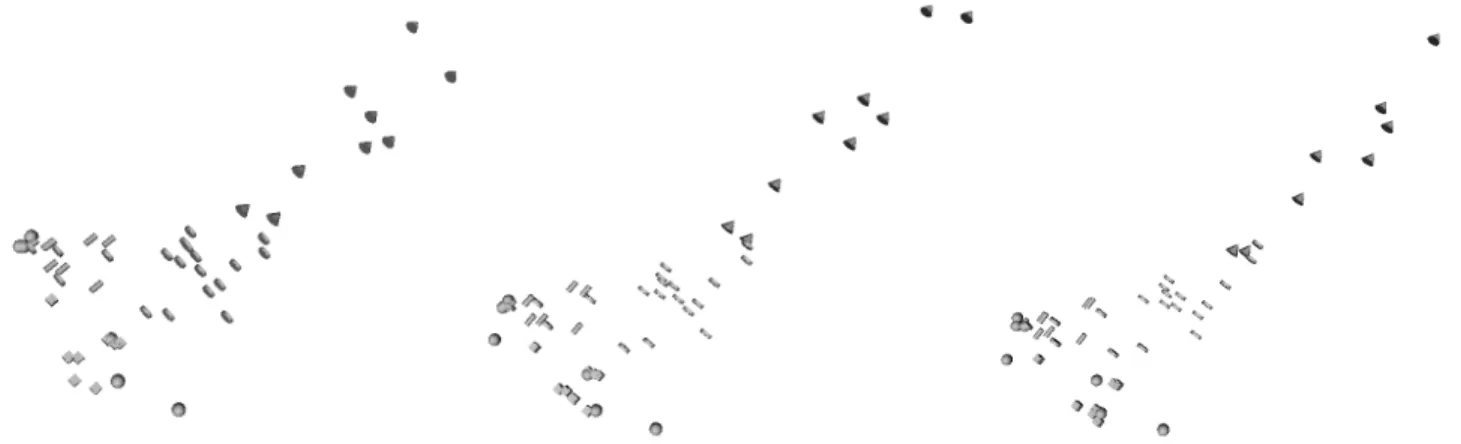
It is interesting to observe the relative location of the different classes of waters in the multi-objective VR spaces of Figs.7-10. At the lower left extreme are the precipitation, supraglacier and tundra classes and at the upper right is the moraine-lakes class. The firsts have low mineralization
Fig. 5. Two sets of solutions each with 100 points. The local polynomial surface representations of the solution points obtained after i) 1, 800 itera-tions (light grey), and ii) 2, 000 iteraitera-tions (black). Lower left hand corner: location of best theoretical solution (i.e. all objectives with a zero error value). 0.34 0.36 0.38 0.4 0.42 0.44 0.46 0.05 0.055 0.06 0.065 0.07 0.075 0.08 0.085 Kruskal Stress Sammon Error
Fig. 6. 2-dimensional representation of an approximation to the 3-dimensional Pareto Front showing all 100 solution points. The two unsuper-vised objectives were selected (Sammon Error and Kruskal Stress). Lower left hand corner: location of best theoretical solution (i.e. all objectives with a zero error value).
(expressed by the electric conductivity and the ion concen-trations of the chemical species), whereas the last one has the highest mineralization levels. The waters from moraine lakes are stagnated and are in contact with the rock for a long time. Moreover, they are affected by the cryochemical effect which increases the concentration of the chemical content when freezing.
The common relations emerging from the VR spaces of Figs.7-10 suggest a scheme of transitions starting from precipitation waters (spheres), which forks into supraglacier waters (rods) and tundra (cubes) (both with low mineral content but well differentiated in the VR space). Whereas tundra waters remain stagnated, supra-glacier waters evolve into subglacier, as they percolate down into the glacier through cracks, joints, sinks, etc. They can interact with the rock materials embedded within the ice and eventu-ally those who reach the bottom of the glacier, with the bedrock. Also, they traverse greater lengths through the
Fig. 7. VR spaces corresponding to selected multi-objective optimization algorithm (NSGA-II) solutions. Left: Chromosome 1 (Sammon: 0.0524355, Classif: 0.823529, Kruskal: 0.446838) Middle: Chromosome 63 (Sammon: 0.0635931, Classif: 0.862745, Kruskal: 0.359690) Right: Chromosome 2 (Sammon: 0.0830854, Classif: 0.764706, Kruskal: 0.346527) Geometry: disk = Subglacir, rod = Supraglacier, sphere = Precipitation, cone = Moraine lakes, cube = Tundra. Behavior = static.
geological space and as consequence, they increase their original mineral content. Finally, these subglacier waters emerge from the glacier as springs or underground rivers and either reach the sea or get trapped into depressions in the zone of the frontal moraines. The general direction lower-left → upper-right in all of the multiobjective VR spaces captures the hydrogeological history of the waters in the geological environment studied, as portrayed by the changes in the physical and chemical properties. Moreover, a closer look at the individual relationships seen in the VR spaces suggest possible explanations for apparent anomalies observed in some samples. For example, at the lower right of almost all VR spaces two subglacier samples overlap with supraglacier ones, deviating from the general scheme outlines above. It means that from the point of view of the physical and chemical composition, the corresponding samples are very similar, to the point that these samples were classified as supraglacier (which physically they are not). However, considering that the information represented by the space concerns only physical and chemical properties, this might provide an indication that these waters emerging from the glacier might have experienced short paths within the glacier and/or rapid transit times because they moved through large open spaces like galleries or underground rivers, as opposed to other samples coming from springs fed by waters moving through narrow cracks or joints in the ice mass.
Fig. 8. Proposed scheme for water evolution based on the VR spaces obtained with multi-objective optimization.
VI. CONCLUSIONS
Advanced computational intelligence approaches such as multi-objective optimization of neural networks using genetic algorithms, proved to be very effective for constructing
new feature spaces for visual data mining. In particular, networks trained to maximize structure preservation (using two unsupervised criteria computed from the last hidden layer output of the network) and classification accuracy (using the network’s output layer) can be simultaneously computed. From them, spaces constructed using the set of solutions distributed through the Pareto front lead to visual representation capturing important relationships between the data objects which helps in their interpretation and under-standing. The application of this approach to the study of the relationships of the physical and chemical properties of natural waters with the hydrogeological environment proved to be effective.
ACKNOWLEDGMENT
The authors would like to thank Robert Orchard from the National Research Council Canada, Institute for Information Technology for his constructive criticism of the first draft of this paper.
REFERENCES
[1] I. Borg and J. Lingoes, Multidimensional similarity structure analysis. Springer-Verlag, 1987.
[2] E. K. Burke and G. Kendall, Search Methodologies: Introductory Tutorials in Optimization and Decision Support Techniques. Springer Science and Business Media, Inc. New York, 2005.
[3] J. L. Chandon and S. Pinson. Analyse typologique. Th´eorie et applica-tions. Masson, Paris, 1981.
[4] K. Deb, A. Pratap, S. Agarwal, and T. Meyarivan, “A fast and elitist multi-objective genetic algorithm: Nsga-ii,” Technical Report 2000001, Kanpur Genetic Algorithms Laboratory(KanGAL), Indian Institute of Technology Kanpur, 2000.
[5] K. Deb, S. Agarwal, A. Pratap, and T. Meyarivan, “A fast elitist non-dominated sorting genetic algorithm for multi-objective optimization: Nsga-ii,” Proceedings of the Parallel Problem Solving from Nature VI Conference, pp. 849–858, Paris, France, 16-20 September 2000. [6] K. Deb, S. Agarwal, and T. Meyarivan, “A fast and elitist multi-objective
genetic algorithm: Nsga-ii,” IEEE Transaction on Evolutionary Compu-tation, vol. 6 (2), pp. 181–197, 2002.
[7] R. O. Duda and P. E. Hart, Pattern Classification and Scene Analysis. Wiley New York, 1972.
[8] Fagundo J.R., Vald´es J. J., Pulina M. Hydrochemical Investigations in Extreme Climatic Areas, Cuba and Spitzbergen. Water Resources Management and Protection in Tropical Climates. pp 45–54 Stockholm, 1990.
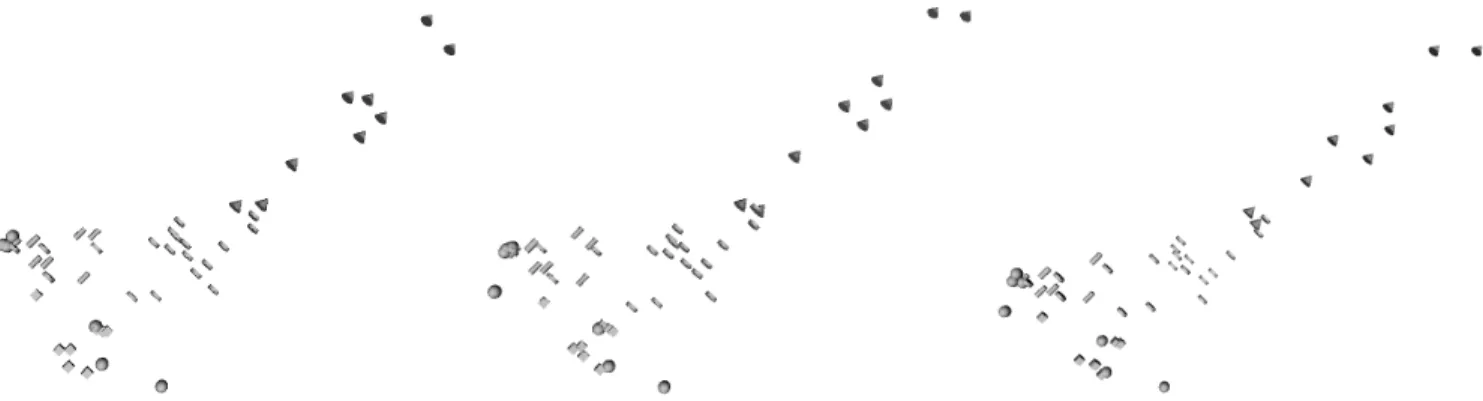
Fig. 9. VR spaces corresponding to selected multi-objective optimization algorithm (NSGA-II) solutions. Left: Chromosome 18 (Sammon: 0.0544478, Classif: 0.686275, Kruskal: 0.405003) Middle: Chromosome 16 (Sammon: 0.0651361, Classif: 0.705882, Kruskal: 0.354888) Right: Chromosome 39 (Sammon: 0.0812148, Classif: 0.647059, Kruskal: 0.346815) Geometry: disk = Subglacier, rod = Supraglacier, sphere = Precipitation, cone = Moraine lakes, cube = Tundra. Behavior = static.
Fig. 10. VR spaces corresponding to selected multi-objective optimization algorithm (NSGA-II) solutions. Left: Chromosome 40 (Sammon: 0.0539147, Classif: 0.549020, Kruskal: 0.440931) Middle: Chromosome 96 (Sammon: 0.0626495, Classif: 0.549020, Kruskal: 0.367218) Right: Chromosome 44 (Sammon: 0.0788638, Classif: 0.529412, Kruskal: 0.347438) Geometry: disk = Subglacier, rod = Supraglacier, sphere = Precipitation, cone = Moraine lakes, cube = Tundra. Behavior = static.
[9] Fagundo J.R., Vald´es J. J., Rodr´ıguez J.E. Karst Hydrochemistry (in Spanish). Research Group of Water Resources and Environmental Geology. University of Granada, Spain. Osuna, 1996.
[10] K. Fukunaga, Introduction to Statistical Pattern Recognition. Aca-demic Press, 1972.
[11] J. C. Gower, “A general coefficient of similarity and some of its properties,” Biometrics, vol.1 no.27, pp.857–871, 1971.
[12] J. Hartigan, Clustering Algorithms. John Wiley & Sons, 1975. [13] A. K. Jain and J. Mao, “Artificial neural networks for nonlinear
projection of multivariate data,” 1992 IEEE joint Conf. on Neural Networks, pp. 335–340, Baltimore, MD, 1992.
[14] M. Jianchang and A. Jain, “Artificial neural networks for feature extraction and multivariate data projection,” IEEE Trans. On Neural Networks, vol. 6(2), pp.1–27, 1995.
[15] J. Kruskal, “Multidimensional scaling by optimizing goodness of fit to a nonmetric hypothesis,” Psichometrika, vol. 29 pp.1–27, 1964. [16] J. Mao and A. K. Jain, “Discriminant analysis neural networks,” 1993
IEEE International Conference on Neural Networks, pp. 300–305, San Francisco, California, March 1993.
[17] J. Mao and A. K. Jain, “Artificial neural networks for feature extraction and multivariate data projection,”IEEE Trans. on Neural Networks, vol. 6 pp.296–317, 1995.
[18] T. Masters. Advanced Algorithms for Neural Networks. John Wiley & Sons, 1993.
[19] V. Pareto, Cours D’Economie Politique, volume I and II. F. Rouge, Lausanne, 1896.
[20] Press, W.H., Flannery, B.P., Teukolsky, S.A. and Vetterling, W.T. Numerical Recipes in C, Cambridge University Press, New York, 1986.
[21] J. W. Sammon, “A non-linear mapping for data structure analysis,” IEEE Trans. Computers, C18 pp.401–408, 1969.
[22] Vald´es J. J., “Virtual reality representation of relational systems and decision rules,” In P. Hajek, editor, Theory and Application of Relational Structures as Knowledge Instruments, Meeting of the COST Action 274. Prague, Nov 2002.
[23] Vald´es J. J., “Similarity-based heterogeneous neurons in the context of general observational models,” Neural Network World, vol. 12(5) pp. 499–508, 2002.
[24] J. J. Vald´es, “Virtual reality representation of information systems and decision rules,” Lecture Notes in Artificial Intelligence, vol. 2639 LNAI, pp. 615–618. Springer-Verlag, 2003.
[25] J. Vald´es, “Building virtual reality spaces for visual data mining with hybrid evolutionary-classical optimization: Application to microarray gene expression data,” 2004 IASTED International Joint Conference on Artificial Intelligence and Soft Computing, ASC’2004, pp. 161–166, Marbella, Spain, Sept 2004. ACTA Press, Anaheim, USA.
[26] J. J. Vald´es, A.J. Barton, “Virtual Reality Visual Data Mining with Nonlinear Discriminant Neural Networks: Application to Leukemia and Alzheimer Gene Expression Data,” Proceedings of the IJCNN’05 International Joint Conference on Neural Networks, Montreal, 2005. [27] A. R. Webb and D. Lowe, “The optimized internal representation of
a multilayer classifier,” Neural Networks, vol. 3, pp.367–375, 1990. [28] P. Walker, B. Smith, Y. Qing, F. Famili, J. J. Vald´es, L. Ziying, and
L. Boleslaw, “Data mining of gene expression changes in alzheimer brain,” Artificial Intelligence in Medicine, vol. 31, pp.137–154, 2004.