RESEARCH OUTPUTS / RÉSULTATS DE RECHERCHE
Author(s) - Auteur(s) :
Publication date - Date de publication :
Permanent link - Permalien :
Rights / License - Licence de droit d’auteur :
User-steering Interpretable Visualization with Probabilistic Principal Components
Analysis
Vu, Viet Minh; Frenay, Benoît
Published in:
ESANN 2019 - Proceedings, 27th European Symposium on Artificial Neural Networks, Computational Intelligence and Machine Learning
Publication date:
2019
Document Version
Publisher's PDF, also known as Version of record
Link to publication
Citation for pulished version (HARVARD):
Vu, VM & Frenay, B 2019, User-steering Interpretable Visualization with Probabilistic Principal Components Analysis. in ESANN 2019 - Proceedings, 27th European Symposium on Artificial Neural Networks,
Computational Intelligence and Machine Learning: 27th European Symposium on Artificial Neural Networks, Computational Intelligence and Machine Learning. ESANN 2019 - Proceedings, 27th European Symposium on
Artificial Neural Networks, Computational Intelligence and Machine Learning, i6doc.com publication, pp. 349-354, 27th European Symposium on Artificial Neural Networks, Computational Intelligence and Machine
Learning, Bruges, Belgium, 24/04/19. <https://www.elen.ucl.ac.be/Proceedings/esann/esannpdf/es2019-44.pdf>
General rights
Copyright and moral rights for the publications made accessible in the public portal are retained by the authors and/or other copyright owners and it is a condition of accessing publications that users recognise and abide by the legal requirements associated with these rights. • Users may download and print one copy of any publication from the public portal for the purpose of private study or research. • You may not further distribute the material or use it for any profit-making activity or commercial gain
• You may freely distribute the URL identifying the publication in the public portal ? Take down policy
If you believe that this document breaches copyright please contact us providing details, and we will remove access to the work immediately and investigate your claim.
User-steering Interpretable Visualization with
Probabilistic Principal Components Analysis
Viet Minh Vu∗ and Benoˆıt Fr´enay
NADI Institute - PReCISE Research Center Universit´e de Namur - Faculty of Computer Science
Rue Grandgagnage 21, 5000 Namur - Belgium
Abstract. The lack of interpretability generally in machine learning and specifically in visualization is often encountered. Integration of user’s feedbacks into visualization process is a potential solution. This paper shows that the user’s knowledge expressed by the positions of fixed points in the visualization can be transferred directly into a probabilistic principal components analysis (PPCA) model to help user steer the visualization. Our proposed interactive PPCA model is evaluated with different datasets to prove the feasibility of creating explainable axes for the visualization.
1
Introduction
Visualization techniques are widely used to represent high dimensional data. However sometimes it is hard to understand the embedding result. The inter-pretability in visualization can be subjectively measured as the level to which a human can understand the visualization. Thus, one way to enhance inter-pretability is to allow users to interact with the visualization to gain a better understanding of the data. For example, forward and backward projection [3] allows the user to move an embedded point in the 2D space to observe which features in the high dimensional space are changed according to the movement. iPCA [6] allows the users to interact with multiple views in data-space and eigen-space to analyze the influence of a particular data point or a dimension to the whole visualization in each space. As an inevitable emergence, human-in-the-loop techniques in visual analytics are more and more studied. The survey of Sacha et al. [9] presents several works devoted to clarify the interpretation in visualization. InterAxis [7], for instance, allows the user to select any set of two features to create a 2D scatter plot in which she can select points as examples to define new understandable axes.
Besides the interactive techniques intentionally created for visual analyt-ics, non-interactive dimensionality reduction methods like probabilistic PCA (PPCA) [10] can be enhanced in an interactive context. In the bayesian vi-sual analytics framework (BaVA) [5], the user can manipulate the embedding result of PPCA. When the observations are expected to be close but they are not in the visualization, the user can move them close together and vice versa. BaVA transforms this kind of cognitive feedbacks into parametric feedbacks in order to integrate them into the PPCA model.
Towards a goal of creating an interpretable visualization, our proposed in-teractive PPCA (iPPCA) model allows the user to freely move points in the visualization to create understandable axes. This work differs from the BaVA framework in that it uses directly the user’s feedbacks as prior knowledge to construct the model. Based on the principle of model-based machine learning (Sec. 2), we build the iPPCA model that make use of the user’s feedbacks in the form of fixed positions as prior information (Sec. 3). The model is visually eval-uated with different use cases to show its ability to create the explainable axes based on the user’s intention (Sec. 4). Lastly, we discuss an in-depth motivation behind our model as a complement to the original PPCA, the shortcomings of our approach as well as our perspective for the future work (Sec. 5).
2
Background in Model-based Machine Learning
Traditional machine learning offers thousands of well-studied methods for solv-ing a wide range of problems. When tacklsolv-ing a new problem, our focus is on mapping it to one of these existing methods, i.e., choosing the right algorithm. Another approach draws our attention to describe the problem rather than the method to solve it. This model-based approach [2] uses explicitly the domain knowledge to construct a probabilistic model to describe the observed data. The focus is thus on how to represent and manipulate uncertainty about the model, not the algorithm[4]. The model which is a set of assumptions, expressed in a precise mathematical form [12], can be hierarchically complex, consisting of thousands or even millions of random variables. Finding closed-form solution for all variables is often impractical. However probabilistic programming languages such as Stan1, PyMC2or Edward3can solve the inference problem automatically
and efficiently, what encourages researchers to focus their attention and efforts on building and testing the models.
Let us consider a problem of dimensionality reduction as an example. PCA is a technique to find the underlying variables, known as the principal compo-nents, that best explains the variance in the data. It is done by finding a set of eigenvectors corresponding to the highest eigenvalues to form a linear map-ping to project the data from high to low dimensional space. On the contrary, under a probabilistic view point, the high dimensional data is considered to be generated from the corresponding latent variables in low dimensional space via a linear projection with some quantity of noise. The PPCA model consists of prior assumptions about latent variables, noise and values of the mapping ma-trix [1]. Our interactive extension iPPCA focuses on describing and evaluating the integration of user’s feedbacks into the original PPCA model. The principal components (informally the axes in the visualization) of PCA are orthogonal but those of PPCA are not, i.e., the visualization of PPCA can be arbitrary. iPPCA tackles this problem by allowing the user to define semantic axes based on the interacted examples.
1
3
Interactive PPCA
Let X = {xn} N
n=1 be an observed dataset of N data points, each xn∈ RD.
Let Z = {zn}Nn=1 be a set of N corresponding latent variables, each zn ∈ RM.
Let W ∈ RD×M, M ≪ D, be a mapping from D- to M - dimensional space. The latent variables are the embedding to be plotted in 2D space for which the user can interact with. From now on, when we talk about the embedded point at the visualization level, we imply the corresponding latent variable in the model level. To enable interaction, an initial result of the original PPCA model is first shown to the user in a scatter plot. She can then change the positions of points to steer the visualization. An embedded point zn(untouched by user) is modeled
by a normal distribution with zero mean and unit variance. If the position of an embedded point zn is manually set by a user with some level of uncertainty, it
is considered to be drawn from a Gaussian distribution with the mean indicated by the fixed position µn and the variance σfix2 indicating the user’s uncertainty:
zn∼
(
N (zn | µn, σ2fix) if zn is fixed by user,
N (zn | 0, 1) otherwise.
(1) In this way, Z consists of both user-modified and non-modified latent variables. Each data point xnis generated from the corresponding latent variable as xn=
W zn+ ǫ, where ǫ is an isotopic Gaussian noise. The observed data is assumed
to be standardized (zero-centered and normalized to have unit variance). The prior distributions of others parameters are modeled as suggested in [1]:
ǫ∼ N (ǫ | 0, σ2I D), σ2∼ LogNormal(σ2| 0, 1). Wi∼ N (Wi| 0, αI M), i= 1, .., D, αk∼ InverseGamma(αk| 1, 1), k= 1, .., M.
The observed data has D features, each is modeled in the projection matrix by a M−dimensional vector Wi. Each dimension of Wihas its own variance αk. The
LogNormal and InverseGamma prior distributions of σ2 and α = [α
1, . . . , αM]
enforce the constraints that these variances must always be positive.
Finally, the distribution of an observed data point given the corresponding latent variable is given by xn | zn ∼ N (xn | W zn, σ2I
D). The goal is now
to infer the values of the latent variables and all other parameters, which are ensemble denoted as θ = {σ2,α, W , Z}. That can be achieved through
max-imum a posteriori estimation (MAP). Our problem turns into maximizing the log-likelihood of the posterior distribution, which is equivalent to maximizing the log-likelihood of the joint distribution of θ and X:
θM AP = arg max
θ
log p(θ | X) ∝ arg max
θ
log p(θ, X). (2)
Adam optimizer is used to solve this inference problem, e.g., the MAP estimate of the latent variables Z is found by following the partial gradient ∇Zlog p(θ, X) to
its local optima (and the same for other parameters). Our model is implemented with the Edward2 library[11] which offers a wide range of differentiable random variables built on top of TensorFlow’s probability distributions4.
4
4
Evaluation of the User Interaction
In all experiments, the log-likelihood in Eq. 2 is ensured to increase and converge (after 500 epochs with an Adam’s learning rate of 0.2). The inferred variances σ2 and α are strictly ensured to be positive through their priors. In order to visually evaluate the embedding before and after user’s interaction, σ2
fix is set to
10−3 to make sure the fixed points stay at the same position as indicated. In
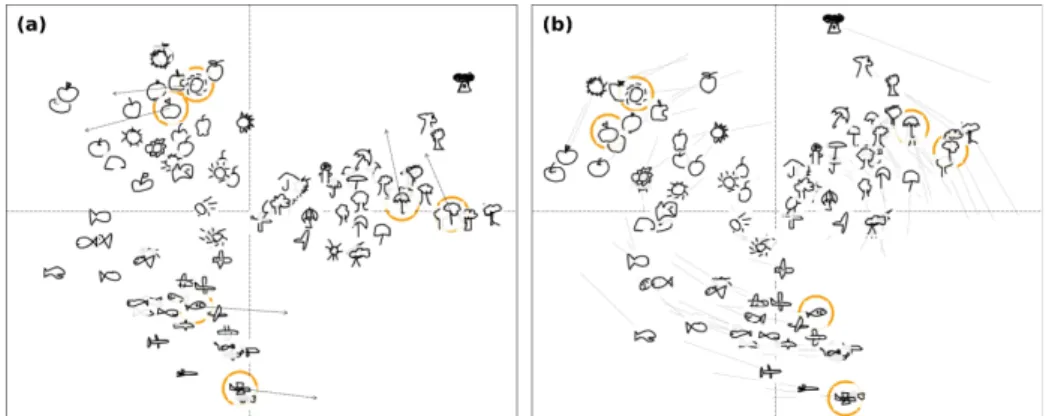
all figures, on the left is the initial embedding of the original PPCA. The moved points are marked by circles and arrows point to their destinations. On the right is the embedding of the proposed model with the interacted points marked at their indicated positions (lines show position changes).
4.1 Rotation of the Whole Visualization and Group Enhancement
Fig. 1: Interaction in QuickDraw dataset shows the rotation and group enhancement.
In the first use case, 90 images of 6 classes (airplane, apple, fish, sun, tree, umbrella) of the QuickDraw5 dataset are randomly picked. Fig. 1 (a) shows
three distinct groups with markers for the interacted points: two horizontal shape images ( , ) are pulled to the right, two vertical shape images ( , ) are pulled to the top and two round shape images ( , ) are pulled to the left. We use the word rotation to demonstrate the phenomenon observed in all our experimentations in which the points moves towards the directions guided by the interacted points, that make the whole visualization looks like being rotated as shown in Fig. 1 (b), Fig. 2 (b) and Fig. 3 (b). Points in the same group have a tendency to move in similar direction, which we call the group enhancement effect. Based on this result, we experiment two additional use cases showing how to construct understandable axes thanks to the moved points.
4.2 Creation of the Interpretable Axes
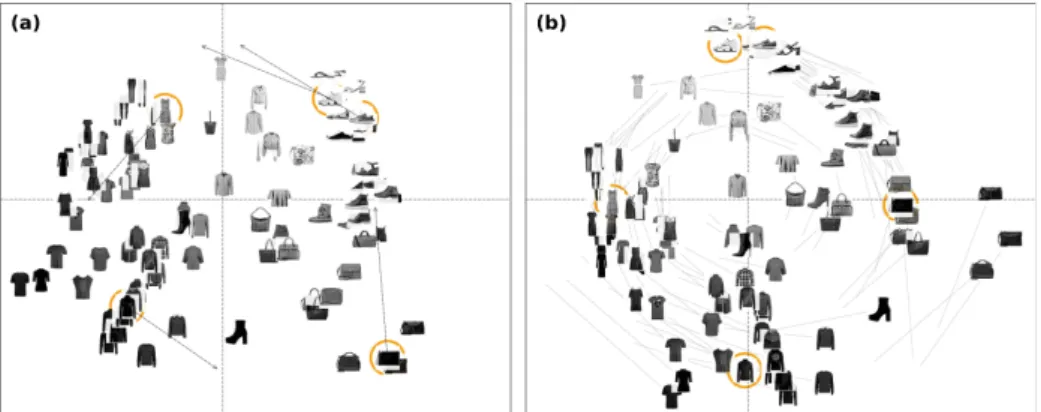
Fig. 2 (a) shows the embedding of 100 images of clothes randomly selected from Fashion dataset6. A long dress is moved down to the left. A black coast is 5
moved to the bottom. A rectangular bag at the bottom-right corner is pulled up. The sandals and the sneakers are pulled up to the left towards the top. As a result of these user-steering constraints, in Fig. 2 (b), the horizontal axis presents shape (with vertical-rectangular shapes on the left and full-rectangular shapes on the right), while the vertical axis presents color density of the clothes (with the lighter color on the top and the darker color on the bottom).
Fig. 2: Interaction in the Fashion dataset to create two axes of shape and color density.
Fig. 3: Interaction in the Automobile dataset to create two axes of car power and size.
Image datasets can be easily visually evaluated as shown above. We go fur-ther with the tabular Automobile dataset7of 203 cars with 26 features visualized
in Fig. 3 (a). The user can move a 2-doors-4-cylinders car (
◦
) to the top-left corner, two 2-doors-6-cylinders cars (△) to the bottom-left corner, a 4-doors-6-cylinders car (N) to the bottom-right corner and two 4-doors-4-4-doors-6-cylinders cars (•
) to top-right corner. In the new embedding shown in Fig. 3 (b), we can ex-plain the two axes induced by the user constraints. The vertical axis represents the car’s power with the more-than-4-cylinders cars above and the less-than-5-cylinders cars below. The horizontal axis represent the size of the car with the small 2-doors cars on the left and the larger 4-doors cars on the right.7
5
Discussion and Conclusion
Our main contribution in this work is to show and evaluate a feasible way to integrate user’s knowledge through prior distributions of the positions of the interacted points into a probabilistic dimensionality reduction model for visual-ization. The user-controlled points are used to rotate the visualization and also can be used as examples to create the understandable axes.
Probabilistic PCA has a drawback called ambiguous-rotation phenomenon for which the visualization can be in any rotation around the origin. A rotation-correction using orthogonal components of the projection matrix is proposed, however the final embedding is not unique [10]. Using user’s interaction to guide the iPPCA model can be considered as a complement to solve the above ambiguousness since the user explicitly defines the axes via the guided points.
The user’s interaction is subjective but the embedding result is explainable, reasonable and reflects well the user’s intention. However our experiment is conducted in supposing that all the user’s feedbacks are sound and coherent, i.e., the indicated positions of the interacted points make sense. In fact this assumption is not realistic, what reveals several shortcomings in our approach and leads us to the following research questions for the future work. First, how many control points can we move freely to obtain a reliable result? Second, what are the feasible zones in which the points can be moved to and how the interactive user intent is modeled [8]? Third, how to quantitatively evaluate the result of iPPCA, e.g., can this be done by using visualization quality metrics, letting the users evaluate the new visualization by ranking, scoring or evaluating the new embedding with downstream tasks like clustering or classification?
References
[1] C. M. Bishop. Bayesian PCA. In Proc. NIPS, pages 382–388, 1999.
[2] C. M. Bishop. Model-based machine learning. Phil. Trans. R. Soc. A, 371, 2013. [3] M. Cavallo and C¸ a˘gatay Demiralp. Exploring dimensionality reductions with forward and
backward projections. In Procs. IDEA KDD Workshop, Aug 2017.
[4] Z. Ghahramani. Probabilistic machine learning and artificial intelligence. Nature, page 452, 2015.
[5] L. House, S. Leman, and C. Han. Bayesian visual analytics: Bava. Statistical Analysis
and Data Mining: The ASA Data Science Journal, 8(1):1–13, 2015.
[6] D. H. Jeong et al. iPCA: An interactive system for pca-based visual analytics. Computer
Graphics Forum, 28(3):767–774, 2009.
[7] H. Kim et al. Interaxis: Steering scatterplot axes via observation-level interaction. IEEE
Transactions on Visualization and Computer Graphics, 22:131–140, 2016.
[8] T. Ruotsalo et al. Interactive intent modeling: Information discovery beyond search.
Commun. ACM, 58(1):86–92, 2014.
[9] D. Sacha et al. Visual interaction with dimensionality reduction: A structured literature analysis. IEEE Transactions on Visualization and Computer Graphics, 23:241–250, 2017. [10] M. E. Tipping and C. M. Bishop. Probabilistic principal component analysis. Journal of
the Royal Statistical Society: Series B (Statistical Methodology), 61(3):611–622, 1999.
[11] D. Tran, M. D. Hoffman, R. A. Saurous, E. Brevdo, K. Murphy, and D. M. Blei. Deep probabilistic programming. International Conference on Learning Representations, 2017. [12] J. Winn and C. M. Bishop. Model-based Machine Learning. 2018. early access.