HAL Id: inserm-00169303
https://www.hal.inserm.fr/inserm-00169303
Submitted on 4 Sep 2007
HAL is a multi-disciplinary open access
archive for the deposit and dissemination of sci-entific research documents, whether they are pub-lished or not. The documents may come from teaching and research institutions in France or abroad, or from public or private research centers.
L’archive ouverte pluridisciplinaire HAL, est destinée au dépôt et à la diffusion de documents scientifiques de niveau recherche, publiés ou non, émanant des établissements d’enseignement et de recherche français ou étrangers, des laboratoires publics ou privés.
Detection of synchronized firings in multivariate neural
spike trains during motor tasks
Jérôme Bourien, Justin Sanchez, Jean-Jacques Bellanger, Fabrice Wendling,
José Principe
To cite this version:
Jérôme Bourien, Justin Sanchez, Jean-Jacques Bellanger, Fabrice Wendling, José Principe. Detection of synchronized firings in multivariate neural spike trains during motor tasks. 29th IEEE EMBS Annual International Conference, Aug 2007, Lyon, France. pp.0. �inserm-00169303�
Abstract— This paper describes and compares two classical methods for the detection of neuron groups which exhibit synchronized firings in multivariate spike trains. These methods were compared on experimental and randomized data corresponding to the firing activity of 104 neurons located in motor, premotor, and parietal cortices in a monkey during movement tasks. Both methods exhibited high false positive rates in randomized data, but results showed that this rate can be advantageously reduced with a simple postprocessing. Otherwise, one method permitted to detect a significant number of synchronized groups of neurons related to the behavioral task.
I. INTRODUCTION
rogress in the design of neural multielectrode recording techniques [1] has increased the need for analysis methods of multivariate neural spike trains of large dimension. The challenges of analyzing data of this type have been reviewed in [2]. In this paper, we compare two methods that are able to extract groups of neurons with synchronized firings. The first one was proposed in 1978 by Gerstein and colleagues [3] and the second was submitted by Grün and collaborators in 1994 [4].The classical way to deal with this problem is to extract groups for which the firing joint probability is higher than the expected firing joint probability when the neurons fire independently but with equal spike rates. In practice, the firing joint/marginal probabilities are estimated using a coincidence window and non-independence condition is dealt with using a statistical test.
Here we present these two methods in a common mathematical framework and to compare detection performances in experimental and randomized data in a Brain-Machine Interface behavioral
Manuscript received April 2, 2007.
J. Bourien, is with: CREFA-Université Montpellier1, 15 avenue Charles Flahault, 34094 Montpellier, Cedex 5 and with the Institute of Neurosciences of Montpellier, INSERM U583, 80 rue Augustin Fliche, 34091 Montpellier, France (phone: 334-6754-8691; fax: 334-6766-8123; e-mail: jerome.bourien@univ-montp1.fr)
J. C. Sanchez is with the Department of Pediatrics, Division of Neurology, University of Florida, P.O. Box 100296, JHMHC, Gainesville, FL 32610 USA (e-mail: jcs77@ufl.edu).
J.J. Belanger and F. Wendling, are with INSERM U642, LTSI, University of Rennes 1, Rennes, France (e-mail: fabrice.wendling@univ-rennes1.fr).
J. C. Principe is with the Department of Electrical and Computer Engineering, University of Florida, Gainesville, FL 32611 USA (e-mail: principe@cnel.ufl.edu).
II. METHODS PRESENTATION
A. Multivariate spike train
A multivariate spike train of duration T may be represented by a multivariate signal ( )S t , t∈
[ ]
0,T :1 1, 1 , 1 , 1 ( ) ... ( ) ( ) ... ( ) i N n k k n i k k n N k k t S t t t δ τ δ τ δ τ = = = − = − −
∑
∑
∑
with ( ) 1 0 0 0 t t t δ = = ≠ if ifwhere n and i
{
τi,1,...,τi n,i}
for i=1,...,N denoterespectively the count and the time occurrences of neuronal firings in the ith neuron on the N observed neurons.
One classical way to randomize a multivariate spike train is to perform a random permutation of the interspike intervals in each spike train. This procedure is called data shuffling [5]. On the one hand, it guarantees that the ith
randomized and original spike trains have identical duration, spike counts, and interspike interval histograms. On the other hand, synchronized firings are broken in the randomized multivariate spike train.
B. Processing of a multivariate spike train
The two analysis methods are not directly applied to multivariate spike trains but on a binary matrix derived from these spike trains. The time axis
[ ]
0,T is segmented into M adjacent coincidence time windows of duration D (M =T D/ ). Spikes from the same train that occurred into the same time window are grouped and transformed into a binary value equal to 1 if one or more spike(s) occurred during D and 0 otherwise. This transformation known as binning operation yields to a binary matrix B with N rows and M columns.For statistical analysis of coincidences, we considered that the column vectors of matrix B correspond to M independent realizations of a binary random vector
[
1,...,]
, {0,1}t
N i
X = x x x ∈ (the t exponent denotes the
transpose operator). Then, the problem of extracting a group of co-activated neurons labeled by indices
1
{ ,...,w wn} {1,..., }⊂ N , is equivalent to the problem of finding a group of coordinates in X conjointly equal to 1 (i.e.
1
{xw =1,...,xwn =1}) with an occurrence in B significantly
Detection of synchronized firings in multivariate neural spike trains
during motor tasks
J. Bourien, J. C. Sanchez, Member, J. J. Bellanger, F. Wendling and J. C. Principe, Fellow
P
Proceedings of the 29th Annual International Conference of the IEEE EMBS
Cité Internationale, Lyon, France August 23-26, 2007.
higher than the expected occurrence when neurons fired in a independent way but with equal rates.
Two methodological approaches were proposed to solve the aforementioned problem. The first approach consists in searching groups of coordinates in X conjointly equal to 1 independently of the values of the other coordinates (i.e. non-exclusive activation of the considered group). The second approach is aimed at extracting groups of coordinates in X conjointly equal to 1 with all other coordinate values being equal to zero (i.e. exclusive activation of the considered group). In the following of the paper, the non-exclusive (resp. non-exclusive) occurrence of a neuron group
1 { ,...,w w will be referred as n} ({ ,...,1 }) NE n n w w (resp. 1 ({ ,..., }) E n n w w ).
Gerstein and colleagues proposed an implementation of
the first approach (see [3] for details) in order to detect and identify “functional groups of neurons” in multivariate spike train. The iterative algorithm rejects independent groups of neurons using a χ test (see Table I for details). 2
An implementation of the second approach, called Unitary Event analysis, was proposed in 1994 [4] (see [6] for implementation details) in order to detect episodes of synchronized neural activity in multivariate spike trains. This algorithm compares the observed occurrence
1
({ ,..., })
E
n
n w w and the expected occurrence
exp({ ,...,1 })
E
n
n w w when the neurons fire independently but with the same rates. The deviation is evaluated with the
joint-surprise function S( ) logΨ = 1− Ψ
Ψ with 1 exp 1 ( ({ ,...,E } | E ({ ,..., }) n n n w w n w w Ψ = exp 1 1 ({ ,..., }) exp 1 ({ ,..., }) ( ({ ,..., })) ! E n E n E k n w w n k n w w n w w e k +∞ − =
∑
With this transformation: ( ) 0 S Ψ > if E({ ,...,1 }) expE ({ ,...,1 }) n n n w w >n w w , ( ) 0 S Ψ ≈ if nE({ ,...,w1 wn})≈nexpE ({ ,...,w1 wn}), and ( ) 0 S Ψ < if E({ ,...,1 }) expE ({ ,...,1 }) n n n w w <n w w .
Then, a group of co-activated neurons { ,...,w1 w is n} detected if ( )S Ψ ≥Sβ where Sβ depends of the given confident probability β (for example Sβ = for 2
99%
β = ).
These two methods will be referred respectively as Functional Groups Detection Method (FGDM) and Unitary Event Detection Method (UEDM) in the following of the paper. Methods are both controlled by two identical
parameters: the coincidence window size D and the confident probability β .
III. DATA
A. Synthetic data
The Fig. 1-A shows a synthetic multivariate spike train introduced to benchmark the methods presented here. The simulated data exhibits synchronized (see black dots) and independent firings (see crosses) between five artificial neurons during an epoch of 2.1 s.
B. In Vivo Data
Simultaneously recorded spike trains (N=104 neurons from the motor, premotor, and parietal cortices) were TABLEI
TWO-WAY CONTINGENCY TABLE
Activation of neuron group 1 { ,...,w w n} Not activation of neuron group 1 { ,...,w w n} Activation of neuron { }j a b a b+ Not-activation of neuron { }j c d c d+ a c+ b d+ M With { } {1,..., } { ,...,j∈ N −w1 wn}, ({ ,...,1 , }) NE n a n= w w j , ({ })b n= NE j −a, 1 ({ ,..., }) NE n c n= w w −a, and d=M a b c− − − .
The M columns of matrix B can be partitioned in the above two-way contingency table. If the activation of the neuron group { ,..., }w1 w is n independent of the activation of the neuron { }j , the indicator
2 ( ) ( )( )( )( ) M ad cb I a b a c c d b d × =
+ + + + may be assumed to have a
2
χ
distribution with one DF for M>40. In this way, a co-activated group of neurons { ,..., }w1 wn is detected if I≥Iβ where Iβ depends of the given confident probability β (for example Iβ=6.635 for β=99%).
Fig. 1. Binning of a synthetic multivariate spike train. A-. Synchronized firings were introduced between neuron couples {1,2} and {4,5} with dithered regular spike trains of 10 spikes/s. The dither was such that the maximum interval-interspike duration between two synchronized firings can not exceed 6 ms whatever the synchronized group. The synchronized times between neurons 1-2 and 4-5 were in phase opposition in order to avoid overlapping. Additional independent firings were simulated using a Poisson process of 5 spikes/s in each spike train. B- A binning transformation was applied to the multivariate spike train for D =10 ms. This transformation yielded to a binary matrix B with 5 rows and 210 columns.
collected in an owl monkey during a brain-machine interface experiment at Duke University, as described in [7]. Behaviorally, the monkey performed a motor task in which it was cued to reach food from a stationary position. The movement was repeated 72 times. The position of the hand was recorded in time synchronized with the neuronal data. The duration of each task was random but the movement sequence was the same: 1) the monkey’s hand was at rest, 2) it reached for food, 3), food was carried to the mouth, and finally 4) the hand returned to the rest position. We manually segmented the neuronal recordings using the 3-D hand trajectories into only two behavioral states: hand at rest (i.e. preparation of movement) and hand moving (i.e. execution of movement). Time segments corresponding to repeated movement execution were concatenated and used for data analysis. The cumulative duration of execution of movement was equal to 60.303 s. In this way, we obtained a multivariate spike train composed of 104 single spike trains of duration 60.303 s.
C. Randomized In Vivo Data
Randomized experimental data were generated using the
randomization procedure described in section II-A. Shuffled simulated data were composed of 104 independent spike trains with a duration of 60.303 s. In order to estimate the distribution of the number of extracted groups as a function of parameter D, a series of simulated data sets was generated by the repetition of this randomization procedure (100 times).
IV. RESULTS
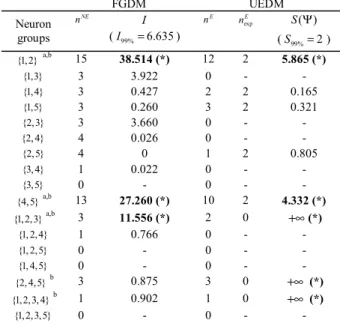
The Table II shows the list of detected groups for D =10 ms and β =99% in the synthetic multivariate presented in section III-A. The FGDM detected three groups (2 true positives + 1 false positive) whereas the UEDM extracted five groups (two true positives + 3 false positives). One way to select only the true positives among detected groups, is to select groups whose the occurrence is higher than a minimum occurrence nmin∈{1, 2,...}. For example, and for
D=10 ms, β =99%, and n =4, the two methods extract min
only the two true positives.
The two methods were applied on experimental data and TABLEII
GROUPS DETECTION IN A SYNTHETIC MULTIVARIATE SPIKE TRAIN
FGDM UEDM Neuron groups NE n I (I99%=6.635) E n nexpE S( )Ψ (S99%= ) 2 {1,2}a,b 15 38.514 (*) 12 2 5.865 (*) {1,3} 3 3.922 0 - - {1,4} 3 0.427 2 2 0.165 {1,5} 3 0.260 3 2 0.321 {2,3} 3 3.660 0 - - {2, 4} 4 0.026 0 - - {2,5} 4 0 1 2 0.805 {3, 4} 1 0.022 0 - - {3,5} 0 - 0 - - {4,5} a,b 13 27.260 (*) 10 2 4.332 (*) {1,2,3} a,b 3 11.556 (*) 2 0 +∞(*) {1, 2,4} 1 0.766 0 - - {1, 2,5} 0 - 0 - - {1, 4,5} 0 - 0 - - {2, 4,5} b 3 0.875 3 0 +∞ (*) {1,2,3, 4} b 1 0.902 1 0 +∞ (*) {1,2,3,5} 0 - 0 - - Iterative progress of FGDM: At the first iteration, the non-exclusive occurrences of the ten pairs of neurons are estimated in the [5 210]× matrix B defined in Fig. 1. The pairs {1,2} and {4,5} which exhibited indicators I higher to the threshold I99% were kept. At the second
iteration, the algorithm built 6 triplets and selected the triplet {1,2,3} . At the third iteration, two quadruplets were built but neither was selected consequently the algorithm stopped its progress.
Progress of UEDM: The algorithm determined the set of distinct columns in B with a least 2 active coordinates and occurring at least one time. Algorithm found a set of 8 columns occurrences varying from 1 to 12. Corresponding expected occurrences and joint-surprise values were then computed. Five groups exhibited joint-surprise values higher than the threshold S99%. Note that for a given group: nNE≥nE. agroup detected
using FGDM, bgroup detected using UEDM, (*) detected group.
Fig. 2. Number of detected groups in experimental and randomized data. Detection results with FGDM and UEDM are respectively showed in left and right part and each row corresponds to a particular
min
n value. For each method and for each D value, the detection was processed 1 time on experimental data and 1 time on each one of the 100 randomized data. The number of detected groups is then showed as diamond for experimental data and the distribution of detected groups in randomized data is show with an error bar (lower and upper borders correspond respectively to the min. and max. observed values and the dot corresponds to the median value).
randomized experimental data for fifteen values of the coincidence window D=1,2,…,15 ms, five values of the minimum occurrence n =1,5,10,15,20, and for a same min
confident probability β =99%. For each method, each D value, and each n value, we superimposed the number of min
detected groups in experimental data (see diamond in Fig. 2) and the distribution of the number of extracted groups in the randomized experimental data (see error bars in Fig. 2).
Left and right plots of Fig. 2-A obtained for nmin = show 1
the three following results. First, the number of extracted groups in randomized experimental data (i.e. false positive) is high whatever the method. For example, the number of false positives for D =15 ms in limited to 600 with FGDM and limited to 3000 for UEDM. Second, the number of detected groups increased when the D value increased especially for UEDM. Third, for D > 4 ms, the number of detected groups in experimental data is clearly higher than the number of groups detected in randomized experimental data with the functional group detection method whereas these numbers are similar with unitary event detection method.
When n increased, results presented in Fig. 2 B-E min
confirmed the preceding third point. Indeed, in the one hand, with functional group detection method and for D > 4 ms, the number of detected groups in experimental data was significantly higher that the numbers of extracted groups in randomized experimental data. On the other hand, with unitary event detection method, the number of extracted groups in experimental and in randomized data was similar. In addition, the number of detected groups decreased strongly both in experimental and randomized experimental data when n increased. For min n =5 in the case of EUDM min
and n =10 in the case of FGDM, the mean number of false min
positives detection in randomized data was lower than 10. V. DISCUSSION
In this paper, we presented two standard methods ([3] and [4]) able to detect groups of neurons with synchronized firings in multivariate spike trains. For the first time, these methods were described in a same formal language. We consider that this description is interesting for the community because it gives a framework for a rapid implementation of the two approaches (especially for Gerstein’s approach which was forgotten by the community). In addition, this presentation showed that these methods use the same parameters: a coincidence window value and a confident probability. This property permitted us to objectively compare these methods on experimental and randomized experimental data.
The detection results in synthetic and randomized experimental data show that the two methods detect a large number of false positives characterized by low occurrence. This observation confirms previous studies [8] which showed that this class of methods detects groups highly
significant in a statistical view point but which appear only one or two time in the B matrix. In this paper, we show at the application of a minimum occurrence threshold on detected neurons groups decreased advantageously the false positive rate.
The comparison between the numbers of detected neurons groups in experimental and in randomized experimental data with the functional group detection method exhibited a significant excess of detected groups in experimental data whereas this result was not confirmed with unitary event detection method. This result revealed the two following findings. First, the functional group detection method, which works with non-exclusive activations, seems more sensitive in large multivariate spike train that unitary event detection method which works with exclusive activations. Second, the excess of co-activated groups observed in experimental data with functional group detection method has to be correlated with the behavior of the owl monkey. This interesting finding indicates that the hand movement of the owl monkey generates firing synchronizations between neurons distributed among motor, premotor, and parietal cortices. This second point has to be investigated in details in future works.
ACKNOWLEDGMENT
The multielectrode recordings utilized in this paper were collected in the Center for NeuroEngineering at Duke University. The authors extend their gratitude to the Center Director, Dr. Miguel Nicolelis, and Johan Wessberg for sharing the data and for valuable discussions. This work was partially supported by DARPA project # N66001-02-C-8022.
VI. REFERENCES
[1] M. A. Nicolelis and S. Ribeiro, "Multielectrode recordings: the next steps," Curr Opin Neurobiol, vol. 12, pp. 602-6, 2002.
[2] E. N. Brown, R. E. Kass, and P. P. Mitra, "Multiple neural spike train data analysis: state-of-the-art and future challenges," Nature
Neuroscience, vol. 7, pp. 456-61, 2004.
[3] G. L. Gerstein, D. H. Perkel, and K. N. Subramanian, "Identification of functionally related neural assemblies," Brain Res, vol. 140, pp. 43-62, 1978.
[4] S. Grun, A. Aertsen, M. Abeles, G. L. Gerstein, and G. Palm, "Behavior-related neuron group activity in the cortex.," presented at Proc. 17th Ann. Meeting European Neurosci. Assoc., 1994.
[5] D. H. Perkel, G. L. Gerstein, and G. P. Moore, "Neuronal spike trains and stochastic point processes. I. The single spike train," Biophys J, vol. 7, pp. 391-417, 1967.
[6] S. Grun, M. Diesmann, and A. Aertsen, "Unitary events in multiple single-neuron spiking activity: I. Detection and significance," Neural
Comput, vol. 14, pp. 43-80, 2002.
[7] J. Wessberg, C. R. Stambaugh, J. D. Kralik, P. D. Beck, M. Laubach, J. K. Chapin, J. Kim, S. J. Biggs, M. A. Srinivasan, and M. A. Nicolelis, "Real-time prediction of hand trajectory by ensembles of cortical neurons in primates," Nature, vol. 408, pp. 361-5, 2000.
[8] A. Roy, P. N. Steinmetz, and E. Niebur, "Rate limitations of unitary event analysis," Neural Comput, vol. 12, pp. 2063-82, 2000.