Publisher’s version / Version de l'éditeur:
Energy & Fuels, 22, July 5, pp. 3174-3193, 2008
READ THESE TERMS AND CONDITIONS CAREFULLY BEFORE USING THIS WEBSITE. https://nrc-publications.canada.ca/eng/copyright
Vous avez des questions? Nous pouvons vous aider. Pour communiquer directement avec un auteur, consultez la première page de la revue dans laquelle son article a été publié afin de trouver ses coordonnées. Si vous n’arrivez pas à les repérer, communiquez avec nous à PublicationsArchive-ArchivesPublications@nrc-cnrc.gc.ca.
Questions? Contact the NRC Publications Archive team at
PublicationsArchive-ArchivesPublications@nrc-cnrc.gc.ca. If you wish to email the authors directly, please see the first page of the publication for their contact information.
NRC Publications Archive
Archives des publications du CNRC
This publication could be one of several versions: author’s original, accepted manuscript or the publisher’s version. / La version de cette publication peut être l’une des suivantes : la version prépublication de l’auteur, la version acceptée du manuscrit ou la version de l’éditeur.
For the publisher’s version, please access the DOI link below./ Pour consulter la version de l’éditeur, utilisez le lien DOI ci-dessous.
https://doi.org/10.1021/ef8002203
Access and use of this website and the material on it are subject to the Terms and Conditions set forth at
X-ray diffraction (XRD)-derived processability markers for oil sands
based on clay mineralogy and crystallite thickness distributions
Mercier, Patrick; Patarachao, Bussaraporn; Kung, Judy; Kingston, David;
Woods, John; Sparks, B. D.; Kotlyar, Luba; Ng, S.; Moran, K.; McCracken,
Thomas
https://publications-cnrc.canada.ca/fra/droits
L’accès à ce site Web et l’utilisation de son contenu sont assujettis aux conditions présentées dans le site LISEZ CES CONDITIONS ATTENTIVEMENT AVANT D’UTILISER CE SITE WEB.
NRC Publications Record / Notice d'Archives des publications de CNRC:
https://nrc-publications.canada.ca/eng/view/object/?id=38353b35-581f-4917-accb-92a90bc55912 https://publications-cnrc.canada.ca/fra/voir/objet/?id=38353b35-581f-4917-accb-92a90bc55912Subscriber access provided by CANADA INSTITUTE FOR STI
Energy & Fuels is published by the American Chemical Society. 1155 Sixteenth Street N.W., Washington, DC 20036
Article
X-ray Diffraction (XRD)-Derived Processability Markers for Oil Sands
Based on Clay Mineralogy and Crystallite Thickness Distributions
P. H. J. Mercier, B. Patarachao, J. Kung, D. M. Kingston, J. R. Woods,
B. D. Sparks, L. S. Kotlyar, S. Ng, K. Moran, and T. McCracken
Energy Fuels, 2008, 22 (5), 3174-3193• DOI: 10.1021/ef8002203 • Publication Date (Web): 29 July 2008 Downloaded from http://pubs.acs.org on May 1, 2009
More About This Article
Additional resources and features associated with this article are available within the HTML version:
• Supporting Information
• Links to the 1 articles that cite this article, as of the time of this article download • Access to high resolution figures
• Links to articles and content related to this article
X-ray Diffraction (XRD)-Derived Processability Markers for Oil
Sands Based on Clay Mineralogy and Crystallite Thickness
Distributions
P. H. J. Mercier,*
,†B. Patarachao,
†J. Kung,
†D. M. Kingston,
†J. R. Woods,
†B. D. Sparks,
‡L. S. Kotlyar,
†S. Ng,
§K. Moran,
§and T. McCracken
†Institute for Chemical Process and EnVironmental Technology, National Research Council Canada, 1200 Montreal Road, Ottawa, Ontario K1A 0R6, Canada, V. Bede Technical Associates, 614 LaVerendrye
DriVe, Ottawa, Ontario K1J 7C4, Canada, and Syncrude Canada Ltd., Edmonton Research Centre, 9421-17 AVenue, Edmonton, Alberta T6N 1H4, Canada
ReceiVed March 28, 2008. ReVised Manuscript ReceiVed June 13, 2008
An X-ray diffraction (XRD) methodology has been developed for characterizing clays in unextracted oil sands. Application of the new technique to five estuarine and five marine ores directly identified three clay mineral properties that may impact bitumen recovery: (1) The specific surface area of illite was significantly greater for four oil sand ores identified as problematic in batch extraction unit tests. (2) The correlation of illite/kaolinite XRD peak area ratios with bitumen recovery produced a processability classification similar to that proposed in earlier work. (3) Significant amounts of chlorite, as measured by XRD, were observed only in marine oil sands; this may provide a means to distinguish marine from estuarine ores. A combination of XRD analysis on separated clays and laser diffraction determination of clay contents provided a quantitative estimate for the illite and kaolinite contents of the oil sands. Also, the contribution from ultrathin illite and kaolinite for each oil sand (i.e., the mass fractions of illite and kaolinite with crystallite thicknesses of 1-3 composite layers) was determined. This methodology thus provides a direct method for the determination of the ultrafines content in unextracted oil sands and obviates the necessity for the time-consuming wet chemistry technique for separation of this component. For the 10 oil sands analyzed here, ultrathin crystallites occurred almost entirely in the illite clay fraction. The amount of ultrathin illite was critical and closely matched the ultrafines concentration required to cause sludging (gelation) in the primary separation vessel, with concomitant loss of bitumen recovery during extraction.
1. Introduction
As more information on processability parameters has become available, the importance of the clay component in oil sand ore has become apparent. Recent investigations have suggested that the presence of illite and kaolinite with high surface areas caused by smectitic interstratifications1–3or degraded illite4may have
important negative consequences on oil sand bitumen extract-ability. Consequently, new methods are needed to allow for a detailed assessment of clay mineralogy. This knowledge would support the development of technical strategies for solving processing problems related to the presence of clays.
In recent publications,5,6we demonstrated that overall bitumen
recoveries for two series of well-characterized oil sands (five marine and five estuarine) were much better correlated with clay content than either ore grade or fines content. Bitumen recovery declined with increasing clay content for each oil sands series, but there was a marked breakpoint between marine and estuarine ores. This observation implies that either the clay content itself is a critical factor or there is a mineralogy-related difference between the clay fractions arising from estuarine and marine oil sands.
Building upon these findings, we have further developed a novel X-ray diffraction (XRD) analysis methodology to char-acterize the phyllosilicate clays in unextracted oil sands. This new method for analyzing such ore yields a quantitative mineralogical assessment in terms of clay mineral ratios and information related to particle size distribution (PSD); two characteristics previously suggested to be key factors in bitumen recovery.7–10(In the present paper, the term “clay mineral ratios”
* To whom correspondence should be addressed. Telephone: (613) 993-7752. E-mail: patrick.mercier@nrc-cnrc.gc.ca.
†National Research Council Canada. ‡V. Bede Technical Associates. §Syncrude Canada Ltd.
(1) Omotoso, O. E.; Mikula, R. J.; Urquhart, S.; Sulimma, H.; Stephens, P. W. Clay Sci. 2006, 12, 88–93 (Characterization of Clays, Proceedings of the 13th International Clay Conference).
(2) Omotoso, O. E.; Mikula, R. J. Appl. Clay Sci. 2004, 25, 37–47.
(3) Omotoso, O. E.; Mikula, R. J.; Stephens, P. W. AdV. X-ray Anal.
2002, 45, 391–396.
(4) Wallace, D.; Tipman, R.; Komishke, B.; Wallwork, V.; Perkins, E.
Can. J. Chem. Eng. 2004, 82, 667–677.
(5) Ng, S.; Smith, T.; Moran, K.; Sparks, B. D.; Mercier, P. H. J.; Kung, J.; Woods, J. R.; Kingston, D. M.; Kotlyar, L. S.; Tu, Y.; McCracken, T. Assessment of markers for oil sands processability: Efficacy of ore grade and fines content for recovery predictions. Manuscript submitted to Chem.
Eng. Sci.
(6) Sparks, B. D.; Mercier, P. H. J.; Ng, S.; Smith, T.; Moran, K.; Kung, J.; Woods, J. R.; Kingston, D. M.; Kotlyar, L. S.; Tu, Y.; McCracken, T. Assessment of clay contents and clay-to-fine ratios as markers for oil sands processability. Manuscript submitted to AIChE J.
(7) Kotlyar, L. S.; Sparks, B. D.; Schutte, R. Clays Clay Miner. 1996,
44, 121–131.
(8) Kotlyar, L. S.; Sparks, B. D.; Le Page, Y.; Woods, J. R. Clays Clay
Miner. 1998, 33, 103–107.
(9) O’Carroll, J. B. Factors affecting bitumen recovery from oilsands. M.Sc. Thesis, University of Ottawa, Ottawa, Ontario, 2000.
Energy & Fuels 2008, 22,3174–3193
3174
10.1021/ef8002203 CCC: $40.75 2008 American Chemical Society Published on Web 07/29/2008
refers to the relative proportions of distinct phyllosilicate mineral species present in a given sample. For example, the most
common phyllosilicate mineral species observed in oil sands are illite and kaolinite.) Because phyllosilicates are, by and large, the main mineral component of the clay fraction, more knowledge concerning their mineralogy and size distribution
(10) Wik, S.; Sparks, B. D.; Ng, S.; Tu, Y.; Li, Z.; Chung, K. H.; Kotlyar, L. S. Fuel 2008, 87, 1394–1412.
Figure 1.Bertaut analysis of XRD peak profile: (a) measured peak profile, (b) Lorentz-polarization-corrected, reciprocal-space-converted diffractogram, (c) Bertaut’s h(m) function resulting for the Fourier transform of the converted diffractogram in b, (d) construction of mass versus crystallite thickness distribution Q(q) as a function of q from the function h(m) in c.
Figure 2.Crystal structures for phyllosilicate minerals: (a) kaolinite, (b) illite, and (c) chlorite.
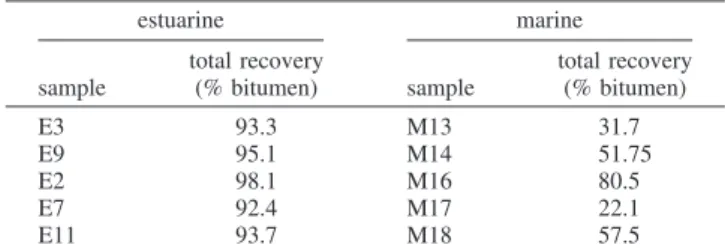
Table 1. Set of BEU Results5Used To Correlate with Properties
Measured for the Oil Sand Clay Minerals
estuarine marine sample total recovery (% bitumen) sample total recovery (% bitumen) E3 93.3 M13 31.7 E9 95.1 M14 51.75 E2 98.1 M16 80.5 E7 92.4 M17 22.1 E11 93.7 M18 57.5
prior to processing is of great importance with respect to links to sludging,9bitumen droplet size,10and fine tailings formation.11,12
Previously, our characterization of clays in oil sands has relied on existing expertise to separate clay (<3µm size) and ultrafine (<0.3µm size) material using a time-consuming wet chemistry technique.7,8,11Recently, we have used XRD in a novel way to
extract quantitative mass and area versus crystallite thickness distributions and resulting specific areas for each individual phyllosilicate-mineral component in separated size fractions from oil sands.13 Here, this methodology has been
comple-mented with XRD-based quantitative phase analysis to develop a technique to characterize phyllosilicate clays present in unextractedoil sands. This advancement significantly reduces the effort required to characterize the clay components present in oil sand ores. The quantitative clay mineralogy and PSD-related information obtained from unextracted samples was compared to measurements on the corresponding fines (<44 µm size) and clay fractions separated from the corresponding bitumen-free solids.
2. Experimental Section
2.1. Oil Sand Samples.The 10 oil sands from previous work5,6
are used as the basis for the additional results presented here. These
generic samples comprise a wide mix of oil sand grades, repre-sentative of both estuarine (samples E3, E9, E2, E7, and E11) and marine (samples M13, M14, M16, M17, and M18) depositional environments.
2.2. Separation of Fines and Clay Fractions.Samples were extracted using the standard Soxhlet-Dean and Stark extraction method with toluene as the solvent.14After drying, a known weight
of solids from each bitumen-free sample was dispersed in sodium pyrophosphate solution (0.1% w/w) and screened through standard sieves to separate the fines (325 mesh or <44µm size) fractions. The resulting fines fractions were dried at 100°C overnight, cooled, and weighed.
The clay fractions were separated by dispersion of a known weight of extracted, bitumen-free solids in sodium pyrophosphate solution (0.1% w/w), followed by centrifugation for 45-80 s at 1000-2000 rpm. The centrifugation conditions were adjusted by trial and error for each sample, so that the resulting particle sizes of clay fractions were always 95-100% smaller than 3 µm, as measured by laser diffraction size analysis. Clay separation was attempted on all 10 samples, with 9 being successfully completed. Sample E11 did not contain enough clay-sized material to allow for a measurable amount of this fraction to be separated.
2.3. Powder XRD Measurement and Data Analysis. XRD powder patterns were collected using a Bruker AXS D8 Advance systemθ-θ powder diffractometer (Bragg-Brentano geometry), equipped with a Cu tube and a Vantec position-sensitive detector with radial Soller slits to reduce the background at low angles. A divergence slit of 0.2°was used for all experiments to avoid beam
(11) Kotlyar, L. S.; Sparks, B. D.; Capes, C. E. AOSTRA J. Res. 1992,
8, 55–61.
(12) Ripmeester, J. A.; Kotlyar, L. S.; Sparks, B. D. Colloids Surf., A
1993, 78, 57–63.
(13) Mercier, P. H. J.; Le Page, Y.; Tu, Y.; Kotlyar, L. S. Pet. Sci.
Technol. 2008, 26, 307–321.
(14) Bulmer, J. T.; Starr, J. Syncrude Analytical Procedures for Oilsands
and Bitumen Processing; Alberta Oil Sands Technology and Research
Authority: Alberta, Canada, 1974.
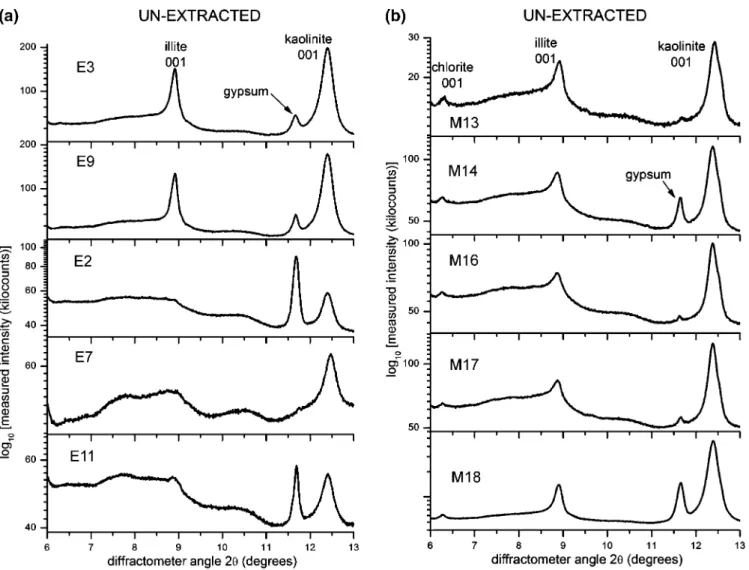
Figure 3.XRD patterns measured for (a) estuarine and (b) marine unextracted oil sands.
overspill at low angles. The diffractograms were collected between 5 and 22°2θ, with a step of 0.0071 or 0.0142°2θ using an effective counting time of 15 s per step for unextracted oil sands and 3 s per step for the fines and clay fractions. The unextracted oil sands were mounted in a flat-surfaced, semi-infinite filled trough machined into a plastic sample holder. Unextracted oil sands were deposited into the trough and gently pressed flat using a glass slide. The fines and clay samples were mounted as acetone smears on single-crystal, silicon wafer, low-background holders. The thickness of the sample material deposited using smears was more than about 0.2-0.5 mm to ensure infinitely thick specimens.
To extract clay mineral mass and area versus crystallite thickness distributions (see section 2.4 below) from the XRD measurements, it was necessary to collect diffraction patterns with very high measured intensities to maximize the signal-to-noise ratio. More precise crystallite thickness distributions can be extracted from the XRD measurements at higher collected intensities. In practice, to obtain precise and robust, reliable crystallite thickness distributions with our powder diffractometer, we found that the intensities of the peak to be analyzed needed to be at least 10 000-20 000 counts above the background line.
2.3.1. Bertaut Analysis of XRD Profiles. The data analysis required to extract clay mineral crystallite thickness distributions involves a numerical Fourier transform of the measured XRD data. This procedure is known as the Bertaut15,16 analysis of
powder-diffraction peak profiles (Figure 1). Bertaut defines h(m) as the scaled Fourier transform of a measured powder-diffraction peak profile (Figure 1a) transformed to reciprocal units and with the
origin at the center of the peak (Figure 1b). The scaling simply ensures that h(0) ) 100 (Figure 1c). Bertaut shows that h(m) relates the relative diffracting mass h and the extension m of crystallites projected onto the diffraction vector. More precisely, h(m) is the percent mass of the crystal volume with the X-ray path longer than a depth m within the crystallite. When applied to 00l reflections from phyllosilicate clays from oil sands,13Bertaut’s h(m) function
is particularly simple to interpret and straightforward to implement. Because phyllosilicate minerals (Figure 2) have relatively easy cleavage planes between their composite layers, the thickness of an individual phyllosilicate-mineral crystallite can only be integer multiples q of that composite-layer building block of thickness t. The projection of crystallites onto the diffraction vector is then the thickness qt of such crystallites. In other words, the only values that Bertaut’s m variable can take are these qt thicknesses.
2.3.2. DeriVation of Mass Versus Crystallite Thickness Distribu-tion. The derivation of clay mineral (phyllosilicate) mass versus crystallite thickness distribution is accomplished as follows (Figure 1d). According to Bertaut’s explanation, the function h(qt) is the mass percentage of crystallites with thicknesses greater than qt. It follows that, in the case of phyllosilicate clays, the quantity Q(q) ) h([q - 1]t) - h(qt) is the mass percentage of crystallite made of exactly q composite layers. The mass versus crystallite thickness distribution for a given phyllosilicate mineral is then simply a plot of the quantity Q(q) as a function of q.
2.3.3. DeriVation of Area Versus Crystallite Thickness Distribu-tion.To a first approximation, the derivation of clay mineral area versus crystallite thickness distribution is straightforward because the specific surface area of phyllosilicate crystallites results mainly from their lateral area in the plane perpendicular to the direction
(15) Bertaut, E. F. C. R. Acad. Sci. Paris 1949, 228, 492–494.
(16) Bertaut, E. F. Acta Crystallogr. 1950, 3, 14–18.
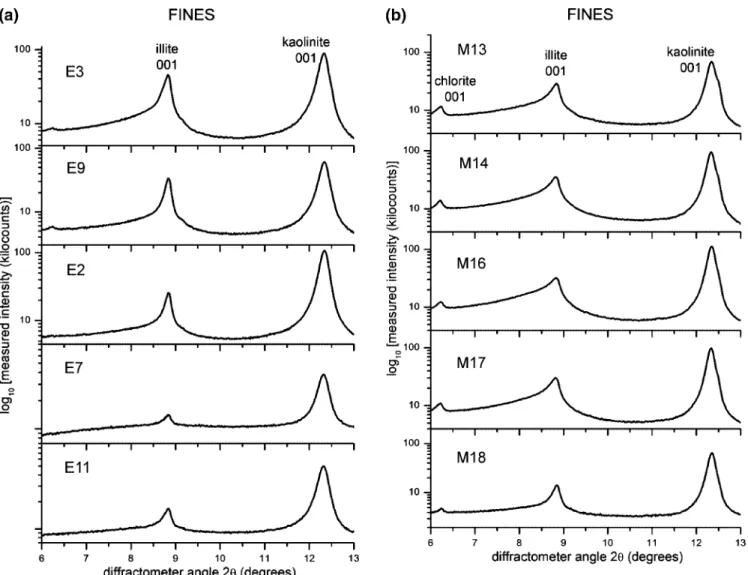
Figure 4.XRD patterns measured for (a) estuarine and (b) marine fines (<44µm) fractions.
of stacking of the composite layers (Figure 2). The mass of an individual crystallite is the product of its lateral area by the thickness
qtand the density F of the material. Because the mass versus q distribution Q(q) is known, it follows that the specific surface area
A(q) per unit weight of individual crystallite with a thickness of q composite layers is proportional to Q(q)/q, i.e., A(q) ∼ Q(q)/q. The proportionality constant to be applied can be derived from A(1), the specific surface area per unit weight of a single composite layer of phyllosilicate mineral with known molecular weight. Values of
A(1) for individual phyllosilicate minerals can be calculated from experimental crystallographic data available in the literature. We assumed here A(1) values of 712 and 1073 m2/g per unit weight
for illite and kaolinite, respectively.13The area versus crystallite
thickness distribution for a given phyllosilicate mineral is then obtained from a plot of the quantity A(q) as a function of q, where
A(q) ) A(1)Q(q)/q.
2.3.4. XRD-DeriVed Specific Surface Area. Extraction of the
specific surface area (SSA) per unit weight of an individual phyllosilicate-mineral component i, SSAi, is obtained from the
equation: SSAi)ΣqA(q)/ΣqQ(q). This result is valid even in the
presence of other mineral phase constituents in the powder pattern, as long as their corresponding XRD peaks do not interfere with the clay mineral 00l reflection being analyzed.
2.3.5. Clay Mineral Ratios.The evolution of clay mineral ratios was assessed as follows. The measured XRD diffractograms (powder patterns) were first converted by multiplication of the measured intensities (y-axis variable) by the Lorentz-polarization correction factor17applicable for our powder-diffractometer type
and then transformation of the diffractometer 2θ angles (x-axis variable) to reciprocal lengths R via the relationship R ) sin(θ)/λ, whereλ is the wavelength of Cu X-ray radiation being used. In
the resulting converted diffractograms, we then evaluated the integrated peak area of the 001 reflection observed for each of the clay minerals detected in our samples (illite, kaolinite, and chlorite; see section 3.1 below). The evaluation of clay mineral ratios between integrated XRD peak areas thus obtained then provided a way to assess the evolution of clay mineral ratios among the samples.
2.3.6. Quantification of Illite and Kaolinite Amounts in Clay Fractions. The weight fractions of kaolinite (Xkaolinite) and illite
(Xillite) in the <3µm size clay fractions were estimated on the basis
of the reference intensity ratio (RIR) method18,19using the following
equations:
Xkaolinite) Ikao001/RIRkao001,corundumS (1a) Xillite) Iill001/RIRill001,corundumS (1b)
where
S ) [Ikao001/RIRkao001,corundum+ Iill001/RIRill001,corundum+
Iqtz100/RIRqtz001,corundum]-1 (1c) In the above equations, the various symbols refer to the following quantities obtained directly from measured XRD powder patterns: (1) Ikao001, Iill001, and Iqtz100are the integrated intensities of kaolinite
001, illite 001, and quartz 100 reflections observed on the XRD
(17) International Tables for Crystallography, Volume C: Mathematical,
Physical and Chemical Tables. International Union of Crystallography: New
York.
(18) Hubbard, C. R.; Snyder, R. L. Powder Diffr. 1988, 3, 74–77.
(19) Chung, F. H. J. Appl. Crystallogr. 1974, 7, 526–531.
Figure 5.XRD patterns measured for (a) estuarine and (b) marine clay (<3µm) fractions.
Figure 6
powder patterns measured for the clays fractions, and (2) RIRkao001,corundum, RIRill001,corundum, and RIRqtz100,corundumcorrespond
to the ratios of integrated intensities of the analyte reflection (kaolinite 001, illite 001, or quartz 100) to the 113 reflection from corundum (Al2O3) measured for 1:1 mixtures by weight of pure
analyte and corundum. RIRkao001,corundum, RIRill001,corundum, and
RIRqtz100,corundum, ratios of 1.20, 0.70, and 0.93, respectively, were
assumed here based on published data.20,21It is important to note
that eq 1 is valid to the extent that the clay fractions analyzed here are comprised only of illite, kaolinite, and quartz. For clays fractions where more or other mineral phases are observed, an equation similar to eq 1 would also apply if all of the phases in the mixture are identified and the RIR value is known for each phase.18,19
Although preferred orientation of clay mineral particles could affect the quantification results obtained by the RIR-based method,
for the <3µm size clay fractions analyzed here, it is expected that these effects will be minimal and remain the same from sample to sample.
2.4. Batch-Extraction Unit Tests.The processability of the oil sands analyzed here was assessed by batch-extraction unit (BEU) tests elsewhere.5Table 1 lists the set of BEU results used below
(section 4) to correlate total bitumen recoveries with clay mineral properties measured for the samples.
3. Results
3.1. Measured XRD Powder Patterns. Parts a and b of Figures 3–5 are logarithmic-scale experimental intensity powder pattern profiles measured for unextracted oil sands, fines, and clays, respectively. For each figure, a and b refer to estuarine and marine samples, respectively. Clearly, the 001 reflection from illite at ∼8.85°2θ and kaolinite at ∼12.35°2θ are the main clay mineral XRD peaks observed for all samples.
3.1.1. Unextracted Oil Sands.The XRD patterns measured for marine unextracted oil sands (Figure 3b) show the presence
(20) Kim, Y.; Cho, S.; Kang, H.-D.; Kim, W.; Lee, H.-D.; Doh, S.-H.; Kim, K.; Yun, S.-G.; Kim, D.-S.; Jeong, G. Y. Mar. Pollut. Bull. 2006, 52, 659–665.
(21) Davis, B. L.; Smith, D. K.; Holomany, M. A. Powder Diffr. 1989,
4, 201–205.
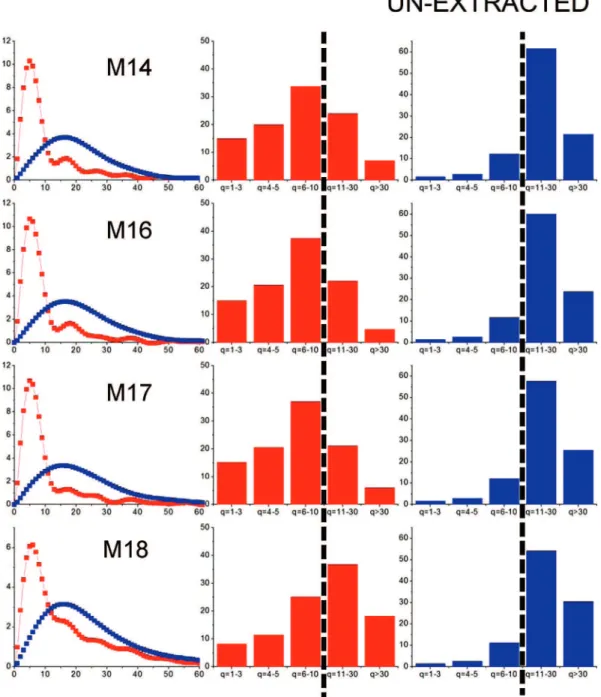
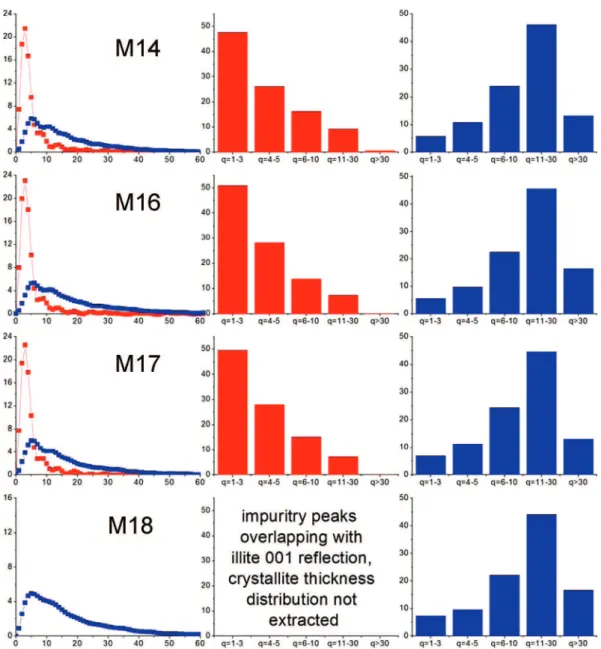
Figure 6.Illite and kaolinite mass versus crystallite thickness distributions extracted for (a) estuarine and (b) marine unextracted oil sands.
Figure 7
of chlorite at ∼6.25°2θ, whereas the latter clay mineral is not detected in any of the diffraction patterns measured for estuarine unextracted oil sands (Figure 3a). The presence of gypsum (CaSO4· 2H2O) is noted at ∼11.70°2θ for most samples. While
the shape of the kaolinite 001 reflection appears similar for all samples (i.e., all samples have similar crystallite thickness distributions for kaolinite), that of the illite 001 reflection differs quite significantly. For samples E3, E9, and M18, relatively thinner diffraction peaks (i.e., larger crystallite thicknesses or sizes) are observed. Samples M13, M14, M16, and M17 show relatively broader illite 001 diffraction lines (i.e., smaller crystallite thicknesses or sizes), particularly on the low-angle side of the peaks where higher, broader shoulders are clearly noticeable. The illite 001 reflection from samples E2, E7, and E11 are poorly resolved and barely rise above the background line. It is interesting to note that these latter three samples actually contain the lowest amounts of fines among the 10 oil sands analyzed here.5
3.1.2. Fines. The clay minerals identified and diffraction-peak-shape sample-sample differences observed for the <44
µm size fines fractions (Figure 4) are the same as those described above for unextracted oil sands. Chlorite is present in significant amounts only in marine samples. Samples E3 and E9 might may contain a small quantity of chlorite, but the corresponding diffraction signal in these cases is at the detection limit of the XRD experiments. The shapes of the kaolinite 001 reflection profiles (i.e., the crystallite thickness distributions for kaolinite) are similar for all samples. The illite 001 reflection from samples E2, E7, and E11 are better resolved than in the case of unextracted oil sands (Figure 3a). Samples M13, M14, M16, and M17 show broader illite 001 diffraction lines with higher low-angle-side shoulders (i.e., smaller crystallite thicknesses or sizes) compared to the rest of the samples.
3.1.3. Clays.The shapes of illite and kaolinite 001 reflections for the <3µm size clay fractions (Figure 5) are similar for all samples and much broader (i.e., crystallite thickness distributions corresponding to smaller thicknesses or sizes are observed), compared to what was observed for unextracted oil sands (Figure 3) and fines (Figure 4). Both estuarine and marine clays now show high broad shoulders on the low-angle side of the illite Figure 7.Illite and kaolinite mass versus crystallite thickness distributions extracted for (a) estuarine and (b) marine fines (<44µm) fractions.
Figure 8
001 reflection. The chlorite 001 reflections for marine samples, when detectable, are almost completely buried by the illite 001 low-angle tails. For the clay fraction from sample M18, an unknown peak is detected at ∼7.80° 2θ, while the peak at ∼10.15° 2θ is consistent with the presence of scarbroite [Al5(OH)13CO3· 5H2O]. An occurrence of scarbroite has been
reported at Muskiki Lake, Saskatchewan, Canada, in association with illite, kaolinite, smectite, chlorite, huntite, feldspar, and quartz.22While gypsum is noted in all unextracted ores, it is
not observed in the fines and clay fractions, suggesting that the particles of this mineral may be predominantly larger than 44 µm.
3.2. Mass versus Crystallite Thickness Distributions.Parts a and b of Figures 6–8 report the illite and kaolinite mass versus crystallite thickness distributions for unextracted oil sands, fines, and clays, respectively, as extracted by the procedure described in section 2.4 above. In each of these figures, the left column displays Q(q) as a function of q mass versus thickness distributions for each sample. Illite is represented by the red-symbol line, and kaolinite is represented by the blue-red-symbol line. The histograms plotted in the middle and right columns
correspond respectively to the illite and kaolinite Q(q) versus q distributions plotted in the left column. The data represented in these histograms were obtained by summing individual data points of corresponding Q(q) versus q distributions into five distinct bins: (1) q ) 1-3, (2) q ) 4-5, (3) q ) 6-10, (4) q ) 11-30, and (5) q > 30. We found the data representation provided by these histograms useful to highlight key sample-sample differences.
The more-or-less sinusoidal behavior, superposed by a smooth curve, observed for the Q(q) versus q distributions of most samples results from two artifacts: (1) the necessary truncation of peak tails23because of the overlap with either small peaks
from other mineral constituents or with strong tails because of greater abundance of other phyllosilicate-mineral components and (2) a low signal-to-noise ratio for the peak profile, i.e., measured intensities for the peak not being at least 10 000-20 000 counts above the background line (as explained in section 2.4 above).
(22) Handbook of Mineralogy, Mineral Data Publishing, accessed through Mindat.org at http://www.mindat.org/min-3551.html.
(23) Bertaut, E. F. Acta Crystallogr. 1952, 5, 117–121.
Figure 8.Illite and kaolinite mass versus crystallite thickness distributions extracted for (a) estuarine and (b) marine clay (<3µm) fractions.
For unextracted oil sands (Figure 6), illite mass versus thickness distributions were extracted for all samples, except
E2, E7, and E11, because the illite 001 reflection was not resolved in the XRD powder patterns measured for these Figure 9
samples (Figure 3a). In comparing the illite Q(q) versus q distributions for the unextracted samples, we note that the highest peak of the histograms for samples M13, M14, M16, and M17 is at bin q ) 6-10, whereas the histograms for the remaining samples have their highest peak shifted toward larger crystallite thicknesses, i.e., at bin q ) 11-30. While the illite histograms for the fines fractions (Figure 7) from samples M13, M14, M16, and M17 all show the same type of “decrescendo” shape, those for the other six samples are different; in that, the bins with higher crystallite thicknesses are more populated. The illite Q(q) versus q histograms for the clay fractions (Figure 8) all show a decrescendo shape, with near-zero mass percentage of crystallites with thicknesses q > 30.
The Q(q) as a function of q mass versus thickness histograms for kaolinite are all of similar shapes and do not show any systematic differences between samples within unextracted oil sands, fines, or clays.
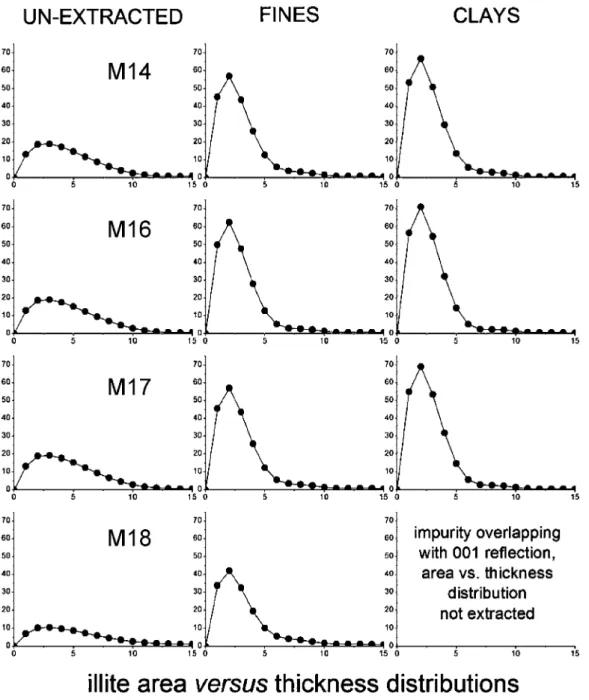
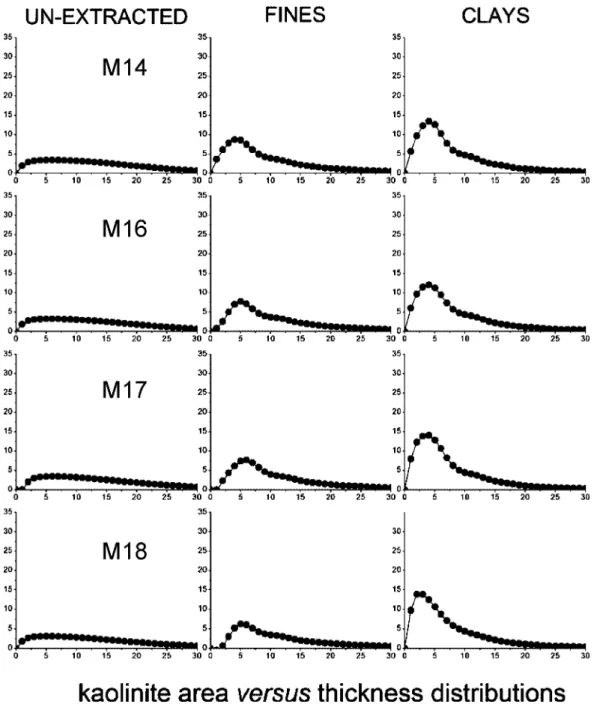
3.3. Area versus Crystallite Thickness Distributions.The A(q) as a function of q area versus crystallite thickness distributions extracted for illite and kaolinite are shown respectively in Figures 9 and 10. In the series, unextracted oil
sands (left column) to fines (middle column) to clays (right column), we observe that the contribution from thinner crys-tallites increases progressively with respect to that of thicker crystallites. This stresses the outstanding contribution of thinner crystallites to the overall specific surface area of individual phyllosilicate minerals present in a sample and demonstrates that the finest fractions contain larger proportions of the thinnest particles.
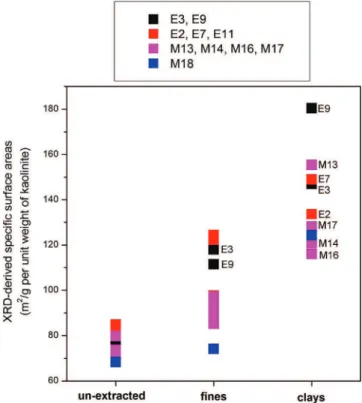
3.4. XRD-Derived Specific Surface Area for Illite and Kaolinite. The specific surface areas for illite and kaolinite [obtained from the A(q) versus q distributions as described in section 2.4] are summarized in Table 2 and are also reported in graphical form in Figures 11 and 12, respectively. The most striking information to draw from this data is that samples M13, M14, M16, and M17 have significantly greater specific surface areas of illite compared to the rest of the samples. This is the most important clay mineral property directly identifiable by XRD on unextracted ores, and its implications are discussed below in section 4.1. No clear systematic differences among samples within unextracted oil sands, fines, and clays can be distinguished for the specific surface areas of kaolinite. Figure 9.Illite area versus crystallite thickness distributions extracted for (a) estuarine and (b) marine samples.
Figure 10
3.5. Clay Mineral XRD Peak Area Ratios. Table 3 lists clay mineral XRD peak area ratios obtained from Lorentz-polarization-corrected, reciprocal-space-converted diffractograms using the procedure explained in section 2.4. Lower illite/ kaolinite ratios (i.e., greater proportions of kaolinite) are
observed for samples E2, E7, E11, and M18. The chlorite/ kaolinite ratios are significant only for marine samples.
3.6. Estimation of Absolute Amounts of Illite and Kaolinite.Table 4 provides estimated absolute amounts of illite and kaolinite for samples where clays fractions were separated and where the 001 reflections for both those minerals in the associated XRD patterns were clearly resolved and free of overlap with reflections from other mineral constituents. As explained in section 2.4, the RIR ratio based XRD methodology used here yields estimated values for the mass fractions of illite, kaolinite, and quartz contained in the clay fractions themselves. After multiplication of these values with the previously deter-mined clay contents,5,6we estimate the absolute amounts of illite
and kaolinite in the unextracted oil sands. Further, multiplication of the mass fractions of illite and kaolinite in oil sands with the mass percentage of illite and kaolinite crystallites with thick-nesses q ) 1-3 (Figure 8), provided estimates for the absolute amounts of “ultrathin illite” and “ultrathin kaolinite” present in the oil sands. Samples M13, M14, M16, and M17 contain notably greater proportions of ultrathin illite, with q ) 1-3, Figure 10.Kaolinite area versus crystallite thickness distributions extracted for (a) estuarine and (b) marine samples.
Table 2. XRD-Derived Specific Surface Areas (m2/g per Unit
Weight) for Illite and Kaolinite in Unextracted Oil Sands, Fines, and Clays
illite kaolinite sample unextracted fines clays unextracted fines clays E3 93 172 217 75 118 147 E9 85 158 227 73 111 180 E2 N/A 157 207 81 98 134 E7 N/A 152 174 85 122 149 E11 N/A 166 N/A 84 124 N/A M13 117 197 230 80 93 155 M14 127 208 234 74 97 121 M16 130 221 246 72 85 116 M17 130 207 242 72 89 128 M18 88 167 N/A 68 74 124
compared to rest of the samples, whereas virtually no ultrathin kaolinite is present in any of the samples.
4. Discussion
4.1. Clay Mineral Properties Directly Identifiable by XRD in Unextracted Ores. Figure 13 shows total bitumen recoveries (Table 1) as a function of (a) ore grade, (b) fines, and (c) clay contents, (d) illite specific surface areas, and (e) illite/kaolinite peak area ratios extracted directly from XRD measurements on unextracted oil sands. Whereas ore grade
(Figure 13a) and fines (Figure 13b) content (i.e., the traditional processability markers used by oil sand operators) do not show any apparent correlation with recoveries, a marked breakpoint (Figure 13c) between marine and estuarine samples is observed for clay contents (∼5-6 wt % oil sands for marine versus ∼1-4 wt % for estuarine). This experimental result was the main finding of a previous publication.6
4.1.1. Illite Specific Surface Area.It is shown here (Figure 13d) that the specific surface area (SSA) of illite extracted directly by XRD on unextracted ores permits the identification Figure 11.XRD-derived specific surface areas for illite.
Table 3. Clay Mineral XRD Peak Area Ratio Extracted from Lorentz-Polarization-Corrected, Reciprocal-Space-Converted Diffractograms
XRD peak area ratios illite/kaolinite XRD peak area ratios chlorite/kaolinite sample unextracted fines clays unextracted fines clays
E3 0.285 0.292 0.291 0a 0.0012 0a
E9 0.266 0.276 0.396 0a 0a 0a
E2 0a 0.117 0.098 0a 0a 0a
E7 0a 0.064 0.027 0a 0a 0a
E11 0a 0.100 N/A 0a 0a N/A
M13 0.351 0.323 0.488 0.0089 0.0081 0.0010 M14 0.328 0.334 0.436 0.0061 0.0063 0.0017 M16 0.306 0.302 0.358 0.0063 0.0043 0a
M17 0.280 0.296 0.589 0.0057 0.0052 0a
M18 0.117 0.141 N/A 0.0022 0.0001 N/A
aBelow detection limit.
Table 4. Estimated Weight Fractions of Illite, Kaolinite, and Quartz in Clay Fractions along with Other Selected Clay Properties Obtained by Combining These Numbers with Clay Contents Determined Elsewhere6
sample Xillite (wt % of clays) Xkaolinite (wt % of clays) Xquartz (wt % of clays) illite/kaolinite mass ratio in clays clays content (wt % of oil sands) Xillite (wt % of oil sands) Xkaolinite (wt % of oil sands) illite with q ) 1-3(wt % of illite) illite with q ) 1-3(wt % of oil sands) kaolinite with q ) 1-3(wt % of kaolinite) kaolinite with q ) 1-3(wt % of oil sands) E3 60.4 37.4 2.2 1.62 3.8 2.3 1.4 42.3 1.0 10.7 0.2 E9 67.0 31.1 1.9 2.16 3.0 2.0 0.9 44.8 0.9 15.5 0.1 E2 48.2 47.8 4.1 1.01 1.0 0.5 0.5 39.6 0.2 8.0 0.0 E7 48.0 46.1 5.9 1.04 1.3 0.6 0.6 29.0 0.2 9.9 0.1 E11 clays fraction not separated for this sample 1.8 N/A N/A N/A N/A N/A N/A M13 66.9 29.6 3.6 2.26 6.3 4.2 1.9 45.7 1.9 11.3 0.2 M14 65.4 29.6 5.0 2.21 5.3 3.5 1.6 47.7 1.7 5.8 0.1 M16 62.9 30.9 6.2 2.03 5.0 3.1 1.5 50.9 1.6 5.6 0.1 M17 68.2 26.7 5.1 2.55 5.8 4.0 1.5 49.6 2.0 6.9 0.1
M18 N/A N/A N/A N/A 5.2 N/A N/A N/A N/A N/A N/A
Figure 12.XRD-derived specific surface areas for kaolinite.
of four poorly processable oil sands (M13, M14, M16, and M17) that gave low recoveries in BEU tests. Even optimized caustic addition based on commercial experience with ore processing was able to recover only between 50 and 90% bitumen for these cases.5 For all four of these unextracted samples, the illite
specific surface area was greater than ∼110 m2/g per unit weight
(see both Figures 11 and 13d). We therefore suggest that this criterion (i.e., unextracted illite SSA g ∼110 m2/g) be used in
conjunction with existing processability markers to identify problem ores. Although this experimental result was derived from analyzing a fairly small number of oil sands, it is potentially important because this new processability marker is Figure 13.Total recoveries versus (a) ore grade, (b) fines, and (c) clays contents, (d) illite specific surface area, and (e) illite/kaolinite XRD peak area ratios for unextracted samples. Note: puw ) per unit weight.
obtained directly from unextracted ore and appears to be useful in the identification of poorly processable oil sands prior to processing.
4.1.2. Illite/Kaolinite XRD Peak Area Ratios.Another marker directly measurable by XRD on unextracted ore is the illite/ kaolinite diffraction peak area ratio (Figure 13e). This parameter, when plotted against total recoveries for the 10 oil sands analyzed here, produces distinct sample “pockets” that show some similarity with the groupings identified previously using a simple jar test to qualitatively establish bitumen separation behavior.5 We therefore suggest that more work should be
performed to determine whether illite/kaolinite ratios can be of any use in predicting oil sand bitumen separation behavior. Because the illite/kaolinite XRD peak area ratio is
straightfor-ward to measure by XRD on unextracted ore, it could potentially become a useful marker for processability.
4.1.3. Presence Versus Absence of Chlorite Reflections in XRD Patterns.Significant amounts of chlorite, as measured by XRD, were observed for unextracted oil sands only in marine samples (Figure 3b and Table 3). Accordingly, the presence or absence of clearly resolved chlorite 001 reflections in XRD patterns may indicate whether a sample is from a marine or an estuarine depositional environment. Because the measured bitumen recoveries in BEU tests were generally much worse for marine than estuarine oil sands (Table 1), the presence or absence of chlorite might be a potential marker for categorizing oil sands prior to extraction, but more experimental data would be required to confirm this finding. Even though the depositional environment of an ore may already be known ahead of extraction through geological assessments of deposits prior to the start of mining, the occurrence of chlorite-rich intergrades that would not necessarily have been identified by those geological assess-ments could be monitored using XRD on unextracted ore.
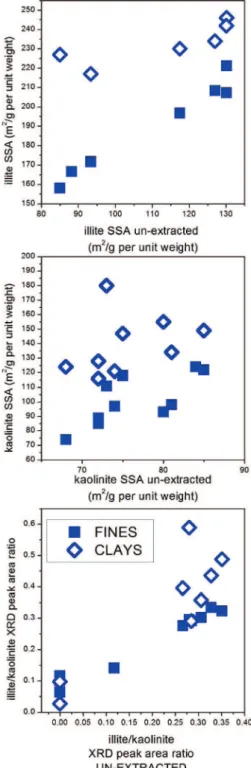
4.2. Clay Mineralogy and Size Distribution of
Unextracted Ores versus Fines and Clays. Figure 14 plots the XRD-derived illite and kaolinite SSAs and illite/kaolinite peak area ratios of unextracted ores (x axis) against correspond-ing data extracted for fines and clays (y axis). For both illite and kaolinite SSAs and illite/kaolinite ratio, there is a nearly linear relationship between the data for the unextracted oil sands and the corresponding results for the individual fines fractions separated from those ores. Such correlation demonstrates that the great majority of phyllosilicate mineral particles must occur in the <44 µm size fines fraction. By contrast, the scatter observed between the same data for the unextracted ores and their corresponding clay fractions shows that not all clay mineral particles are to be found in the <3µm size fraction. This latter point is also demonstrated by Figures 11 and 12, which show that illite and kaolinite SSAs increase (i.e., the clay mineral particle thicknesses or sizes decrease) from unextracted oil sands through fines to clays.
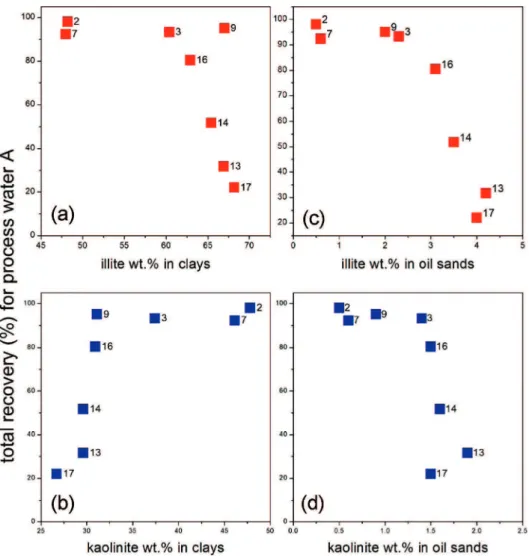
4.3. Illite and Kaolinite Concentrations in Clays and Oil Sands.Curves, showing bitumen recovery as a function of the wt % contribution of illite and kaolinite to the <3µm size clays fraction separated from each oil sands are plotted on parts a and b of Figure 15. On parts c and d of Figure 15 bitumen recoveries are plotted versus calculated wt % contents of illite and kaolinite per original (unextracted) oil sands (Table 4). As in the case of the plot of clay contents (parts a and c of Figure 13c), the same trends and demarcation between estuarine and marine samples are observed. As expected, an increase of the wt % content in oil sands of both illite and kaolinite is associated with lower bitumen recoveries. On the hand, the illite and kaolinite wt % in clays show reverse trends as a function of recoveries, thus suggesting that the amount of clays is of importance rather than their mineralogy. In other words, the data representation of Figure 15 does not allow us to tell which of the two clay minerals, illite or kaolinite, has the worst impact on bitumen recoveries.
4.4. Mass Fractions of “Ultrathin” Illite and Kaolinite.
Figure 16 displays results for total recovery versus wt % contribution of ultrathin illite and ultrathin kaolinite to oil sands (i.e., the mass fractions of illite and kaolinite in oil sands with q ) 1-3 composite layer thicknesses; see Table 4). Whereas the illite and kaolinite concentrations in clays and whole oil sands did not seem to be of more importance than the clays content (Figure 13c) in predicting bitumen recovery, for the ultrafines component, the mineralogy becomes a key factor. For Figure 14.Illite and kaolinite SSAs and illite/kaolinite XRD peak area
ratios for unextracted samples compared to those for fines and clays.
the oil sands analyzed here, the amount of ultrathin illite was critical. Because ultrathin kaolinite concentrations were virtually zero for all samples, they were apparently not a major factor here. However, it is expected that any adverse effects of ultrathin kaolinite on processability would be additive to the contributions from ultrathin illite fractions.
In recent work by our group,24the amounts of ultrafines (<0.3
µm size material) in oil sands from different depositional environments was determined for a suite of ores, including a number of waste units samples (i.e., beds or lenses of barren clay-size material). The ultrafines component was separated from those samples by means of time-consuming wet chemistry techniques. Using a2H nuclear magnetic resonance (NMR)
method to measure both the degree and rate of gelation of ultrafines suspensions separated from these oil sands, it was shown that sludging conditions in the primary separation vessel are reached when the ultrafines concentration is between about 1.5 and 2.0 wt % oil sands.
The latter number closely matches the total amount of ultrathin illite and kaolinite contents (Figure 16), beyond which total recoveries for the oil sands analyzed here became significantly reduced. This suggests that the method developed in the present work to quantify the amount of ultrathin clay minerals in fact corresponds to a measure of the ultrafines concentrations in oil sands. The merit of the technique developed here (see section 3.6), combining clay mineral XRD peak profile
analysis with laser-diffractometry determination of clay content (Figure 13c), is that it allows an evaluation of ultrafines concentrations without having to perform time-consuming wet-chemistry separation of this component.
The ultrafines concentrations in oil sands has previously been proposed as the major contributor to the formation of mature fine tailings11 and possibly the sludging behavior sometimes
encountered in the primary separation vessel during extraction.24
Consequently, a practical processability marker to assess (or predict) the ultrafines concentration of a given oil sands prior to processing could be useful for both operational diagnostics of bitumen extractability and fines tailings management pur-poses. We hope that the XRD-based methodology developed and tested in the present work will constitute a first step in this regard.
5. Conclusions
An XRD methodology to characterize phyllosilicate clays in oil sands was tested and further developed through analysis of five estuarine and five marine unextracted oil sands and their corresponding fines (<44 µm size) and clay (<3 µm size) fractions. The following main conclusions either directly follow from the experimental results or may be reasonably inferred: (1) The SSA of illite extracted directly by XRD on unextracted ores was significantly greater for four problem ore oil sands. For these ores, the illite SSA was greater than ∼110 m2/g per
unit weight. This experimental evidence strongly suggests that the illite SSA may have a drastic negative impact on bitumen
(24) Tu, Y.; O’Carroll, J. B.; Kotlyar, L. S.; Sparks, B. D.; Ng, S.; Chung, K. H.; Cuddy, G. Fuel 2005, 84, 653–660.
Figure 15.Total recoveries versus illite and kaolinite concentrations in clay fractions and whole oil sands.
recovery. Consequently, this parameter has potential utility as a marker to identify problem ores. (2) Correlation of llite/ kaolinite XRD peak area ratios for unextracted ores with bitumen recovery produced a processability classification similar to that suggested in previous work. (3) Significant amounts of chlorite, as measured by XRD, were observed for unextracted oil sands only in marine samples; the presence of this clay mineral may be of significance in categorizing oil sands prior to processing. (4) Not all clay mineral particles are to be found in the <3µm size clays fraction. The finest size fractions contain larger proportions of the thinnest particles. (5) A novel method that combines XRD analysis on separated clays with laser diffraction PSD data allows for quantitative determination of clay mineral contents and their ultrafines components without having to perform time-consuming wet-chemistry separation of ultrafines. (6) Because ultrathin kaolinite concentrations were virtually zero for all samples investigated, the amount of ultrathin illite was critical for assessment of processability for the oil sands analyzed here. However, it is expected that any adverse effects caused by ultrathin clay minerals on process-ability would be additive. (7) The amount of ultrathin illite and kaolinite measured for four poorly processing oil sand ores characterized in this work closely matched the ultrafines concentration required to cause problematic sludging (gelation) effects during extraction.
Acknowledgment. The financial support for this work was provided by the Canadian Oil Sands Network for Research and Development (CONRAD), Syncrude Canada Ltd., the National Research Council of Canada, and the Climate Change Technology and Innovation program of the Canadian government. The authors thank CONRAD and Syncrude Canada Ltd. for their permission to publish this work.
EF8002203
Figure 16.Total recoveries versus mass fractions of ultrathin illite and ultrathin kaolinite in oil sands.