Impact of energy and casein or whey protein intake on bone status in a rat
model of age-related bone loss
J. Mardon*, A. Zangarelli, S. Walrand, M. J. Davicco, P. Lebecque, C. Demigne´, M. N. Horcajada, Y. Boirie
and V. Coxam
Unite´ de Nutrition Humaine UMR1019, INRA Clermont-Ferrand / Theix, 63122 Saint Gene`s Champanelle, France (Received 23 April 2007 – Revised 19 June 2007 – Accepted 23 August 2007)
In the elderly, nutritional deficiencies, such as low energy and protein intake, are suggested to increase the risk of osteoporotic fractures. Modu-lation of the amount and quality of protein intake under energy deficient conditions represents an interesting strategy to prevent aged-related bone loss. We investigated the effect of a 5-month dietary restriction on bone status in 16-month-old male rats. Rats were randomised into six groups (n 10 per group). Control animals were fed a normal diet containing either casein (N-C) or whey protein (N-WP). The other groups received a 40 % protein and energy-restricted diet with casein or whey protein (PER-C and PER-WP) or a normal protein and energy-restricted diet (ER-C and ER-WP). Both restrictions (PER and ER) induced a decrease in femoral bone mineral density (BMD), consistent with impaired biomechanical properties and a reduced cortical area at the diaphysis. Plasma osteocalcin and urinary deoxypyridinoline levels suggested a decrease in bone turnover in the PER and ER groups. Interestingly, circulating insulin-like growth factor 1 (IGF-1) levels were also lowered. Overall, normal protein intake did not elicit any bone sparing effect in energy-deficient rats. Regarding protein quality, neither casein nor WP appeared to significantly prevent the BMD decrease. This study confirms that nutritional deficiencies may contribute to osteopenia through decreased IGF-1 levels. Moreover, it seems that impaired bone status could not be significantly prevented by modulating the amount and quality of dietary proteins. Energy restriction: Protein deficiency: Casein or whey protein: Bone
Age-related osteoporosis mainly affects people older than 70 years of age and results, in most cases, in both vertebral and hip fractures. Given the magnitude of this public health pro-blem and the dramatically increased proportion of older indi-viduals predicted in the next decades, it is necessary to evaluate the potential of every preventive intervention.
In addition to the well-recognised risk factors such as Ca and vitamin D deficiency1, other nutritional aspects have been suggested to contribute to the increased incidence of osteoporosis in the elderly. Indeed, ageing has been correlated with a physiological decline in appetite and food intake. This change predisposes the elderly to a poor nutritional status2, resulting in a compromised musculoskeletal system characterised by lower muscle mass and a decrease in bone mineral content3.
The impact of low energy and protein intake on the skeleton has been investigated in the elderly4 – 6. Bonjour et al.7 revisited the concept of Albright8 who hypothesised that ‘a diet inadequate in protein might lead to a negative nitrogen balance’ and consequently affect bone formation. Several studies have established a positive correlation between bone mineral density (BMD) and both energy and protein intake9 – 11, and such oral supplementation seemed to improve the clinical outcome in elderly patients with femoral neck fractures12,13.
In animals, energy restriction has been demonstrated to adversely affect bone status. McCay et al.14 first reported that bones became fragile after long-term energy restriction in rats and that ‘some crumbled with the course of dissection’. In this particular study, the fragility most likely was due to the extreme dietary deprivation, including Ca insufficiency. How-ever, subsequent works have demonstrated altered femoral bone mineral content15,16, BMD and biomechanical properties in old rats under energy restriction17,18.
Protein is a major component of the bone organic matrix and consequently, dietary proteins contribute the essential amino acids necessary for new matrix synthesis. In rats, pro-tein under-nutrition has been associated with lower bone mass and strength, modulated by the growth hormone – insu-lin-like growth factor 1 (IGF-1) axis19, and in animals fed a low protein diet, bone strength was increased by dietary sup-plementation with essential amino acids20. Consequently, modulation of the amount and quality of dietary protein intake represents an interesting approach to preventing bone loss during ageing.
Whey protein (WP) contains a relatively high proportion of essential amino acids and can effectively modulate whole body protein anabolism21 and prevent body protein loss in elderly subjects22. However, few studies have examined the
* Corresponding author: Dr Julie Mardon, fax 33 473 62 46 38, email jmardon@clermont.inra.fr
Abbreviations:BMD, bone mineral density; DPD, deoxypyridinoline; IGF-1, insulin-like growth factor 1; OC, osteocalcin; WP, whey protein; N, ER and PER,
treatment with normal, energy-restricted, and protein – energy-restricted diet respectively; -C, and -1 WP, casein and WP additions to ER, PER and N diets. qThe Authors 2007
British
Journal
of
Nutrition
. IP address: 118.70.52.165 , on 24 Jun 2021 at 12:10:18, subject to the Cambridge Core terms of use, available at
https://www.cambridge.org/core/terms
.
effect of WP intake on bone status. The administration of WP was shown to effectively increase bone strength23and enhance bone formation24in young animals. On the other hand, casein, which is widely used in experimental diets25, has some inter-esting properties. Casein intake leads to the formation of casein phosphopeptides during digestion and the casein phos-phopeptides have been suggested to promote Ca
absorp-tion26,27and stimulate bone mineralisation28. Therefore, both
casein and WP potentially have an impact on bone quality and/or status. However, further studies are required to specifi-cally examine how these proteins modulate skeletal metab-olism and status during ageing.
This study was designed to test if an adequate protein intake, provided by casein or WP, could prevent the alteration of bone status induced by energy deficiency in the elderly. Using old male rats, two specific questions were addressed:
(i) What are the long-term effects on bone status of protein and energy restriction (PER) and energy restriction (ER) alone, compared to normal protein and energy supply (N)?
(ii) How does the protein source (casein or WP) influence bone status in restricted and unrestricted rats?
Experimental methods Experimental design
The study was conducted in accordance with the regional Ethics Committee (France).
Male Wistar rats were purchased from Janvier (Le Genest St Isle, France) and housed individually. Male rats were stu-died in order to eliminate the potential confounding effect of hormonal fluctuations present with an oestrus cycle. Animals were subjected to 12 – 12 h light – dark cycles and had free access to water.
At the beginning of the study, the rats were 16 months old and the experiment continued for 5 months. During a 2-week adaptation period, the animals were maintained on a standard chow diet to record their daily food intake and body weight. Then, they were randomly assigned to one of six dietary groups (n 10 animals per group). Two control groups received a normal diet (N): a standard semi-purified diet containing 69 % carbohydrate, 6 % fat and either 17 % casein (N-C) or 17 % WP (N-WP) as protein source (Table 1). Rats of the N groups were fed a measured amount, corresponding to 90 – 95 % of the average ad libitum intake, to match energy intake and to facilitate the study of healthy, non-obese control animals29. The mean energy intake was about 451 kJ/d (108 kcal/d). The protein and energy-restricted groups (PER-C and PER-WP) were limited to 60 % of the intake of the N groups (i.e. 10·2 % protein and 272 kJ/d (65 kcal/d), respect-ively). The energy-restricted groups (ER-C and ER-WP) received 60 % of the energy of the controls (i.e. 272 kJ/d), but had their protein intake maintained at the level of the N groups. All diet-restricted rats were normalised to the N ani-mals with respect to lipid, fibre, mineral and vitamin intake. Thus, all the animals consumed the same amounts of dietary Ca and P (Ca:P ratio ¼ 1·45). During the experiment, body weight was recorded twice weekly.
At the end of the experiment, rats were fasted for 12 h and sacrificed. Blood as well as prior 24-h urine samples were col-lected to assay the biochemical parameters. Femurs were cleaned from adjacent tissues. Left femurs were harvested in saline solution (9 g NaCl/l) and frozen (2 208C) until mechan-ical testing. Right femurs were placed in 80 % alcohol until BMD was measured.
Physical measurements
Bone mineral density. BMD was assessed by dual-energy X-ray absorptiometry, using a Hologic QDR-4500 A X-ray bone densitometer (Hologic, Massy, France). Total femoral BMD, metaphyseal BMD and diaphyseal BMD were deter-mined. For metaphyseal BMD and diaphyseal BMD measure-ments, scans were cut and analysed as follows: the first cut of the femur was performed at the upper third, and the next cut was made at the lower third. Diaphyseal BMD, which is rich in cortical bone, corresponded to the density of the second third of the femur. Metaphyseal BMD, which mainly contains cancellous bone, was calculated as the mean of the femoral proximal metaphysis density and the femoral distal metaphysis density.
Femoral mechanical testing. Femoral length and mean diaphyseal diameter were measured with a precision caliper (Mitutoyo, Shropshire, UK). The femoral failure load was determined using a three-point bending test30, with a Univer-sal Testing Machine (Instron 4501, Instron, Canton, MA, USA). The two lower supports were separated by a 20 mm dis-tance and an upper crosshead roller was applied in front of the middle of the bone until failure at a speed of 0·5 mm/min to guarantee that 85 – 90 % of the bone flexure was due to bending.
Static histomorphometry. After BMD measurements, distal right femurs were dehydrated in a graded series of ethanol solutions for 5 d prior to embedding in methyl methacrylate (Sigma, L’Isle d’Abeau, France). Blocks were then polished with a grinder (Metaserv 2000, Buehler, Coven-try, UK) and 10 mm frontal sections were cut using a RM2165 Leica microtome (Leica Microsystems Nussloch GmbH, Nussloch, Germany). Sections were stained using the Von Kossa silver method (AgNO3; Sigma). Four sections were ana-lysed per femur. To characterise static cancellous bone, image Table 1. Daily ration composition
Dietary treatment* Component (g/d) N-C N-WP PER-C PER-WP ER-C ER-WP
Casein or whey protein 4·73 2·87 4·73
Maize starch 12·43 6·35 5·11
Sucrose 6·20 3·19 2·56
Groundnut and rape oils 1·69 1·69 1·69
Cellulose 1·25 1·27 1·27
Mineral mix 1·25 1·26 1·26
Vitamin mix 0·28 0·28 0·28
Total daily intake 27·83 16·91 16·90
* N, ER and PER, treatment with normal, energy-restricted, and protein and energy-restricted diet respectively; -C, and -WP, casein and whey protein additions to ER, PER and N diets.
Protein intake and energy deficiency in rat 765
British
Journal
of
Nutrition
Downloaded from https://www.cambridge.org/core . IP address: 118.70.52.165 , on 24 Jun 2021 at 12:10:18, subject to the Cambridge Core terms of use, available at
https://www.cambridge.org/core/terms
.
acquisition was carried out with an Axioplan EE microscope (Zeiss, Go¨ttingen, Germany) and image analysis performed in the secondary spongiosa of the distal femur metaphysis with the OsteoLab software (Biocom, Paris, France). This allows an evaluation of cancellous bone volume (bone volu-me:total tissue volume, %), trabecular number, trabecular thickness (mm) and trabecular separation (mm). Cortical bone was assessed at the femoral diaphysis. Cross sections were analysed with the ImageJ 1·34 s software (National Insti-tutes of Health, Bethesda, MD, USA) to measure tissue, marrow and cortical areas (mm2). All histomorphometric par-ameters were determined according to Parfitt et al.31. Biochemical analysis
Osteoblastic activity. Plasma osteocalcin (OC) was measured by RIA, using rat125I-labeled OC, a goat anti-rat OC antibody and a donkey anti-goat secondary antibody (Biochemical Technologies, Stoughton, MA, USA). The sensi-tivity was 0·01 ng/ml. The intra- and interassay precisions were 6·8 and 8·9 %, respectively.
Bone resorption. The urinary deoxypyridinoline (DPD) excretion rate (nmol/24 h) was determined by competitive RIA, using a rat monoclonal anti-DPD antibody adsorbed to the inner surface of a polystyrene tube and125I-labeled DPD (Pyrilinks-D RIA kit, Metra Biosystems, Mountain View, CA, USA). The sensitivity was 2 nmol/l. The intra- and inter-assay precisions were 4 and 6 %, respectively.
Leptin. Plasma leptin concentrations were assessed by RIA using an anti-rat leptin antibody and a rat leptin as stan-dard (Rat Leptin RIA kit; Linco Research Inc., Missouri, USA). The lowest limit of sensitivity was 0·5 ng/ml, and the intra- and interassay variations were 1·5 and 2·5 %, respectively.
Insulin-like growth factor I. IGF-1 concentrations were measured in serum samples using a two-site immunoenzymo-metric assay (OCTEIA Rat/Mouse IGF-1 kit, IDS, Paris, France). The sensitivity of the assay was 82 ng/ml. Intra-and interassay variations were 5·7 Intra-and 10·7 %, respectively.
Urinary calcium excretion. Urinary Ca was determined by atomic absorption spectrophotometry (Perkin Elmer 400, Nor-walk, CT, USA). Each sample was diluted appropriately with distilled water and lanthanum chloride (0·1 %) for atomisation. The urinary Ca excretion was calculated using the volume of the 24 h urine samples collected.
Statistical methods
Results are expressed as means with their standard errors and were analysed with XLSTAT (Addinsoft, Paris, France). The BMD, biomechanical and histomorphometric variables were subjected to a two-way analysis of covariance (ANCOVA) with body weight as the covariate to ensure the assessment of dietary restriction and protein type independently of body weight variations32. Other parameters were analysed using a two-way ANOVA, testing for any difference among groups. Thus, the main effects assessed were dietary restric-tion (N / PER / ER), protein (C / WP) and their interacrestric-tion (dietary restriction £ protein). If a result was found signifi-cant (P, 0·05), the Student – Newman – Keuls multiple com-parison test was used to determine specific differences
between means. Linear regressions were also performed, to study internal correlations among variables, and the Pearson test was carried out to assess their significance.
Results Body weight
Changes in body weight are shown in Fig. 1. As expected, ani-mals on dietary restriction exhibited a significant decrease in body weight (P, 0·0001) at the completion of the study, com-pared to rats fed normal diets. The PER and ER rats weighed about 150 g less than N groups. There was no significant difference between the four restricted groups, whatever the level or the quality of dietary protein. Plasma leptin concentrations are known to correlate with adiposity in mammals33. Here, the leptin levels (ng/ml) were markedly lower in the PER and ER groups than in the N groups (N-C: 11·94 (SEM 1·54); N-WP: 12·31 (SEM 1·45) v. PER-C: 3·46 (SEM 0·39); PER-WP: 4·35 (SEM 0·50); ER-C: 2·28
(SEM 0·31); ER-WP: 3·62 (SEM 0·63)). This suggests a fat-mass reduction in the restricted animals.
Bone mineral density. The BMD was consistently reduced by both types of dietary restriction (PER and ER) in total femur (P¼ 0·020), as well as at the diaphyseal (P¼ 0·016) and the metaphyseal (P¼ 0·064) sites (Fig. 2(a), (b) and (c) respectively)). The casein-fed rats tended to have a higher BMD than those fed the WP diet (P¼ 0·073).
Biomechanical properties. Femurs from restricted animals (PER and ER) had a lower resistance to fracture compared to those from the N groups (P¼ 0·013), but resistance to fracture did not differ between the PER and ER groups (Fig. 2(d)). The type of dietary protein had no significant effect. However, femoral biomechanical resistance tended to be higher in the casein groups (P¼ 0·089) than the WP groups.
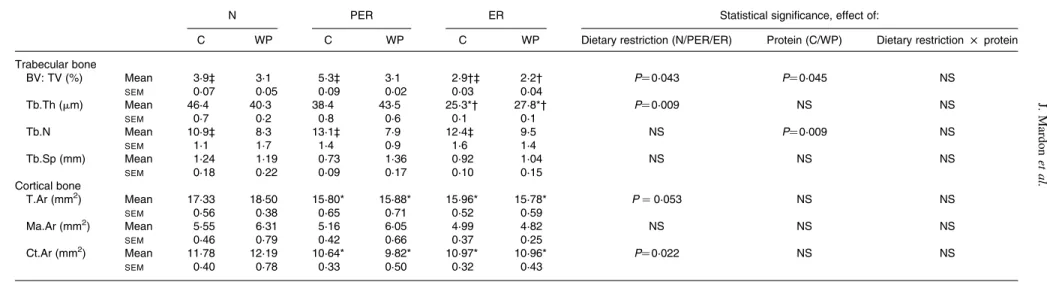
Static histomorphometry. Histomorphometric data of the distal femur are shown in Table 2. The trabecular bone volume to total volume ratio (bone volume: total tissue volume; P¼ 0·043) and trabecular thickness (P¼ 0·009) were lower in the energy restricted groups (ER), compared to the
Fig. 1. Body weight of rats fed normal diets (with casein (C), N-C (
†
) and with whey protein (WP), N-WP (B)), protein and energy restricted diets (PER-C (W), PER-WP (A)), and energy restricted diets (ER-C ( ), ER-WP ( )). Values are expressed as means with their standard errors indicated by vertical bars. Two-way ANOVA indicates a significant effect of dietary restric-tion (P, 0·001), a non-significant effect of protein type and no interacrestric-tion between the two variables. * Mean values significantly different from the N groups.British
Journal
of
Nutrition
. IP address: 118.70.52.165 , on 24 Jun 2021 at 12:10:18, subject to the Cambridge Core terms of use, available at
https://www.cambridge.org/core/terms
.
protein-energy restricted (PER) groups. Casein intake was associated with an increase in bone volume (P¼ 0·045), as well as an elevated trabecular number (P¼ 0·009) compared to the WP diets, in both restricted and non-restricted rats.
Cortical bone parameters were only affected by the dietary restriction factor. Tissue area in the femoral diaphysis decreased in the PER and ER groups compared to the N groups (P¼ 0·053). The same pattern was observed for cortical area (P¼ 0·022).
Bone biomarkers. Fig. 3 shows the levels of bone for-mation (OC) and bone resorption (DPD) markers at the end of the experiment. Plasma OC was reduced in the ER groups (P¼ 0·029) compared to N groups. A similar trend was observed in the PER animals. Moreover, OC levels tended to be higher with casein consumption (P¼ 0·072) than with WP intake. The urinary DPD excretion rate was decreased with both dietary restrictions, compared to the N diets (P, 0·0001), and ER animals excreted significantly less DPD than PER rats. Furthermore, using linear regression anal-ysis, a positive correlation (r 0·543, P, 0·0001) was estab-lished between formation and resorption markers.
Plasma Insulin-like growth factor-1. Plasma IGF-1 con-centrations (Fig. 4) were lower in the PER and ER groups compared to the N groups (P¼ 0·001). This decrease in IGF-1 levels was not correlated with the amount of dietary protein. The interaction between dietary restriction and pro-tein effects was significant (P¼ 0·014), with the following relative ranking: (N-WP) ¼ (N-C) ¼ (ER-WP) ¼ (PER-C) . (ER-(PER-C) ¼ (PER-WP).
Calcium excretion. No statistical change in urinary Ca excretion was recorded in the groups (data not shown).
Discussion
Nutritional deficiencies often occur in the elderly and energy and protein undernutrition have been suggested to alter bone health and to increase the risk of osteoporotic fractures. Several studies have assessed the impact of dietary restrictions on bone14 – 18,32,34 – 38. However, these studies differ widely in their experimental design, duration, age at onset of restriction and diet composition. Thus, based on these, it is difficult to interpret the effects of dietary restrictions on the skeleton during ageing and to dissociate the respective effects of pro-tein and energy deficiency. To our knowledge, this study is the first to test the effects of protein quality and quantity on bone status during ageing in rats.
Our experimental model was the aged male Wistar rat, which has been established as a relevant model for age-related bone loss in human subjects39. The severity of dietary restric-tion (40 %) was based on previous rodent studies17,34,35,40. During the experimental period, body weight markedly decreased with both dietary restrictions (a 23 % change com-pared to the controls; Fig. 1). In the statistical analysis, body weight was included as an independent variable to ensure the assessment of dietary restriction and protein type indepen-dently of its variations. Weight loss has been demonstrated to result in decreased BMD as a consequence of reduced mech-anical loading, altered hormone levels and dietary factors, and changes in bone composition16,32,34,36,38. Some authors express bone parameters per 100 g body weight16,18,37, which skews the data. Therefore, it remains unclear if there is a direct relationship between body weight and BMD, and whether this link is age-dependent and similar at weight-bearing and non-weight-bearing sites.
Fig. 2. Effect of dietary restrictions (normal(N)/protein and energy restricted (PER)/energy restricted (ER)) and the type of protein provided in the diet (casein (C)/whey protein (WP)) on (a) total, (b) diaphyseal and (c) metaphy-seal femoral BMD and femoral biomechanical resistance (d). Values are expressed as means with their standard errors indicated by vertical bars. Two-way ANCOVA indicates a significant effect of dietary restriction on total and diaphyseal BMD (P¼ 0·020 and P¼ 0·016 respectively) and on femoral failure load (P¼ 0·013), a non-significant effect of protein type and no inter-action between the two variables. * Mean values significantly different from the N groups.
Protein intake and energy deficiency in rat 767
British
Journal
of
Nutrition
Downloaded from https://www.cambridge.org/core . IP address: 118.70.52.165 , on 24 Jun 2021 at 12:10:18, subject to the Cambridge Core terms of use, available at
https://www.cambridge.org/core/terms
.
Table 2. Effect of dietary restrictions (normal (N)/protein-energy restricted (PER)/energy restricted (ER)) and the type of protein provided in the diet (casein (C)/whey protein (WP)) on histomorphometry of cancellous bone at the distal femoral metaphysis and of cortical bone at the femoral diaphysis
N PER ER Statistical significance, effect of:
C WP C WP C WP Dietary restriction (N/PER/ER) Protein (C/WP) Dietary restriction £ protein Trabecular bone BV: TV (%) Mean 3·9‡ 3·1 5·3‡ 3·1 2·9†‡ 2·2† P¼ 0·043 P¼ 0·045 NS SEM 0·07 0·05 0·09 0·02 0·03 0·04 Tb.Th (mm) Mean 46·4 40·3 38·4 43·5 25·3*† 27·8*† P¼ 0·009 NS NS SEM 0·7 0·2 0·8 0·6 0·1 0·1 Tb.N Mean 10·9‡ 8·3 13·1‡ 7·9 12·4‡ 9·5 NS P¼ 0·009 NS SEM 1·1 1·7 1·4 0·9 1·6 1·4 Tb.Sp (mm) Mean 1·24 1·19 0·73 1·36 0·92 1·04 NS NS NS SEM 0·18 0·22 0·09 0·17 0·10 0·15 Cortical bone T.Ar (mm2) Mean 17·33 18·50 15·80* 15·88* 15·96* 15·78* P ¼ 0·053 NS NS SEM 0·56 0·38 0·65 0·71 0·52 0·59 Ma.Ar (mm2) Mean 5·55 6·31 5·16 6·05 4·99 4·82 NS NS NS SEM 0·46 0·79 0·42 0·66 0·37 0·25 Ct.Ar (mm2) Mean 11·78 12·19 10·64* 9·82* 10·97* 10·96* P¼ 0·022 NS NS SEM 0·40 0·78 0·33 0·50 0·32 0·43
BV, bone volume; TV, tissue volume; Tb.Th, trabecular thickness; Tb.N, trabecular number; Tb.Sp, trabecular separation; T.Ar, tissue area; Ma.Ar, marrow area; Ct.Ar, cortical area.
Two-way ANCOVA was performed. Comparison between dietary restrictions (N/PER/ER): * significantly different from the N groups; † significantly different from the PER groups. Comparison between protein types (C/WP): ‡ signifi-cantly different from the WP groups.
J. Mardon et al. Downloaded from https://www.cambridge.org/core . IP address: 118.70.52.165 , on 24 Jun 2021 at 12:10:18
, subject to the Cambridge Core terms of use, available at
https://www.cambridge.org/core/terms
.
Femoral BMD was significantly lower in energy and pro-tein-energy restricted animals (Fig. 2). This result is consistent with the observations in old rats of Talbott et al.17 and Lee et al.15who reported decreased BMD and bone mineral con-tent in response to dietary restriction. Sanderson et al.16and
Black et al.38 also observed a detrimental effect of dietary restriction on bone in rats and monkeys, but this effect was only attributed to body weight variation. In contrast to these results, our data support the view that BMD variations are not related to body weight reduction, as demonstrated by the ANCOVA analysis. Our results are consistent with those pub-lished by LaMothe et al.18, who demonstrated that the impaired tibia structural properties associated with energy restriction were independent of body mass. Therefore, diet-ary-induced modulation of hormonal factors is likely to con-tribute to these variations.
BMD changes may be explained by several factors. At the metaphyseal site, the trend recorded for metaphyseal BMD was associated with a decrease in bone volume in the ER ani-mals (Table 2). This decrease in bone volume:total tissue volume seems to be the result of a lower trabecular thickness, whereas trabecular number and separation were unchanged. Surprisingly, no changes were seen in the PER groups. Thus, energy restriction alone seems to have a more pro-nounced effect than simultaneous protein and energy restric-tion. In contrast, Bourrin et al.41 reported a decrease in trabecular thickness in the tibia proximal metaphysis in response to protein restriction, as well as a decrease in BMD. However, the applied restriction was far more severe (protein level 2·5 %) than in the present study (protein level 10·2 %). In this study, the amount of dietary protein modulated the trabecular volume, but was not correlated with the BMD data. At the diaphyseal site (Table 2), the low BMD recorded in the restricted animals is consistent with a lower cortical tissue area. This indicates a decreased diaphyseal width and a lower diaphyseal cortical area. Both parameters are highly correlated with diaphyseal BMD (r 0·416, P ¼ 0·005 and r 0·716, P, 0·0001, respectively). Cortical area changes resulted in altered femoral biomechanical properties in the restricted rats (r 0·586, P, 0·0001). Nnakwe42 and Talbott et al.17similarly identified a decline in ultimate bone strength in rats fed a 40 % restricted diet.
Our results clearly indicate that energy and protein undernu-trition affect bone status in aged rats. Nevertheless, adequate protein intake did not prevent the detrimental effects of energy restriction. Indeed, no difference was noted between PER and ER with respect to femoral BMD and the corre-sponding mechanical data (Fig. 2(a)). Similarly, Bourrin et al.41reported a decrease in BMD and bone strength with protein restriction in aged male rats. Ammann et al.20 showed that bone strength was reduced by a low protein diet (only 2·5 % protein in the diet) in adult female ovariectomised rats. However, the consumption of an isoenergic essential amino acid supplement corrected these variations.
The values for the physical bone measurements were associated with a decrease in both bone formation and resorp-tion markers (Fig. 3). The plasma OC levels tended to decrease in the PER groups and reached significant values in the ER groups, indicating a reduced bone formation rate. Simi-larly, lower urinary DPD excretion rates were recorded in the restricted animals (PER and ER), suggesting a reduced bone resorption. The bone metabolism data were not consistent with the BMD values, and did not explain the decrease in femoral BMD. Indeed, there was no bone remodelling imbal-ance. This difference might be due to the fact that the DPD and OC assays were carried out on samples collected on the
Fig. 4. Effect of dietary restrictions (normal(N)/protein and energy restricted (PER)/energy restricted (ER)) and the type of protein provided in the diet (casein (C)/whey protein (WP)) on plasma insulin-like growth factor 1 (IGF-1) concentrations. Values are expressed as means with their standard errors indicated by vertical bars. Two-way ANOVA indicates a significant effect of dietary restriction on IGF-1 levels (P¼ 0·001), a non-significant effect of pro-tein type and a significant effect of the interaction between the two variables (P¼ 0·014). * Mean values significantly different from the N groups. ‡ Mean values significantly different from the other groups.
Fig. 3. Effect of dietary restrictions (normal(N)/protein and energy restricted (PER)/energy restricted (ER)) and the type of protein provided in the diet (casein (C)/whey protein (WP)) on plasma osteocalcin (a) and the urinary deoxypyridinoline (DPD) excretion rate (b). Values are expressed as means with their standard errors indicated by vertical bars. Two-way ANOVA indi-cates a significant effect of dietary restriction on osteocalcin and DPD levels (P¼ 0·029 and P, 0·001 respectively), a non-significant effect of protein type and no interaction between the two variables. * Mean values significantly different from the N groups. † Mean values significantly different from the PER groups.
Protein intake and energy deficiency in rat 769
British
Journal
of
Nutrition
Downloaded from https://www.cambridge.org/core . IP address: 118.70.52.165 , on 24 Jun 2021 at 12:10:18, subject to the Cambridge Core terms of use, available at
https://www.cambridge.org/core/terms
.
last day of the experiment. Thus, these reflect the bone status at this specific time point, whereas the BMD variations reflect effects accumulated over the entire duration of the experiment. The exact impact of dietary restrictions on bone biomarkers will require further studies as previous reports have shown conflicting results32,34,43.
Protein restriction (10·2 %, compared to the normal level of 17 %) did not change the plasma OC levels (Fig. 3), whereas the DPD levels were significantly lower in the PER groups than in the ER groups. It seems that the PER diets induced more resorption than the ER conditions, but this was not cor-related with the BMD values. Using different nutritional con-ditions, Bourrin et al.41demonstrated that protein deprivation (2·5 % v. 15 %) was associated with a decrease in OC levels from the first week of deficiency, while urinary DPD remained unchanged throughout the experiment.
Dietary restrictions (PER and ER) were associated with lower plasma IGF-1 levels (Fig. 4). Nutritional status (especially energy and dietary protein intake) is a critical factor in the regulation of circulating IGF-1 levels44. Consid-ering the bone anabolic effect of IGF-145, this decrease might explain, at least in part, the changes in femoral BMD and bone biomarkers. This is supported by the positive correlations between IGF-1 levels and BMD (r 0·350, P ¼ 0·025), cortical area (r 0·353, P ¼ 0·032) and biomechanical properties (r 0·317, P ¼ 0·043), respectively.
In this study, the IGF-1 levels did not vary significantly between the two protein intake levels (PER and ER) (Fig. 4). Yet, dietary proteins are known to influence both the pro-duction and action of IGF-146. Plasma IGF-1 levels have been shown to decrease with protein restriction41,44,47 and Ammann et al.19 suggested that an impaired IGF-1 system leads to decreased bone mineral mass and fragility under pro-tein deprivation. However, these conclusions are based on data from animals fed a 2·5 % casein diet, which is a drastic depri-vation. No significant changes were detected in bone par-ameters and plasma IGF-1 levels in rats fed diets containing more than 5 % protein. This is in agreement with our observations.
The PER-WP and ER-C groups exhibited lower plasma IGF-1 levels. This could be attributed to time-dependent vari-ations between casein and WP digestion21,48. The IGF-1 levels were most likely reduced in the PER-WP group because of the faster absorption rate of WP compared to casein.
Overall, protein quality had little impact on bone status. Nevertheless, rats fed the casein diets exhibited a high number of trabeculae than the WP-fed animals, resulting in an increased bone volume (Table 2). A parallel response was seen in total BMD (P ¼ 0·073) and plasma OC (P ¼ 0·072), even if the trends were not statistically signifi-cant. In previous studies of rats, dietary casein was demon-strated to stimulate bone mineralisation by improving Ca deposition in bone and inhibiting bone resorption27,49. In con-trast, in mini-pigs casein-derived casein phosphopeptides had only marginal effects on bone mineral content28.
According to our data, WP consumption did not improve bone status more effectively than casein. Paradoxically, Takada et al.23 found that WP consumption increased the breaking strength and suppressed bone resorption in ovari-ectomised female rats. Similarly, Kelly et al.24demonstrated that WP intake increased alkaline phosphatase activity and
IGF-1 mRNA levels in young rats, suggesting enhanced bone formation. In the present study, protein quality had no effect on the OC and plasma IGF-1 levels. These differences can be attributed to the age of our experimental animals (21 months), because ageing is associated with impaired IGF-1 secretion50, resulting from perturbations to the hypotha-lamo – adenohypophysial – somatotrope axis44,51.
Urinary Ca excretion was unchanged with the different types of protein. However, casein was previously shown to enhance Ca absorption, due to the bioactive casein phospho-peptides resulting from the digestive breakdown of casein28. In contrast, other studies found no stimulating effect of casein phosphopeptides on intestinal Ca absorption, neither in rats52 nor in human subjects53. Zhao et al.54 reported a Ca absorption-enhancing effect of WP intake, but it was absent during long-term WP-feeding. The lack of variation in Ca absorption in this study could be due to adaptation, which would eliminate the stimulating effect of dietary casein and WP. As suggested in the Zhao study, this effect could be consistent with a down regulation of active Ca absorption, through a suppression of the parathyroid hormone – vitamin D axis, in response to the initial increase in Ca absorption during chronic feeding. In our opinion, the lack of variation in this study may be due to modulation of passive and active Ca transport during ageing. Indeed, it is well-established that ageing often is associated with impaired Ca absorption as well as vitamin D deficiency and this can result in secondary hyperparathyroidism55.
To summarise, protein – energy restriction and energy restriction alone induced lower femoral BMD and impaired biomechanical properties, compared to controls, indepen-dently of body weight variations. Our study confirms that nutritional deficiencies may contribute to age-related bone loss, since lower BMD and biomechanical resistance are associated with an increased risk of bone fracture. These changes could be attributed to a decrease in IGF-1 levels, but the exact mechanisms need to be identified. No bone-sparing effect has been reported when energy restriction is associated with an adequate protein intake. Under our exper-imental conditions, neither casein nor WP appear to prevent the detrimental effects of dietary restrictions on bone mass. Nevertheless, diets providing casein seem to preserve bone health more efficiently than those containing WP, as judged by BMD and histomorphometry. In this study, min-eral intake was standardised in every group, which is important because energy and protein undernutrition often are associated with Ca deficiency in the elderly. It is concei-vable that disruption in dietary Ca intake, in addition to energy and protein restriction, could have a more pro-nounced effect on bone metabolism.
References
1. Heaney RP & Weaver CM (2003) Calcium and vitamin D. Endocrinol Metab Clin North Am 32, 181 – 194, vii – viii. 2. Donini LM, Savina C & Cannella C (2003) Eating habits
and appetite control in the elderly: the anorexia of aging. Int Psychogeriatr 15, 73 – 87.
3. Wilkins CH & Birge SJ (2005) Prevention of osteoporotic frac-tures in the elderly. Am J Med 118, 1190 – 1195.
British
Journal
of
Nutrition
. IP address: 118.70.52.165 , on 24 Jun 2021 at 12:10:18, subject to the Cambridge Core terms of use, available at
https://www.cambridge.org/core/terms
.
4. Lumbers M, New SA, Gibson S & Murphy MC (2001) Nutri-tional status in elderly female hip fracture patients: comparison with an age-matched home living group attending day centres. Br J Nutr 85, 733 – 740.
5. Bonjour J, Schu¨rch MA & Rizzoli R (1997) Nutritional aspects of hip fractures. Bone 18, Suppl. 3, 139S – 144S.
6. Ilich JZ & Kerstetter JE (2000) Nutrition in bone health revisited: a story beyond calcium. J Am Coll Nutr 19, 715 – 737. 7. Bonjour JP (2005) Dietary protein: an essential nutrient for bone
health. J Am Coll Nutr 24, 526S – 536S.
8. Albright F, Smith PH & Richardson AM (1941) Postmenopausal osteoporosis. J Am Med Assoc 116, 2465 – 2474.
9. Hannan MT, Tucker KL, Dawson-Hughes B, Cupples LA, Felson DT & Kiel DP (2000) Effect of dietary protein on bone loss in elderly men and women: the Framingham Osteo-porosis Study. J Bone Miner Res 15, 2504 – 2512.
10. Devine A, Dick IM, Islam AF, Dhaliwal SS & Prince RL (2005) Protein consumption is an important predictor of lower limb bone mass in elderly women. Am J Clin Nutr 81, 1423 – 1428. 11. Coin A, Sergi G, Beninca P, Lupoli L, Cinti G, Ferrara L,
Benedetti G, Tomasi G, Pisent C & Enzi G (2000) Bone mineral density and body composition in underweight and normal elderly subjects. Osteoporos Int 11, 1043 – 1050.
12. Delmi M, Rapin CH, Bengoa JM, Delmas PD, Vasey H & Bonjour JP (1990) Dietary supplementation in elderly patients with fractured neck of the femur. Lancet 335, 1013 – 1016. 13. Schurch MA, Rizzoli R, Slosman D, Vadas L, Vergnaud P &
Bonjour JP (1998) Protein supplements increase serum insu-lin-like growth factor-I levels and attenuate proximal femur bone loss in patients with recent hip fracture. A randomized, double-blind, placebo-controlled trial. Ann Intern Med 128, 801 – 809.
14. McCay C, Crowell M & Maynard L (1935) The effect of retarded growth upon the length of life span and upon the ulti-mate body size. J Nutr 10, 63 – 79.
15. Lee C, Panemangalore M & Wilson K (1986) Effect of dietary energy restriction on bone mineral content of mature rats. Nutr Res 6, 51 – 59.
16. Sanderson JP, Binkley N, Roecker EB, Champ JE, Pugh TD, Aspnes L & Weindruch R (1997) Influence of fat intake and caloric restriction on bone in aging male rats. J Gerontol A Biol Sci Med Sci 52, B20 – B25.
17. Talbott SM, Cifuentes M, Dunn MG & Shapses SA (2001) Energy restriction reduces bone density and biomechanical properties in aged female rats. J Nutr 131, 2382 – 2387. 18. LaMothe JM, Hepple RT & Zernicke RF (2003) Selected
con-tribution: Bone adaptation with aging and long-term caloric restriction in Fischer 344 £ Brown-Norway F1-hybrid rats. J Appl Physiol 95, 1739 – 1745.
19. Ammann P, Bourrin S, Bonjour JP, Meyer JM & Rizzoli R (2000) Protein undernutrition-induced bone loss is associated with decreased IGF-I levels and estrogen deficiency. J Bone Miner Res 15, 683 – 690.
20. Ammann P, Laib A, Bonjour JP, Meyer JM, Ruegsegger P & Rizzoli R (2002) Dietary essential amino acid supplements increase bone strength by influencing bone mass and bone microarchitecture in ovariectomized adult rats fed an isocaloric low-protein diet. J Bone Miner Res 17, 1264 – 1272.
21. Boirie Y, Dangin M, Gachon P, Vasson MP, Maubois JL & Beaufrere B (1997) Slow and fast dietary proteins differently modulate postprandial protein accretion. Proc Natl Acad Sci USA 94, 14930 – 14935.
22. Dangin M, Boirie Y, Guillet C & Beaufrere B (2002) Influence of the protein digestion rate on protein turnover in young and elderly subjects. J Nutr 132, 3228S – 3233S.
23. Takada Y, Kobayashi N, Kato K, Matsuyama H, Yahiro M & Aoe S (1997) Effects of whey protein on calcium and
bone metabolism in ovariectomized rats. J Nutr Sci Vitaminol (Tokyo) 43, 199 – 210.
24. Kelly O, Cusack S & Cashman KD (2003) The effect of bovine whey protein on ectopic bone formation in young growing rats. Br J Nutr 90, 557 – 564.
25. Reeves PG (1997) Components of the AIN-93 diets as improve-ments in the AIN-76A diet. J Nutr 127, 838S – 841S.
26. Etcheverry P, Wallingford JC, Miller DD & Glahn RP (2004) Calcium, zinc, and iron bioavailabilities from a commercial human milk fortifier: a comparison study. J Dairy Sci 87, 3629 – 3637.
27. Sato R, Noguchi T & Naito H (1986) Casein phosphopeptide (CPP) enhances calcium absorption from the ligated segment of rat small intestine. J Nutr Sci Vitaminol (Tokyo) 32, 67 – 76.
28. Scholz-Ahrens KE & Schrezenmeir J (2000) Effects of bio-active substances in milk on mineral and trace element metab-olism with special reference to casein phosphopeptides. Br J Nutr 84, Suppl 1, S147 – S153.
29. Pugh TD, Klopp RG & Weindruch R (1999) Controlling caloric consumption: protocols for rodents and rhesus monkeys. Neurobiol Aging 20, 157 – 165.
30. Turner CH & Burr DB (1993) Basic biomechanical measure-ments of bone: a tutorial. Bone 14, 595 – 608.
31. Parfitt AM, Drezner MK, Glorieux FH, Kanis JA, Malluche H, Meunier PJ, Ott SM & Recker RR (1987) Bone histomorphome-try: standardization of nomenclature, symbols, and units. Report of the ASBMR Histomorphometry Nomenclature Committee. J Bone Miner Res 2, 595 – 610.
32. Lane MA, Black A, Handy AM, Shapses SA, Tilmont EM, Kiefer TL, Ingram DK & Roth GS (2001) Energy restriction does not alter bone mineral metabolism or reproductive cycling and hormones in female rhesus monkeys. J Nutr 131, 820 – 827. 33. Maffei M, Halaas J, Ravussin E, et al. (1995) Leptin levels in human and rodent: measurement of plasma leptin and ob RNA in obese and weight-reduced subjects. Nat Med 1, 1155 – 1161.
34. Talbott SM, Rothkopf MM & Shapses SA (1998) Dietary restriction of energy and calcium alters bone turnover and den-sity in younger and older female rats. J Nutr 128, 640 – 645. 35. Brochmann Murray EJ, Beamer WG, Duarte ME, Behnam K,
Grisanti MS & Murray SS (2001) Effects of dietary restriction on appendicular bone in the SENCAR mouse. Metabolism 50, 436 – 442.
36. Brochmann EJ, Duarte ME, Zaidi HA & Murray SS (2003) Effects of dietary restriction on total body, femoral, and vertebral bone in SENCAR, C57BL/6, and DBA/2 mice. Metabolism 52, 1265 – 1273.
37. Lambert J, Lamothe JM, Zernicke RF, Auer RN & Reimer RA (2005) Dietary restriction does not adversely affect bone geome-try and mechanics in rapidly growing male wistar rats. Pediatr Res 57, 227 – 231.
38. Black A, Allison DB, Shapses SA, Tilmont EM, Handy AM, Ingram DK, Roth GS & Lane MA (2001) Calorie restriction and skeletal mass in rhesus monkeys (Macaca mulatta): evi-dence for an effect mediated through changes in body size. J Gerontol A Biol Sci Med Sci 56, B98 – B107.
39. Schapira D, Lotan-Miller R, Barzilai D & Silbermann M (1991) The rat as a model for studies of the aging skeleton. Cells Mater Suppl. 1, 181 – 188.
40. Kalu DN, Hardin RR, Cockerham R, Yu BP, Norling BK & Egan JW (1984) Lifelong food restriction prevents senile osteo-penia and hyperparathyroidism in F344 rats. Mech Ageing Dev 26, 103 – 112.
41. Bourrin S, Toromanoff A, Ammann P, Bonjour JP & Rizzoli R (2000) Dietary protein deficiency induces osteoporosis in aged male rats. J Bone Miner Res 15, 1555 – 1563.
Protein intake and energy deficiency in rat 771
British
Journal
of
Nutrition
Downloaded from https://www.cambridge.org/core . IP address: 118.70.52.165 , on 24 Jun 2021 at 12:10:18, subject to the Cambridge Core terms of use, available at
https://www.cambridge.org/core/terms
.
42. Nnakwe NE (1998) The effect of age and dietary restriction on bone strength, calcium and phosphorus contents of male F344 rats. J Nutr Health Aging 2, 149 – 152.
43. Ndiaye B, Cournot G, Pelissier MA, Debray OW & Lemonnier D (1995) Rat serum osteocalcin concentration is decreased by restriction of energy intake. J Nutr 125, 1283 – 1290.
44. Thissen JP, Ketelslegers JM & Underwood LE (1994) Nutritional regulation of the insulin-like growth factors. Endocr Rev 15, 80 – 101.
45. Clemmons DR & Underwood LE (1991) Nutritional regulation of IGF-I and IGF binding proteins. Annu Rev Nutr 11, 393 – 412. 46. Isley WL, Underwood LE & Clemmons DR (1983) Dietary components that regulate serum somatomedin-C concentrations in humans. J Clin Invest 71, 175 – 182.
47. VandeHaar MJ, Moats-Staats BM, Davenport ML, Walker JL, Ketelslegers JM, Sharma BK & Underwood LE (1991) Reduced serum concentrations of insulin-like growth factor-I (IGF-I) in protein-restricted growing rats are accompanied by reduced IGF-I mRNA levels in liver and skeletal muscle. J Endocrinol 130, 305 – 312.
48. Mahe S, Roos N, Benamouzig R, Davin L, Luengo C, Gagnon L, Gausserges N, Rautureau J & Tome D (1996) Gastrojejunal kinetics and the digestion of [15N]beta-lactoglobulin and casein in humans: the influence of the nature and quantity of the protein. Am J Clin Nutr 63, 546 – 552.
49. Matsui T, Yano H, Awano T, Harumoto T & Saito Y (1994) The influences of casein phosphopeptides on metabolism of ectopic bone induced by decalcified bone matrix implantation in rats. J Nutr Sci Vitaminol (Tokyo) 40, 137 – 145.
50. Hammerman MR (1987) Insulin-like growth factors and aging. Endocrinol Metab Clin North Am 16, 995 – 1011.
51. Sonntag WE, Lenham JE & Ingram RL (1992) Effects of aging and dietary restriction on tissue protein synthesis: relationship to plasma insulin-like growth factor-1. J Gerontol 47, B159 – B163.
52. Brommage R, Juillerat M & Jost R (1991) Influence of casein phosphopeptide and lactulose on intestinal calcium absorption in adult female rats. Lait 71, 173 – 180.
53. Teucher B, Majsak-Newman G, Dainty JR, McDonagh D, FitzGerald RJ & Fairweather-Tait SJ (2006) Calcium absorption is not increased by caseinophosphopeptides. Am J Clin Nutr 84, 162 – 166.
54. Zhao Y, Martin BR, Wastney ME, Schollum L & Weaver CM (2005) Acute versus chronic effects of whey proteins on calcium absorption in growing rats. Exp Biol Med (Maywood) 230, 536 – 542.
55. Lips P (2001) Vitamin D deficiency and secondary hyperpar-athyroidism in the elderly: consequences for bone loss and fractures and therapeutic implications. Endocr Rev 22, 477 – 501.
British
Journal
of
Nutrition
. IP address: 118.70.52.165 , on 24 Jun 2021 at 12:10:18, subject to the Cambridge Core terms of use, available at
https://www.cambridge.org/core/terms
.