Detection of Protein Structure of Frozen
Ancient Human Remains Recovered from
a Glacier in Canada Using Synchrotron
Fourier Transform Infrared Microspectroscopy
Luca Quaroni,1 Colleen R. Christensen,2 Becky Chen,3Wayne Vogl,4and Maria Victoria Monsalve3,*
1Paul Scherrer Institut, Villigen-PSI CH-5232, Switzerland
2College of Agriculture and Bioresources, University of Saskatchewan, Saskatoon, SK, Canada S7N 5A8
3Department of Pathology and Laboratory Medicine, University of British Columbia, Vancouver, BC, Canada V6T 1Z3 4Department of Cellular and Physiological Sciences, University of British Columbia, Vancouver, BC, Canada V6T 1Z3
Abstract: We previously used synchrotron infrared microspectroscopy to describe the biochemical signature of skeletal muscle ~biceps brachii! from the frozen ancient remains of a young man. In this current paper, we use light microscopy to assess the state of preservation of cellular components in the trapezius muscle from these same ancient remains and then use mid-infrared analysis at the Canadian Light Source synchrotron facility to further analyze the tissue. We compare spectra between the trapezius samples from the ancient remains and a recently deceased cadaver ~control!. Infrared spectra indicate preservation of secondary structure, with the a-helix being the principal component, along with triple helical portions of the protein backbone. Our mid-infrared analysis indicates an energy reserve in the skeletal muscle in the ancient remains.
Key words: Kwäday Dän Ts’ìnchi, skeletal muscle, synchrotron, biochemical structure, protein, glacier
I
NTR ODUCTIONKwäday Dän Ts’ìnchi ~KDT! is the name given by the aboriginal people to the human remains, radiocarbon dated 1670–1850 AD, that were found in a glacier in Northern British Columbia in 1999 ~Beattie et al., 2000!.
Previous microbiochemical quantitative analysis ~nitro-gen and carbon content! indicated good preservation of pro-teinaceous material in tissue samples from the ancient remains ~Monsalve et al., 2002, 2003!. Using light micros-copy, we identified striations in soft tissues ~Monsalve et al., 2008!. Using electron microscopy, we identified fibrillar col-lagen in lung, heart, and arm tissues ~Monsalve et al., 2008!. Biochemical fingerprints of cellular structures can pro-vide qualitative information about complex molecules such as lipids and proteins. Using mid-infrared microspectros-copy at the Canadian Light Source, we recently analyzed the biochemical signature of skeletal muscle tissue samples from biceps brachii to gain insights into the state of preservation of the ancient remains ~Christensen et al., 2011!. Infrared spectra indicated the potential presence of adipocere forma-tion, a water-insoluble material formed by the slow hydro-lysis of fats in decomposing material, and collagen within the biceps brachii tissue; there was no indication of freeze/ thaw damage in the protein structures ~Christensen et al., 2011!. The suggested presence of adipocere was recently confirmed using gas chromatography ~Liu et al., 2010!.
To build on our previous observations, we used Fourier transform infrared ~FTIR! microspectroscopy with
synchro-tron radiation to obtain additional information about sev-eral properties of biological molecules in ancient tissue and compare them with a control tissue. Our main objectives were to assess whether the mummification process has induced major conformational changes in the most abun-dant protein and to evaluate the viability of identifying residual major protein components ~e.g., myosin in muscu-lar cells!. To accomplish these objectives, we quantified the average protein secondary structure in different portions of the sample by identifying the structure of amide bands throughout the sample.
M
ATERIALS ANDM
ETHODSTo study the state of preservation of tissues of the ancient remains and compare it with a control we analyzed: ~1! col-lagen and skeletal muscle tissues in the trapezius by electron microscopy, and ~2! cellular spatial dimensions by utilizing mid-infrared two-dimensional ~2D! mapping with a synchro-tron light source.
Sample Preparation
The protocol and consent form for the study of KDT was approved by the Clinical Research Ethics Board Committee at the University of British Columbia ~UBC!. Standard precautions were taken to minimize contamination from contemporary sources. The ancient remains from which the trapezius muscle samples came were kept at ⫺808C. The trapezius muscle from a recently deceased unembalmed male cadaver donated for education and research purposes to the Faculty of Medicine at UBC was used as the control
Received March 1, 2013; accepted March 7, 2013
*Corresponding author. E-mail: [email protected]
M
icroscopy
M
icroanalysis
for this study. Both ancient and control samples were ex-cised with a sterile scalpel.
Trapezius samples ~0.5 g! from the ancient remains and the control were fixed in formalin before embedding them in paraffin. The paraffin blocks were sectioned with a micro-tome at 15-mm thickness. The slides were stained with hematoxylin and eosin ~H&E!, Van Gieson and Masson trichrome.
For infrared analysis paraffin blocks that were used for histological staining were also used for cutting 5-mm sec-tions. These sections were mounted on low-emittance slides ~low-e IR microscope slides; Kevley Technologies, Chester-land, OH, USA! and baked in an oven for 2 h. The paraffin from all sections was removed with xylene.
To assist in locating a region of interest on the low-emittance slide, the stained histological slides were loaded onto an Imagescope ~Aperio, Vista, CA, USA!. Regions of muscle and collagen identified on each stained slide area were selected for scanning. The slides and the images ob-tained with the Imagescope were sent to the Canadian Light Source Inc. ~Saskatoon, SK, Canada! for microspectroscopy with synchrotron mid-infrared radiation.
Mid-Infrared Data Collection
The 01B1-1 beamline of the Canadian Light Source Inc., equipped with a microspectrometer, was utilized to obtain mid-infrared spectra and to create 2D maps of biological macromolecules from the ancient remains and recently deceased cadaver tissues. Data were collected via a Hyperion microscope with programmable mapping stage and CCD camera, using a Bruker IFS 66v/S Series IR spectrophotom-eter ~Bruker Optics Inc., Billerica, MA, USA! mounted on the dedicated IR synchrotron beamline.
Spectral data were collected in the mid-infrared range of 4,000–800 cm⫺1 at a resolution of 4 cm⫺1 and an aperture setting of 10 ⫻ 10 mm. Background and sample spectra were produced from 1,024 and 128 co-added scans, respectively. Background spectra were taken from a clean area of the slide just to the outside of the specimen. 2D organic functional group maps were measured by raster scanning the IR microscope stage in 5-mm increments along the X and Y axes.
Data Processing and Analysis
Automated stage control, spectrum data collection, and processing were performed using OPUS version 6.5 ~Bruker Optics Inc., Billerica, MA, USA!. Each sample spectrum was preprocessed in absorbance to produce second derivative spectra. 2D spectral feature maps were plotted from the amplitude of the negative central peak. As a consequence, larger negative values in the maps correspond to larger functional group absorption.
R
ESULTSAmong the histological stains, the trapezius tissue from the ancient remains lacked the regular ordered morphology and
structure of skeletal muscle. Nonetheless, the stains helped to identify specific components that are found within skel-etal muscle. It was evident that collagen was the most abundant component within the ancient tissue sample, and hence the best preserved component under the extreme cold temperature of the ancient remains’ environment. Using H&E staining, it was often difficult to discern between muscle and connective tissue in the trapezius tissue. In the control tissues, regular cross-striations in longitudinal sec-tions were clearly evident on muscle fibers. Both the Van Gieson and Masson trichrome staining techniques demon-strated the presence of muscle and collagen in the ancient tissues and in control tissues.
Tissue from the trapezius of the ancient remains was analyzed by synchrotron FTIR microspectroscopy and com-pared with the corresponding control tissue. Measurement of absorption spectra at microscopic locations allows local-ization of molecular components within specific structures of tissue anatomy ~Diem et al., 2008!. A synchrotron source was used to maximize the signal-to-noise ratio at diffraction-limited spatial resolution, thus allowing resolution of fine spectral details from small features of the sample ~Miller et al., 2003!.
Mapping of various areas of the trapezius samples was performed, together with measurements of several individ-ual spectra. Spectra showing strong baseline distortion, mostly because of the presence of irregular sample topogra-phy in the measurement position ~such as an edge or a grain!, were discarded.
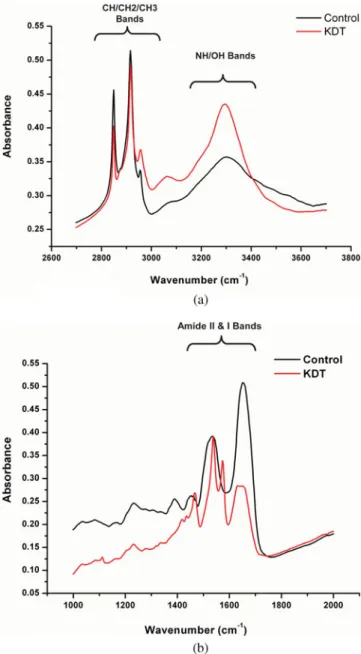
Spectra that showed clear band saturation, observed in the ancient tissue remains where sample thickness in spe-cific locations was excessive because of irregular fragmenta-tion of the tissue during cutting, were also discarded. In the first approach, we averaged the spectra recorded over an extended portion of the tissue, to provide an overview of the gross molecular composition throughout the tissue por-tion, without reference to individual microscopic structures or locations. To this purpose, we averaged 300 spectra from the ancient samples and 300 from the control ones. Figure 1 shows the average absorption spectra from extended por-tions of the trapezium of control and the ancient tissues.
Comparison of average spectra in the 2,700–3,700 cm⫺1 interval reveals considerable similarity between the control and ancient remains tissue samples. The strong multiplet of bands between 2,800 and 3,100 cm⫺1arises from the absorp-tion of C–H bonds. In a tissue sample, absorpabsorp-tion in this region is usually dominated by contribution from the CH2
groups in long alkyl chains, such as those found in phospho-lipids, sphingophospho-lipids, triglycerides, and free fatty acids, which give rise to two strong peaks at about 2,854 and 2,923 cm⫺1 ~Diem et al., 2008!.
The abundance of long-chain hydrocarbon groups is similar between the control and ancient tissues. Two weaker but sharp absorption peaks at 2,872 and 2,955 cm⫺1 are contributions from –CH3groups. Their intensity relative to
the –CH2– doublet is affected by: ~1! the length of alkyl
contri-bution from –CH3groups, and ~2! the degree of order of
the chains themselves, with cis conformers having a stron-ger relative contribution from –CH3 absorption ~Tamm &
Tatulian, 1997!. In comparing the spectra in Figure 1a, we noted that on average the alkyl groups from the ancient tissue remains are shorter and/or characterized by a less ordered conformation than in control tissue.
It is important to note that the process of paraffin removal required for sample preparation involves washing with xylene. In addition to removing paraffin, this treat-ment also removes other hydrophobic molecules, such as triglycerides, cholesterol, and cholesteryl esters. In contrast,
amphipathic molecules, such as phospholipids, are much less affected ~Gazi et al., 2005!. This is confirmed by the observation in our samples of strong bands attributable to long-chain alkyl groups at about 2,854 and 2,923 cm⫺1. The process of xylene washing affects the two classes of samples in a similar way. Therefore, the lipid profile content of the samples, although altered relative to that of the unfixed samples, still allows a comparison of the relative phospho-lipid composition of ancient tissue remains and contempo-rary tissue samples. In contrast, nothing can be said about the composition of the more hydrophobic components, because of more extensive extraction.
The band at 3,069 cm⫺1 is due to absorption from ⫽C–H groups, where hydrogen is bound to unsaturated carbon atoms ~Diem et al., 2008!. When compared with other C–H absorptions, this band is relatively stronger in KDT tissue, indicating the presence of a somewhat higher degree of unsaturation in the ice-preserved tissue.
The presence of unsaturated phospholipid acyl chains is in agreement with the results of gas chromatography– mass spectrometry analysis, showing that about 5% of the fatty acids from ancient trapezium tissue fatty acids have unsaturated chains ~Liu et al., 2010!.
The strong and broad band between 3,200 and 3,400 cm⫺1is a combination of absorption from O–H and N–H groups ~Diem et al., 2008!. The two contributions are difficult to separate. O–H groups give rise to a broad band at about 3,350 cm⫺1, which is the dominant contribution to band shape. In contrast, the contribution from the N–H gives rise to a sharp band at approximately 3,250 cm⫺1, which appears as a shoulder. The contribution from O–H groups has a stronger relative intensity in tissue from the ancient remains. This could be interpreted in several ways, such as the presence of a larger amount of mono- and polysaccharides, and/or the presence of a larger amount of hydrolysis products, such as free fatty acids and alcohols.
Figure 1b compares the average spectra recorded from control trapezius tissue and trapezius tissue from the an-cient remains in the “fingerprint” region. This region con-tains absorption bands from practically all organic functional groups in the sample and is more difficult to interpret at the molecular level. Strong differences in band pattern are evi-dent between the two tissue samples, revealing major differ-ences in composition. The region of carbonyl absorption bands is characterized by amide absorptions, mostly arising from proteins. The strongest amide absorptions, around 1,650 and 1,545 cm⫺1, denominated Amide I and Amide II, respectively, dominate this region in typical spectra from tissue ~Diem et al., 2008!. This pattern is evident in the control tissue sample, where the bands appear at 1,656 and 1,540 cm⫺1. Amide bands are sensitive to the conformation of the polypeptide main chain and therefore to the identity and degree of denaturation of the proteins in the sample. The sample from the ancient tissue remains presents major differences in the band pattern of the amide region. The intensity of these amide bands is, on average, much weaker relative to other bands in the control sample; perhaps this is Figure 1. a: Comparison of the average spectra recorded from
control trapezius tissue and Kwäday Dän Ts’ìnchi ~KDT! trapezius tissue in the 2,700–3,700 cm⫺1 region. The spectra from both samples appear qualitatively similar in this region. b: Comparison of the average spectra recorded from the control trapezius tissue and KDT trapezius tissue in the “fingerprint” region, defined by absorptions bands from practically all molecules in the sample.
an indication that some hydrolysis has occurred. The differ-ence in peak position can be explained by partial denatur-ation of the protein complement. The shape and position of the Amide I band in the ancient tissue sample suggests a greater abundance of b-sheet and disordered folds in the protein complement. The absorption profile in the Amide II region is so different from what is ordinarily observed as to suggest the presence of abundant functional groups other than polypeptides. These bands do not correspond to ab-sorption bands from any of the most abundant molecular components in tissue, that is, they cannot arise from pro-tein, lipid, carbohydrate, or nucleic acid absorption. Inspec-tion of individual spectra shows that they are localized in specific portions of the sample. We suggest that they arise from some unidentified material contaminating the ancient tissue, either during its burial or during recovery and trans-portation. Their presence prevents an accurate use of the spectral region of the Amide II in the spectra of KDT tissue. Analysis of average spectral absorption provides an overview of gross differences in molecular composition of the tissue from the two sources. Nonetheless, it does not provide any information about the spatial distribution of the molecules, nor does it allow visualizing changes local-ized to small areas of the sample or to specific areas of the sample or to the sarcomere, the basic functional structure of the skeletal muscle. In particular, the approach shows its limitation in resolving spectral contributions in portions of the tissue that appear contaminated. To discriminate be-tween specific regions, and to account for the varying distri-bution of biomolecules throughout the complex architecture of the tissue, it was necessary to report spectra associated with single microscopic features and to report the 2D distri-bution of molecules throughout the sample.
Figure 2 shows spectra recorded in specific microscopic locations of the preserved ancient tissue and the control trapezius. A visible light image of the same fragment is also shown for comparison, highlighting the location of the measurement. The morphology of the two sections looks fairly different under visual inspection. The control tissue shows easily recognizable transversal sections of the muscle fiber ~Fig. 2a!. In contrast, the tissue section from the ancient remains affords fewer discernible structures, partly because of fragmentation and folding during sectioning ~Fig. 2b!. Nonetheless, a few areas can be located that resemble, in size and shape, fibril cross-sections.
In both samples, single point spectra in Figures 2c and 2d were recorded in the location of muscular fibers. From their comparison, it is evident that, despite the morpholog-ical changes, the chemmorpholog-ical composition in the fibers from the ancient tissue is well preserved, with the relative inten-sity and profile of all main bands similar to those from the control tissue. This is in contrast to what is observed from the analysis of average spectra. The discrepancy arises from the fact that the averaged spectra of Figure 1 comprise contributions from several different regions of the sample, including heavily degraded areas, whereas the spectra of Figures 2c and 2d arise from much smaller portions of the
samples, about 10 mm in size, that appear to be well preserved.
A detailed comparison of the single point spectra in Figures 2c and 2d reveals some subtle differences. One difference is in the intensity of absorptions attributable to fatty acids, such as phospholipids, 2,854 and 2,923 cm⫺1. When these lipid bands are compared in intensity to protein bands, such as the Amide I and Amide II pair, the ancient tissue appears to have a lower relative content of fatty acid esters, as expected from hydrolysis processes and as already noted from the observation of average spectra.
Amide absorption bands present a similar pattern of intensity and band shape in the two samples, but some differ-ences can also be observed. In most spectra of the ancient tissue, the Amide I shows a sharp peak at 1,650–1,655 cm⫺1, indicating that the a-helix is the dominant secondary struc-ture ~Barth, 2007! in these locations. A shoulder on the Am-ide I at approximately 1,660 cm⫺1 confirms that a certain amount of collagen triple helix is also present in some locations, as shown by the presence of a characteristic collagen pattern of the Amide III band. Overall, this indi-cates that these secondary structure elements are fairly well preserved in at least some locations of the ancient tissue. This observation contrasts with the conclusion from aver-age spectra, where major differences in amide absorption are observed, indicating that at least some regions of the tissue show degradation and that preservation of secondary structure at a microscopic level is heterogeneous.
In the control tissue, the Amide I also shows a peak at about 1,650–1,655 cm⫺1, indicating, as expected, the pres-ence of a-helix structures. However, the Amide I peak is generally broader than the one observed in the ancient tissue remains, revealing the presence of other structural elements, such as b-sheets, g-turns, and random coil ~Barth, 2007!, whose relative contribution seems to have decreased in the ice-preserved tissue from the ancient remains, possi-bly as a consequence of the lower stability toward hydrolysis of these structures.
A specific feature observed in the spectra from the ancient tissue is the presence of regions with a fairly large contribution of absorption from mono- and polysaccharide molecules ~Diem et al., 2008!. Although these spectral contributions are also observed in the control trapezium tissue, they are relatively weaker and more uniformly distrib-uted throughout the sample. In the spectrum from the ancient tissue shown in Figure 2, for example, the region of polysaccharide and phosphate absorptions, between 900 and 1,300 cm⫺1, shows a strong and complex band with some fine structure, with an apparent maximum at 1,000 cm⫺1. Phosphate and phosphate ester bands give weaker and more structured multiplets, suggesting that this band is instead mostly due to mono- and polysaccharide C–O absorption, with possible contributions from simpler alcohols ~Diem et al., 2008!. A contribution from glycosyl-ated proteins and their hydrolysis products is also possible. This is paralleled by the observation of a stronger absorption from the O–H and N–H band at 3,200–
3,400 cm⫺1. As indicated earlier, this band arises from the overlap of absorptions from O–H and N–H vibrations. The N–H contribution, at about 3,250 cm⫺1, is difficult to observe, and appears as a shoulder. However, its intensity is proportional to the absorption of the Amide II band, which also arises from vibrations of the peptidic N–H group. The intensity of the Amide II is little changed between the ancient and contemporary samples, although a difference in shape is observed, indicating that the overall contribution
from peptidic N–H functional groups is comparable. The difference at 3,200–3,400 cm⫺1 is therefore mostly attrib-uted to a larger contribution from the vibrations of O–H groups at about 3,350 cm⫺1. This conclusion supports the suggestion that polysaccharides and other alcohols are more abundant in specific locations of the KDT muscle.
Phosphate mineral deposits in this region could arise as a result of mineralization processes. No evidence such as sharp bands from apatite, hydroxyapatite, and carbonate Figure 2. a: Portion of a contemporary trapezius section imaged with transmitted visible light. b: Portion of the Kwäday Dän Ts’ìnchi trapezius section imaged with transmitted visible light. Red stars indicate the position where single spectra were collected. c: Spectra collected from the two locations marked in ~a! and ~b!, high-frequency region. d: Spectra collected from the two locations marked in ~a! and ~b!, low-frequency region.
minerals in the spectra supports this hypothesis. This agrees with our previous findings with gas chromatography–mass spectrometry of KDT where no mineralization of the trape-zium tissue was found ~Liu et al., 2010!.
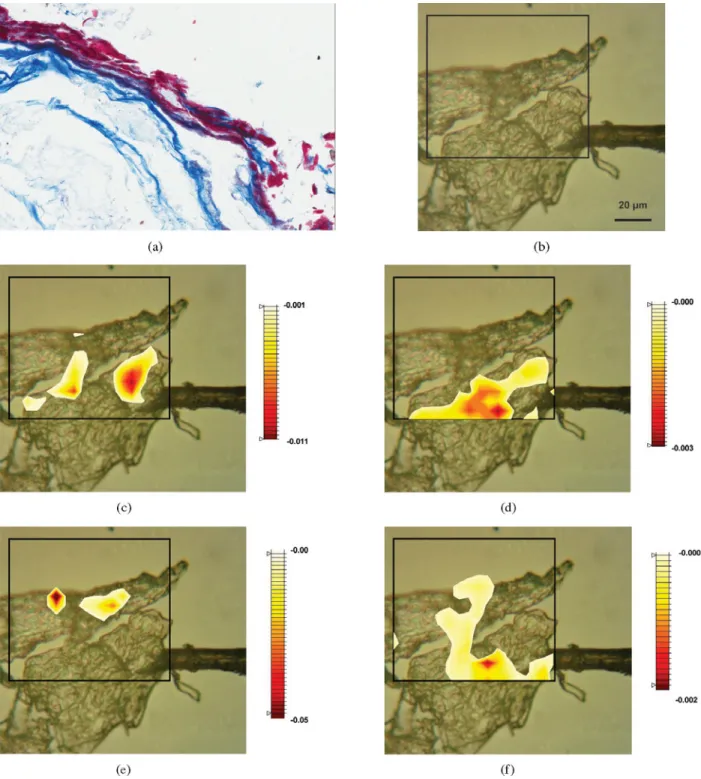
Additional information was obtained by mapping in 2D the intensity of some bands. Figure 3a shows the portion of the ancient tissue sample that was analyzed by FTIR mapping. Figures 3b–3d show the distribution of absorp-tion at specific wavenumbers throughout the mapped tissue fragment. The wavenumbers were selected for being repre-sentative of peaks attributed to specific classes of abundant biomolecules. As such, they provide a 2D image of molecu-lar distribution.
The fragmentation of KDT tissue upon sectioning in-troduces a challenge in measuring IR maps. The presence of numerous fragment edges and holes in the sectioned tissue, plus some air gaps between tissue fragment and optical substrate, introduces refraction and scattering effects in IR spectra that cause major variations and oscillations of the baseline. Such baseline effects prevent systematic and accu-rate integration of absorption bands to produce IR maps. To bypass this problem, we resorted instead to mapping the intensity of the second derivative of absorption bands. The second derivative of a Lorentzian/Gaussian band shape is a sharp negative band, with bandwidth smaller than that of the original band. In contrast, baseline effects are repre-sented by a combination of polynomial and sinusoidal functions. The second derivatives of these functions are lower-order polynomials ~usually straight lines! or sinusoi-dal functions with much decreased amplitude. As a result, the baseline of the second derivative of absorption spectra is a good approximation of a flat line and it can be neglected when compared with the sharp features of the derivative absorption bands.
IR maps, obtained by plotting the intensity of the second derivative of absorption bands, are shown in Fig-ure 3. The bands have been overlaid to visible light images of the sample. Regions of background and low absorbance have been removed from the maps to provide a view of the underlying topography in the visible image. Therefore, only locations with the higher band intensity are highlighted.
In Figure 3c the 1,650 cm⫺1 band corresponds to the peak of the Amide I absorption and provides the distribu-tion of polypeptides within the sample. The largest concen-tration of proteins is located in two structures about 20– 30 mm in size. Spectra in these locations give strong amide bands, with a sharp Amide I band peaking at 1,653 cm⫺1. These protein-rich areas appear to have the composition and approximate size of muscle fiber transversal sections. Little contribution from collagen absorption bands is seen in these locations ~Fig. 3f!, whereas triple helix contribu-tions increase in the interstices between them, suggesting the location of remains of the endomysium or perimysium membrane ~Petibois et al., 2006!.
The intensity at 2,923 cm⫺1, in Figure 3d, represents the distribution of the –CH2 functional group, normally
taken to be a good representation of the distribution of
phospholipids, sphingolipids, and triglycerides. The spatial localization of this –CH2 group is larger in the interstice
between the two hypothetical fibers, with some overlap with the distribution of the Amide I band. The relative intensity of –CH2 bands is rather low, compared with what is
observed in the control tissue sample, indicating that, at least in this location, the lipid complement appears to be decreased.
Figure 3e shows the distribution of the intensity at 1,025 cm⫺1. This frequency was chosen to match the peak of absorption from glycogen, which is expected to be a major contributor to this spectral region in recent tissue. None-theless, this frequency also shows strong absorption from other mono- and polysaccharide molecules and nonnegligi-ble absorption from phosphoryl-containing molecules. There-fore, the map of Figure 3e can be taken to represent the distribution of polysaccharides, with some contribution from phosphoryls. The map shows that the upper portion of the fragment under study is characterized by a strong absorption at this frequency, leading to saturation in several positions. Inspection of individual spectra shows that no absorption or only weak absorption from components other than polysaccharides is present in this region. The shape of this distribution is that of a fiber-like deposit.
A more detailed analysis of the polysaccharide-rich structure is shown in Figure 4, including one spectrum. The spectrum in Figure 4a shows a strong composite absorption band with a structure typical for a polysaccharide, possibly a polyglucose. The main component peaks and shoulders in the C–O stretching region are observed at 643, 706, 896, 990, 1,025, 1,080, 1,108, 1,162, and 1,201 cm⫺1. Outside of this region, additional components are observed at 1,316, 1,370, 1,428, 1,630, 1,650, 2,900, 3,367, and 3,425 cm⫺1, corresponding to a mixture of absorption contributions from proteins and other molecular components. The absorp-tion pattern in the C–O stretching region is similar, but not identical, to the one observed for glycogen, including a strong peak at 1,025 cm⫺1~Chiriboga et al., 2000!. Analysis of the fine structure of the spectra in the 900–1,200 cm⫺1 interval shows that a mixture of glycogen and glucose describes the dominant composition, possibly with other minor components. Comparison of spectra at different points along the fiber shows variability of the fine structure, corresponding to a heterogeneous composition.
Figures 4b–4e show mapping of some component bands associated to the multiplet in the C–O region. The analyzed mapped region is the same shown in Figure 3. The distribu-tion of each band appears to be different, indicating that their relative contribution to the spectrum changes in space, in agreement with the suggestion of a variable composition. As a comparison with tissue from the ancient remains, we mapped the distribution of absorption bands through a few muscle fibers from control trapezius. Figure 5a shows the mapped area, while Figures 5b–5d show the resulting maps of the main bands. Figure 5b shows distribution of the main fatty acid ester band at 2,923 cm⫺1. This band is clearly localized in the region of the muscle fiber
cross-Figure 3. a: Light micrograph of the Kwäday Dän Ts’ìnchi ~KDT! of a trapezius muscle ~X20! stained with Masson trichrome. b: Portion of a KDT trapezius section imaged with transmitted visible light, marking with a frame the area where the two-dimensional mapping of the sample was performed. The map shows the intensity of absorption at a specific wavenumber, with red indicating higher absorption and white negligible absorption. c: Map of the intensity of the Amide I absorption band at 1,650 cm⫺1, indicating the distribution of proteins within the sample. The map shows the intensity of absorption at a specific wavenumber, with red indicating higher absorption and white negligible absorption. d: Map of the intensity of the methylene stretching band at 2,923 cm⫺1, indicating the distribution of alkyl and acyl groups, mostly from fatty acid derivatives. The map shows the intensity of absorption at a specific wavenumber, with red indicating higher absorption and white negligible absorption. e: Map of the intensity of the C–O stretching band at 1,025 cm⫺1, from glycogen with some contribution from other polysaccharides. The map shows the intensity of absorption at a specific wavenumber, with red indicating higher absorption and white negligible absorption. f: Map of the intensity of the Amide III at 1,228 cm⫺1, mostly from collagen absorption. The map shows the intensity of absorption at a specific wavenumber, with red indicating higher absorption and white negligible absorption.
sections, as expected from the high lipid content of the sarcoplasmic reticulum.
The protein distribution, given by the Amide I absorp-tion band at 1,650 cm⫺1, is shown in Figure 5c. As for the lipid distribution, proteins are concentrated in the muscular fiber cross-sections, although their relative distribution is
less uniform than that of lipids, with larger relative concen-trations localized in one fiber.
As noted from the observation of average spectra, no strong bands are observed in the phosphate/polysaccharide region for the control spectrum, only weak spectral contribu-tions and uniformly distributed contribucontribu-tions throughout Figure 4. a: Fourier transform infrared absorption spectrum of a polysaccharide deposit in the sample from the trapezius of the Kwä-day Dän Ts’ìnchi. b: Map showing the intensity of absorption at 1,201 cm⫺1, with red indicating higher absorption and white negli-gible absorption. c: Map showing the intensity of absorption at 1,080 cm⫺1, with red indicating higher absorption and white negli-gible absorption. d: Map showing the intensity of absorption at 1,160 cm⫺1, with red indicating higher absorption and white negli-gible absorption. e: Map showing the intensity of absorption at 896 cm⫺1, with red indicating higher absorption and white negligi-ble absorption. The mapped bands correspond to C–O and/or P–O stretching vibrations observed in the spectra of complex alcohols, mono-, oligo-, and polysaccharides, and phosphate derivatives.
the fibers. Only some small accumulations of polysaccha-rides are observed, barely detectable with the spatial resolu-tion of these measurements, as shown in Figure 5d. This observation suggests that the distribution of glycogen is fairly uniform throughout the sample, on the resolution scale afforded by FTIR measurements, of the order of a few micrometers.
D
ISCUSSIONOur results with FTIR for the analyses of trapezius muscle tissue from the ancient remains were consistent with our previous findings that indicated a high content of protein, most notably collagen, in biceps brachii samples from the ancient remains. The distribution of total protein and colla-Figure 5. a: Portion of the control trapezius section imaged with transmitted visible light, marking with a frame the area where the two-dimensional mapping of the sample was performed. b: Map showing the intensity of absorption at 2,923 cm⫺1, indicating the distribution of alkyl and acyl groups, mostly from fatty acid derivatives. Red indicates higher absorption and white negligible absorption. c: Map showing the intensity of the Amide I absorption at 1,650 cm⫺1, indicating the distribution of proteins within the sample. Red indicates higher absorption and white negligible absorption. d: Map showing the intensity of the C–O stretching band absorption at 1,160 cm⫺1, indicating the distribution of oligo- and polysaccharides. Red indicates higher absorption and white negligible absorption.
gen indicated that proteins other than collagen are present in the skeletal muscle tissues ~biceps brachii and trapezius!. In our previous study, there were no absorptions to indicate degradation of protein. In our present analysis, preservation of trapezius tissue from the ancient remains was heteroge-neous ~some areas are well preserved, similar to control, and other areas were degraded!. The different conclusion can be ascribed to the larger number of tissue fragments investi-gated in the present study, which provided more extensive sampling.
The presence of adipocere was found during forensic examination of the tissues from the ancient remains ~Beattie et al., 2000!. In our FTIR analyses, clear differences were seen between the trapezius tissue from the ancient remains and the control tissue samples, indicating major composi-tional differences. The band at 3,069 cm⫺1 ~Fig. 1! due to absorption from ⫽C–H groups may indicate unsaturated carbon–carbon bonds in the trapezius from the ancient tis-sue sample. This could be a postmortem hydrolysis product of triglycerides in adipose tissue, characteristic of adipocere. Using gas chromatography–mass spectrometry, we re-cently quantified the relative fatty acid composition ~RC! of the ancient tissues ~Liu et al., 2010!. For the adipocere tissue in the ancient sample, oleic acid, an unsaturated fatty acid was found in a RC of 4.9% and 7.9% in trapezius and biceps samples, respectively. The presence of other unsatu-rated fatty acids was negligible. The major constituents of adipocere identified in the ancient tissues were free satu-rated fatty acids such as the palmitic acid found in trapezius and biceps tissues. A possible explanation for saturated fatty acids is that the unsaturated fatty acids present in the ancient tissue were hydrogenated by bacterial enzymes in humid and micro-aerobic conditions ~Polson, 1965!. Intrin-sic lipases, which convert the triglycerides into their corre-sponding saturated fatty acids and unsaturated fatty acids, may be responsible for forming adipocere ~Polson, 1965! found in the ancient tissues ~Liu et al., 2010!.
With mid-infrared analysis, we previously found strong Amide A, B, I, and II peaks in biceps brachii samples of the ancient tissue, indicating high protein content ~Christensen et al., 2011!. There was no carbonyl ester group at 1,750 cm⫺1, indicating that there was no lipid present in the muscle tis-sue. Now we have evidence of a lower content of fatty acid ester in the ancient trapezius tissue compared with the con-trol tissue. This is indicative of hydrolysis, as a result of a postmortem process. In addition, the strong and broad band between 3,200 and 3,400 cm⫺1~Fig. 1! observed in the an-cient trapezius may be due to a large amount of hydrolysis products such as free fatty acids.
The presence of mono-and polysaccharides could be another possible explanation for the presence of the broad band between 3,200 and 3,400 cm⫺1. Because of their size, polysaccharides are not water soluble, but their many hy-droxyl groups become individually hydrated when exposed to water.
Furthermore, a heterogeneous distribution of polysac-charides observed in the mapping of some component
bands on the trapezius tissue from the ancient remains suggests variability in composition or the presence of other molecular components ~Fig. 4!. An inspection of the spectra in the 900–1,200 cm⫺1 interval indicates the presence of a mixture of the polysaccharide glycogen and probably shorter polysaccharides, so-called oligosaccharides, perhaps originat-ing from partial hydrolysis of glycogen. The observation of large fiber-like deposits of polysaccharides and oligosaccha-rides in the tissues from the ancient remains may be due to the body being subjected to freezing and thawing while entombed in the glacier and during subsequent laboratory procedures.
The polysaccharide deposits shown in Figure 4 are the largest ones observed during our study. The use of a “slow” imaging technique such as IR mapping limits our capability to evaluate the distribution of glycogen deposits over an extensive number of sections. However, the observation of the individual spectra used to calculate the average spectra of Figure 1 confirms that the distribution of polysaccharide bands is irregular in intensity and band shape, throughout the ancient tissue, whereas it is more uniform throughout the control tissue sample.
Chemical fixation introduces some absorption in the spectral region of C–O bond vibration, because of the polymerization products of formalin. This contribution does overlap with the one from polysaccharide molecules; how-ever, it has been shown ~Gazi et al., 2005! that such contri-bution is a broad weak band, without any of the sharp features associated with the absorption bands of polysaccha-rides. This broad weak band is expected to contribute to the maps and spectra shown in this work with a minor baseline effect. This contribution would be equivalent in ancient remains and in the control tissues, and therefore has no effect on our conclusions.
Proteins other than collagen are closely associated with or arranged in the myofibrillar structure ~Obinata et al., 1981!. Myosin, actin, troponin, and tropomyosin may all be major contributors to the a-helix structure observed in the trapezius spectra of the ancient remains. Preservation of secondary structure is noted in most spectra of the ancient remains and is indicative that the a-helix and collagen triple helix are the dominant secondary structures in at least some locations of tissues.
Although we observed areas of secondary structure preservation in the trapezius sample from the ancient re-mains, this does not necessarily imply preservation of the tertiary structure or of the functionality of the protein. Only the characteristic amide absorption pattern of the most abundant components can be appreciated in the spec-tra of a tissue sample. The characteristic absorptions of minority components would not be appreciated even if they were associated with abundant proteins. For example, the presence of structurally and functionally important turns is difficult to appreciate in the spectra of a protein mixture because of variability in their amide peak positions. Selec-tive hydrolysis of turns or disordered folds cannot be reli-ably assessed in these complex samples. We cannot rule out
that partial hydrolysis of some secondary structures may have occurred, while leaving unaffected the more stable a-helical and triple helical portions of the protein backbone. It has been suggested recently that after prolonged exhaustive exercise, the depletion of glycogen stores is de-pendent on its localization within muscle cells and appears to be influenced by fiber type before exercise ~Nielsen et al., 2011!. The presence of glycogen and glucose in trapezius tissue from the ancient remains indicates that the glycogen was not depleted. We did not attempt to determine the type of fiber and total glycogen volume fraction as we were dealing with degraded tissue: degradation and alterations during the prolonged freezing and following the thawing of the remains after they emerged from the ice could be possible contributors to the morphology of glycogen depos-its detected in the skeletal muscle. This limited our ability to infer physical exertion or lack thereof near the time of death.
C
ONCLUSIONSThe coupling of visible light microscopy and infrared micro-spectroscopy has allowed us to obtain a detailed molecular description of skeletal muscle tissue from ancient human remains retrieved from a glacier. By comparison with tissues from a recently deceased cadaver, we show that the preser-vation state of the tissue varies within the same tissue depending on microscopic location. Some regions display nearly complete retention of protein secondary structure. a-helices and triple helix of collagen are generally well preserved, whereas hydrolysis of more labile structures, such as b-sheets and g-turns, is more often observed. Some lipid hydrolysis is reported, leading to the formation of adipocere deposits. Most unusually, when compared with tissue from the recently deceased cadaver, the formation of large depos-its of glycogen and depos-its putative hydrolysis products is observed.
A
CKNOWLEDGMENTSWe are grateful to the Champagne and Aishihik First Na-tions members for their support in the research. We thank the KDT Committee, and in particular Al Mackie for the execution of this project, and the Royal British Columbia Museum for providing the KDT samples. The experiments described in this work were performed on Beamline 01B1-1 of the Canadian Light Source, which is supported by the Natural Sciences and Engineering Research Council of Can-ada, the National Research Council CanCan-ada, the Canadian Institutes of Health Research, the Province of Saskatchewan, Western Economic Diversification Canada, and the Univer-sity of Saskatchewan. We are thankful to Dr. Claudia Krebs for technical assistance and Syndy De Silva for editing assistance. Becky Chen received a Summer Student Fellow-ship Program Award ~2009! from the Faculty of Medicine, University of British Columbia. We are also thankful to Tim May and Tor Pedersen, of the Canadian Light Source, for help with beamline maintenance and use.
R
EFER ENCESBarth, A. ~2007!. Infrared spectroscopy of proteins. Biochim
Bio-phys Acta 1767, 1073–1101.
Beattie, O., Apland, B., Blake, E.W., Cosgrove, J.A., Gaunt, S., Greer, S., Mackie, A.P., Mackie, K.E., Straathof, D., Thorp, V. & Troffe, P.M. ~2000!. The Kwäday Dän Ts’ínchi discovery from a glacier in British Columbia. Can J Archeol 24, 129–147. Chiriboga, L., Yee, H. & Diem, M. ~2000!. Infrared spectroscopy of human cells and tissue. Part VII: FT-IR microspectroscopy of DNase- and RNase-treated normal, cirrhotic, and neoplastic liver tissue. Appl Spectrosc 54, 480–485.
Christensen, C., Jackson, M., Zhao, J., Vogl, W. & Monsalve, M.V. ~2011!. Synchrotron mid-infrared analysis of the Kwäda¯y Dän Ts’ínchi ancient remains found in a glacier in Canada. In
Yearbook of Mummy Studies, Gill-Frerking, H., Rosendahl, W.,
Zink, A. & Piombino-Mascali, D. ~Eds.!, pp. 115–119. München, Germany: Verlag Dr. Friedrich Pfeil.
Diem, M., Griffiths, P.R. & Chalmers, J.M. ~2008!. Vibrational
Spectroscopy for Medical Diagnosis. Chichester, UK: John Wiley
& Sons.
Gazi, E., Dwyer, J., Lockyer, N.P., Miyan, J., Gardner, P., Hart, C., Brown, M. & Clarke, N.W. ~2005!. Fixation protocols for subcellular imaging by synchrotron-based Fourier transform infrared microspectroscopy. Biopolymers 77, 18–30.
Liu, C., Park, H.M., Monsalve, M.V. & Chen, D.D.Y. ~2010!. Free fatty acids composition in adipocere of the Kwäday Dän Ts’ínchi ancient remains found in a glacier. J Forensic Sci 55, 1039–1043. Miller, L.M., Smith, G.D. & Carr, G.L. ~2003!. Synchrotron-based biological microspectroscopy: From the mid-infrared through the far-infrared regimes. J Biol Phys 29, 219–230. Monsalve, M.V., Humphrey, E., Walker, D.C., Cheung, C.,
Vogl, W. & Nimmo, M. ~2008!. Brief communication: State of preservation of tissues from ancient human remains found in a glacier in Canada. Am J Phys Anthropol 137, 348–355. Monsalve, M.V., Stone, A.C., Lewis, C.M., Rempel, A.,
Rich-ards, M., Straathof, D. & Devine, D.V. ~2002!. Brief commu-nication: Molecular analysis of the Kwäday Dän Ts’ìnchi ancient remains found in a glacier in Canada. Am J Phys Anthropol 119, 288–291.
Monsalve, M.V., Stone, A.C., Lewis, C.M., Rempel, A., Rich-ards, M., Straathof, D. & Devine, D.V. ~2003!. mTDNA analysis of human ancient remains found in a glacier in Can-ada in 1999 in mummies in a new millennium. In 4th World
Congress on Mummy Studies, Llynnerup, N., Anderasen, C. &
Berglund, J. ~Eds.!, pp. 128–130. Nuuk: Greenland National Museum and Archive and Danish Polar Center.
Nielsen, J., Holmberg, H.-C., Schroder, H.D., Saltin, B. & Ortenblad, N. ~2011!. Human skeletal muscle glycogen utili-zation in exhaustive exercise: Role of subcellular localiutili-zation and fibre type. J Physiol 589, 2871–2885.
Obinata, T., Maruyama, K., Sugita, H., Kohama, K. & Ebashi, S. ~1981!. Dynamic aspects of structural proteins in vertebrate skeletal muscle. Muscle Nerve 4, 456–488.
Petibois, C., Gouspillou, G., Wehbe, K., Delage, J.P. & Deleris, G. ~2006!. Analysis of type I and IV collagens by FT-IR spectros-copy and imaging for a molecular investigation of skeletal muscle connective tissue. Anal Bioanal Chem 386, 1961–1966. Polson, C.J. ~1965!. The Essentials of Forensic Medicine. New York:
Pergamon Press.
Tamm, L.K. & Tatulian, S.A. ~1997!. Infrared spectroscopy of pro-teins and peptides in lipid bilayers. Q Rev Biophys 30, 365–429.