Publisher’s version / Version de l'éditeur:
Vous avez des questions? Nous pouvons vous aider. Pour communiquer directement avec un auteur, consultez la première page de la revue dans laquelle son article a été publié afin de trouver ses coordonnées. Si vous n’arrivez pas à les repérer, communiquez avec nous à PublicationsArchive-ArchivesPublications@nrc-cnrc.gc.ca.
Questions? Contact the NRC Publications Archive team at
PublicationsArchive-ArchivesPublications@nrc-cnrc.gc.ca. If you wish to email the authors directly, please see the first page of the publication for their contact information.
https://publications-cnrc.canada.ca/fra/droits
L’accès à ce site Web et l’utilisation de son contenu sont assujettis aux conditions présentées dans le site LISEZ CES CONDITIONS ATTENTIVEMENT AVANT D’UTILISER CE SITE WEB.
119th Audio Engineering Society Convention [Proceedings], pp. 1-7, 2005-10-01
READ THESE TERMS AND CONDITIONS CAREFULLY BEFORE USING THIS WEBSITE. https://nrc-publications.canada.ca/eng/copyright
NRC Publications Archive Record / Notice des Archives des publications du CNRC :
https://nrc-publications.canada.ca/eng/view/object/?id=5d46091f-90e5-46db-9ff2-0b08dd77e44a https://publications-cnrc.canada.ca/fra/voir/objet/?id=5d46091f-90e5-46db-9ff2-0b08dd77e44a
NRC Publications Archive
Archives des publications du CNRC
This publication could be one of several versions: author’s original, accepted manuscript or the publisher’s version. / La version de cette publication peut être l’une des suivantes : la version prépublication de l’auteur, la version acceptée du manuscrit ou la version de l’éditeur.
Access and use of this website and the material on it are subject to the Terms and Conditions set forth at
Measurement of architectural speech security of closed offices and
meeting rooms
http://irc.nrc-cnrc.gc.ca
M e a sure m e nt of a rc hit e c t ura l spe e ch
se c urit y of close d offic e s a nd m e e t ing
room s
G o v e r , B . N . ; B r a d l e y , J . S .
N R C C - 4 8 2 0 6
A version of this document is published in / Une version de ce
document se trouve dans: 119
thAudio Engineering Society
Convention, New York, NY., Oct. 7, 2005, pp. 1-7
Audio Engineering Society
Convention Paper
Presented at the 119th Convention
2005 October 7–10 New York, New York USA
This convention paper has been reproduced from the author's advance manuscript, without editing, corrections, or consideration by the Review Board. The AES takes no responsibility for the contents. Additional papers may be obtained by sending request and remittance to Audio Engineering Society, 60 East 42nd Street, New York, New York 10165-2520, USA; also see www.aes.org. All rights reserved. Reproduction of this paper, or any portion thereof, is not permitted without direct permission from the
Journal of the Audio Engineering Society.
Measurement of Architectural Speech
Security of Closed Offices and Meeting
Rooms
Bradford N. Gover and John S. Bradley
Institute for Research in Construction, National Research Council, 1200 Montreal Road, Ottawa, Ontario K1A 0R6, Canada
brad.gover@nrc-cnrc.gc.ca, john.bradley@nrc-cnrc.gc.ca
ABSTRACT
A measurement procedure has been developed for rating the architectural speech security of closed offices and meeting rooms. It is based on measuring the attenuation between average levels in the meeting room and received levels at spot locations outside the room, 0.25 m from the room boundaries. These attenuations are used with statistical distributions of speech and noise levels to calculate a suitable signal-to-noise measure. This previously derived objective measure is related to the audibility and intelligibility of the transmitted speech. The measurement at spot receiver locations allows detection and characterization of localized weak spots (“hot spots”) in the room’s boundaries.
1. INTRODUCTION
Conversations occurring within closed meeting rooms or offices are frequently audible or intelligible outside the rooms, in the adjoining spaces. The degree to which the speech is recognizable outside describes the level of “speech security”. If the speech sounds from conversations within a room are completely inaudible in the adjoining spaces, then the room can be said to be “speech secure”. The term “speech privacy” is more commonly used for less stringent cases where speech sounds may be slightly audible or minimally intelligible. Cases where the speech is clearly intelligible outside the room correspond to a lack of security (and privacy).
The term “architectural speech security” limits the scope to security provided passively by the building elements (walls, floors, doors, mechanical systems, etc.) and excludes cases of electronic or other devices for eavesdropping.
Notwithstanding recent legislation and heightened security concerns, interest in speech privacy in buildings has been long-standing. In 1962 Cavanaugh et al. [1] published a study of occupant impressions of speech privacy in closed offices, and how they were related to the Articulation Index (AI) [2]. The idea was to use a measure of speech intelligibility (AI) to gauge subjective impressions of privacy. Young [3], in 1965,
Gover and Bradley Measurement of Speech Security
AES 119th Convention, New York, New York, 2005 October 7–10
Page 2 of 7 published a simplified procedure based on the Cavanaugh et al. data. The so-called “Speech-Privacy Calculation” [4] has become commonplace. This paper describes recent work intended to improve upon the accuracy and repeatability of these prediction and assessment methods for rating the speech security of closed meeting rooms and offices.
2. OVERVIEW OF APPROACH
The degree of security provided by a particular room can be expressed in terms of how audible or intelligible the speech sounds are to listeners in the adjoining spaces. This can be described in terms of three security thresholds: the Threshold of Intelligibility, below which the speech is unintelligible; the Threshold of Cadence, below which the cadence or rhythm of the speech is inaudible; and the Threshold of Audibility, below which the speech sounds are inaudible.
Whether speech sounds are audible or intelligible depends on how loud the speech is relative to the background noise, and how this varies with frequency. That is, it is a matter of spectral signal-to-noise ratios. Indices such as the Articulation Index and its replacement, the Speech Intelligibility Index (SII) [5], are signal-to-noise type measures that correlate well with intelligibility. However, these measures do not accurately indicate high levels of privacy or security, nor do they provide information below zero intelligibility, where audibility is a concern. Suitable measures have been developed that are applicable for all security conditions [6].
The level of audibility or intelligibility of the transmitted speech, and accordingly the security signal-to-noise index measure, both depend on the spectra of speech and noise outside the room, at the position of the listener. The transmitted speech spectrum can be derived from the level and spectrum of the speech inside the room, together with the transmission characteristics from inside to the listener location. The background noise spectrum can be measured or estimated directly. Since both speech levels and noise levels vary with time, the issue is statistical in nature. Speech occurring within a particular room may be inaudible 90% of the time in the adjoining spaces. This room would be “less secure” than one for which the speech is inaudible in the adjoining spaces 99% of the time. The statistical distributions of speech and noise levels were measured in a large number of meetings [7]. These results can be
used to select source room speech levels and listening position noise levels to be used in the calculation of the security indices.
For a given source room speech level (for instance, chosen from the measured distribution), it is necessary to determine what the level will be at the listener position in the adjoining space. The present approach calculates the level difference (noise reduction) between the source room average level and that at a single listening point, 0.25 m from the outside boundary of the room. This is different than the conventional methods of measuring sound transmission between rooms (for example, ASTM E336 [8], ISO 140-4 [9]), which use an average level in both the source and the “receiving” rooms. The 0.25 m “spot” measurement approach has the advantage that it is applicable even when the receiving space is ill-defined and not likely to be well represented by a diffuse field assumption (e.g., a corridor, an atrium), in which case speaking of an average received level does not make sense. Also, the points close to the boundary are more realistic representations of where an eavesdropper might be found. Furthermore, testing these locations will enable characterization of “hot spots”, or localized deviations from the average sound insulation performance.
3. MEASURES OF SPEECH SECURITY
As previously mentioned, the degree to which speech is audible or intelligible depends on signal-to-noise ratios. Extensive listening tests were conducted to define relationships between subjective responses and objective measures, calculated from the speech (signal) spectrum and the ambient noise spectrum. The detailed results are presented in Ref. [6].
In brief, 19 volunteer subjects listened to 500 English sentences, each of which had been modified to simulate transmission through a particular type of wall construction. The level of the speech was varied, and each sentence was presented to the listener along with background ventilation type noise of varying spectrum and level. The spectrum of each test sentence and test noise was separately measured, and the subjective intelligibility and audibility scores were recorded. From these tests, a measure was defined that is highly correlated with the thresholds of intelligibility, cadence, and audibility. This measure is a uniformly-weighted sum of 1/3-octave band signal-to-noise level
Gover and Bradley Measurement of Speech Security
AES 119th Convention, New York, New York, 2005 October 7–10
Page 3 of 7 differences, with the minimum level difference clipped to –32 dB. The measure (denoted SNRUNI32) is given by
(
)
∑
− − = b b b UNI S N SNR max , 32 16 1 32 , (1 )where Sb and Nb are the 1/3-octave band levels (in dB)
of the speech and noise, respectively, in band b. The contribution from each band is the larger of Sb – Nb or
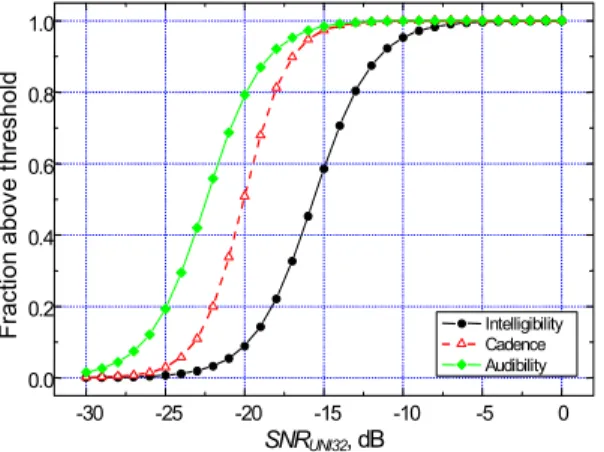
–32 dB. (This is to prevent large negative numbers from bands with no signal from unrealistically affecting the result.) The sum is performed over 16 bands from 160 to 5000 Hz. Figure 1 shows a plot of the listening test results versus SNRUNI32. The “just noticeable”
threshold of intelligibility can be taken as –16 dB. Above this, more than 50% of the subjects correctly identified at least one word from the test sentences, below this less than 50% of the subjects did so. The thresholds of cadence and audibility can be likewise identified as –20 dB and –22 dB, respectively.
-30 -25 -20 -15 -10 -5 0 0.0 0.2 0.4 0.6 0.8 1.0 Fr acti o n a bov e t h re sh ol d SNRUNI32, dB Intelligibility Cadence Audibility
Figure 1 Listening test results: fraction of subjects correctly identifying at least one word (intelligibility), identifying the cadence of the speech sounds (cadence),
or identifying the audibility of the speech sounds (audibility) versus signal-to-noise type measure. So, for any known (or assumed) speech and noise spectra, the security index SNRUNI32 can be computed to
indicate whether the speech would be audible or intelligible to listeners.
4. SPEECH AND NOISE LEVELS
To define the statistics of the speech and noise levels, sound level loggers were distributed in and near meeting rooms in several buildings. Each logger recorded an
average level (Leq) every 10 seconds, and 4 loggers were left measuring each meeting room for a full 24 hour period. In total, 79 meetings were recorded in 32 different meeting rooms. Some meetings employed sound reinforcement systems (“amplified”), while others did not (“non-amplified”).
4.1. Speech Levels Inside Meeting Rooms The loggers inside the rooms were distributed around the periphery, intentionally avoiding the near field of any sources. They therefore recorded the reverberant field levels incident on the room boundaries.
Figure 2 shows a plot of the cumulative distribution of the 10-second Leq values recorded during meetings. Over 110 000 10-second values were recorded. The figure shows the amplified and non-amplified meetings separately, and also the aggregate curve for all meetings. It shows, for instance, that 90% of the time, the overall average speech level was 64.5 dB or less. That is, only 10% of the time did the speech level exceed 64.5 dB. Only 2% of the time did the speech level exceed 69.5 dB.
The spectral shape of the speech can be assumed to be an average derived from well-known measurements made at various speaking efforts [7,10]
Leq, dBA
Figure 2 Cumulative distribution plot of 10-second Leq values inside meeting rooms during meetings. 4.2. Noise Levels Outside Meeting Rooms The loggers located outside the rooms were used to determine background noise levels during the times when meetings were not in progress. These data were
Gover and Bradley Measurement of Speech Security
AES 119th Convention, New York, New York, 2005 October 7–10
Page 4 of 7 broken down according to time of day, with the evening and nighttime typically being quieter than the daytime. Figure 3 shows the cumulative distribution for the 10-second Leq noise levels recorded outside meeting rooms at different times of day: Day (08:00–17:00 h), Early Evening (17:00–21:00 h), Late Evening (21:00– 24:00 h), and Night (24:00–06:00 h). The figure shows, for instance that only 10% of the time was the daytime background noise level below about 40 dB. However, in the early evening, which is still a likely time for meetings to occur, the buildings were quieter—the noise was below 34 dB 10% of the time.
The spectrum of the noise was seen to vary slightly depending on the primary noise source, but can be taken on average to have a simple shape of a –5 dB/octave roll-off [7].
Figure 3 Cumulative distribution plot of 10-second Leq values outside meeting rooms, by time of day. 4.3. Selecting Speech and Noise Levels
The distributions of speech and noise levels enable assessment of the desired degree of security. For instance, consider the 90th percentile speech level (64.5 dB) and the 10th percentile early evening noise level (34 dB). Together, they would simultaneously occur 1% of the time (once in 100 10-second sampling intervals). If a room was found to sufficiently attenuate this speech level in the presence of this noise level, it would suffice 99% of the time. If less frequently occurring (louder) speech and (quieter) noise levels were selected, the design would require higher sound insulation, but would suffice a greater proportion of the time. That is, such a room would be “more secure”.
5. TRANSMISSION FROM WITHIN THE
ROOM TO POINTS OUTSIDE
As previously stated, the proposed new procedure for measuring the attenuation from average levels in the source room to spot locations outside the room is different from traditional methods. The usual standard procedures for measuring the attenuation between rooms utilize several microphone locations in both the “source” and “receiving” rooms—and also several loudspeaker locations in the source room—to obtain average sound levels for each room. This can be problematic in practice because the receiving room is frequently such that a diffuse field assumption is not valid. The new procedure uses “receiver” measurements at a single spot location, at a distance of 0.25 m from the boundaries of the meeting room. Since the talker in the room could be located anywhere, the “average” source room level concept is retained, and the procedure uses several source room loudspeaker and microphone locations. This procedure then provides the attenuations necessary to rate the security of the room to that particular listening point.
Figure 4 Schematic representation of proposed new measurement procedure (bottom) and contrasting
conventional approach (top).
Transmission measurements were made in 11 different meeting rooms, ranging from a small private office (about 56 m3) through to a large conference room (over 500 m3). The source room average was obtained by using an omnidirectional loudspeaker in several (up to 6) positions, and a microphone in several (up to 6) positions, each out of the direct field of the source and
Gover and Bradley Measurement of Speech Security
AES 119th Convention, New York, New York, 2005 October 7–10
Page 5 of 7 more than 1/2 wavelength from the boundaries. For each source position, the level was also recorded at spot locations outside of the rooms, 0.25 m from the boundaries. For comparison with conventional procedures, a directional loudspeaker was also used in the source room, pointing both into and out of the corners opposite the wall where the spot measurements were being made. This comprehensive battery of measurements was not intended to be recommended for practice, but rather was used to assess the minimum number of measurements required to achieve a desired accuracy in the result.
The results indicate that, on average, about 4–5 combinations of omnidirectional loudspeaker and source room microphone positions are sufficient to achieve a source room average level with a standard error of 1 dB. Typically, twice as many combinations are required when using a directional loudspeaker. Using the measured source room levels and spot receiving location levels, the noise reduction to individual listening locations are obtained. This is used to estimate the transmitted speech level (for a selected source room level), which when paired with a selected background noise level enables calculation of the objective index (SNRUNI32). The index will indicate the
degree of speech security to that listening location, for the chosen speech and noise levels.
Figure 5(a) shows the calculated values of SNRUNI32 for
8 spot locations in the hallway outside of a meeting room, and, for comparison, the room average to hallway average result (“Avg”). The plan drawing of the room and hallway, indicating the measurement positions, is shown in Fig. 5(b). The index was calculated for a (98th percentile) speech level of 69 dBA and a (2nd percentile daytime) noise level of 36 dB. The three curves correspond to measurements with an omnidirectional loudspeaker, a directional loudspeaker pointing into the opposite corners (positions K1 and K2 in the plan drawing), and a directional loudspeaker pointing out of those opposite corners. The differences in the results are attributed to differences in the uniformity with which the room and room boundaries were excited. The standard error in the room average level was 0.3 dB when using the omnidirectional source, less than half that for the directional source measurements.
Position 4 was outside the doors to the room, and it is seen that the SNRUNI32 value is higher there, indicating
less speech security at that location. The doors did not seal effectively, and were a major sound leak. Position 8 exhibited the best security. The average result does not reflect the variation with position.
Avg 1 2 3 4 5 6 7 8 -14 -12 -10 -8 -6 -4 -2 0 OMNI DIR-IN DIR-OUT SN RUN I3 2 , d B Position (a) 1 2 3 K1 K2 4 5 6 7 9.69 m 12.77 m Height 4.19 m Translation Booth 8 Hall Lounge Avg (b) Translation Booth
Figure 5 Speech security index for several spot receiver locations (a), and plan drawing of room showing
locations outside in hallway (b). 5.1. Prediction of Levels at 0.25 m
The spot receiving locations can actually be located anywhere desired (such as under a duct or other obvious sound leak), but measuring at 0.25 m from the room boundary is recommended for the practical reason that it is a reasonable position to expect to find an eavesdropper. Also, it turns out to be rather simple to estimate the levels at 0.25 m from the source room levels and transmission loss (TL) of the partitions. Consider the conventional room average to room average transmission idea, with diffuse fields present in
Gover and Bradley Measurement of Speech Security
AES 119th Convention, New York, New York, 2005 October 7–10
Page 6 of 7 both rooms. The receiving room average level LR can
be predicted from ) / log( 10 S A TL L LR = S − + , (2 )
where LS is the source room average level, TL is the
transmission loss of the partition separating the rooms, S is the area of the common partition, and A is the total sound absorption in the receiving space. From the new approach, the level at a location 0.25 m from the separating boundary can be predicted from
k TL L
L0.25 = S − + , (3 )
where k is being determined empirically, and is close to 0 dB. Equation (3) enables design-stage estimation of suitable constructions (i.e., selection of TL) for assumed source room levels and background noise levels. 5.2. Selection of Spot Measurement Locations It may be said that a room is only as secure as its weakest point. That is, an otherwise adequate room may be rated as not secure if it “fails” at so much as one position. The task, then, is to ensure that points near the weakest spots in the room boundaries are selected for spot testing. The quickest and simplest way to find most weak spots is likely to play pink noise at a high level in the room, seal the doors, and walk around outside and listen. This will rely on the skill and hearing ability of the measurement team, but is expected to suffice a great deal of the time. Another approach, using highly directional microphone arrays to identify the weak spots in the partitions, is being investigated. The equipment required is specialized, but indications are that even subtle leaks and “hot spots” in the partitions are detectable [11].
6. SUMMARY AND CONCLUSIONS
The factors necessary to measure and rate the speech security of closed offices and meeting rooms have been investigated.
A single-number objective measure, calculated from the speech and noise spectra, can be used to indicate the expected audibility or intelligibility of “transmitted” speech. This enables a room to be rated in terms of three security thresholds (intelligibility, cadence, and audibility).
The source room speech level and listening position noise level can be chosen based on the statistics of levels occurring in actual meetings. A speech and noise level combination is selected that can be expected to occur with a known frequency. If a room is found to provide adequate security for this combination, it will provide adequate security for a known percentage of time. Security designers with more stringent requirements could use less-frequently occurring combinations, to ensure that the rooms were speech secure for a greater proportion of the time.
The attenuation from within the room to the listening location can be measured using the new procedure. This approach retains the conventional “source room average” notion. Extensive measurements have shown that using an omnidirectional source at locations distributed throughout the room enables a more precise estimate of the source room average level, and does so with fewer required measurements, as compared to using a directional loudspeaker in the corners of the room. Using spot measurements for the receiving position allows characterization of specific “hot spots” or sound leaks.
7. ACKNOWLEDGEMENTS
This work was jointly funded by Public Works and Government Services Canada (PWGSC), the Royal Canadian Mounted Police (RCMP), and the National Research Council Canada (NRC).
8. REFERENCES
[1] W.J. Cavanaugh, W.R. Farrell, P.W. Hirtle, and B.G. Watters, “Speech Privacy in Buildings,” J. Acoust. Soc. Am., 34, 475–492 (1962).
[2] ANSI S3.5-1969, “American National Standard Methods for the Calculation of the Articulation Index,” ANSI, New York, NY, U.S.A.
[3] R.W. Young, “Re-Vision of the Speech-Privacy Calculation,” J. Acoust. Soc. Am., 38, 524–530 (1965).
[4] M.D. Egan, Architectural Acoustics (McGraw-Hill, New York, 1988.)
[5] ANSI S3.5-1997, “American National Standard Methods for Calculation of the Speech
Gover and Bradley Measurement of Speech Security
AES 119th Convention, New York, New York, 2005 October 7–10
Page 7 of 7 Intelligibility Index,” ANSI, New York, NY, U.S.A.
[6] B.N. Gover and J.S. Bradley, “Measures for assessing architectural speech security (privacy) of closed offices and meeting rooms,” J. Acoust. Soc. Am., 116, 3480–3490 (2004).
[7] J.S. Bradley and B.N. Gover, “Speech and Noise Levels Associated with Meeting Rooms,” Research Report 170, Institute for Research in Construction, National Research Council Canada, pp. 54 (2004). Available online from http://irc.nrc-cnrc.gc.ca/ircpubs/
[8] ASTM E336, “Standard Test Method for Measurement of Airborne Sound Insulation in Buildings,” Am. Soc. for Testing and Materials, Consohocken, PA, USA.
[9] ISO 140-4:1998, “Measurement of sound insulation in buildings and of building elements – Part 4: Field measurements of airborne sound insulation between rooms,” International Organization for Standardization, Geneva, Switzerland.
[10] W.O. Olsen, “Average Speech Levels and Spectra in Various Speaking/Listening Conditions: A Summary of the Pearson, Bennett, & Fidell (1977) Report,” American Journal of Audiology, 7, 1–5 (1988).
[11] B.N. Gover, “Directional measurement of airborne sound transmission paths using a spherical microphone array,” Convention Paper 6276, Presented at the 117th Convention of the Audio Engineering Society, San Francisco, October (2004).