https://doi.org/10.4224/23001775
READ THESE TERMS AND CONDITIONS CAREFULLY BEFORE USING THIS WEBSITE.
https://nrc-publications.canada.ca/eng/copyright
Vous avez des questions? Nous pouvons vous aider. Pour communiquer directement avec un auteur, consultez la
première page de la revue dans laquelle son article a été publié afin de trouver ses coordonnées. Si vous n’arrivez pas à les repérer, communiquez avec nous à [email protected].
Questions? Contact the NRC Publications Archive team at
[email protected]. If you wish to email the authors directly, please see the first page of the publication for their contact information.
NRC Publications Archive
Archives des publications du CNRC
For the publisher’s version, please access the DOI link below./ Pour consulter la version de l’éditeur, utilisez le lien DOI ci-dessous.
Access and use of this website and the material on it are subject to the Terms and Conditions set forth at
Lithium Battery Transport Research Program: lithium batteries market
data collection and analysis final report
Rossetto, Mark; Hernander, Manuel; Fatih, Khalid
https://publications-cnrc.canada.ca/fra/droits
L’accès à ce site Web et l’utilisation de son contenu sont assujettis aux conditions présentées dans le site LISEZ CES CONDITIONS ATTENTIVEMENT AVANT D’UTILISER CE SITE WEB.
NRC Publications Record / Notice d'Archives des publications de CNRC:
https://nrc-publications.canada.ca/eng/view/object/?id=6b7669ef-5ef0-407d-be55-cad939247bdc https://publications-cnrc.canada.ca/fra/voir/objet/?id=6b7669ef-5ef0-407d-be55-cad939247bdc
Lithiu Battery Tra sport Resear h
Progra
Lithium Batteries Market Data Collection and Analysis
Final Report
Authors: Mark Rossetto, P.Eng., Manuel Hernandez, P.Eng., Khalid Fatih, Ph.D. NRC – EME, Vancouver, British Columbia
Table of Contents
List of Tables ... 4 List of Figures ... 5 Disclaimer ... 8 Executive Summary ... 9 1. Introduction ...142. 2011-2014 Global Trade Analysis of Lithium Batteries, Battery Packs and Products Containing Lithium Batteries ...14 2.1 Purpose ...14 2.2 Key Questions ...14 2.3 Methodology ...15 2.4 Sources Consulted ...15 2.5 Summary of Results ...15
2.5.1 HS 847130: Portable automatic data processing machines, wt <= 10kg, with cpu, keyboard and display ...16
2.5.2 HS 850650 (UN 3090): Lithium primary cells and batteries ...18
2.5.3 HS 850760 (UN 3480): Lithium-ion electric accumulators, including separators therefor, whether or not rectangular (including square) ...20
2.5.4 HS 852580: Television cameras, digital cameras and video camera recorders ...22
3. 2014 Global Shipments of Advanced Batteries for Automotive, Stationary Energy Storage, and Consumer Electronics Applications ...24
3.1 Introduction ...24
3.2 Global Shipments in 2014 ...25
3.3 The Market Position in 2014 ...25
3.3.1 2014 Shipments by Country of Origin...26
3.3.2 2014 Shipments by Application Sector ...27
3.3.3 2014 Shipments by Battery Chemistry ...29
4. 2011-2014 Canadian Trade Analysis for Lithium Batteries, Battery Packs and Products Containing Lithium Batteries ...30
4.1 Purpose ...30
4.2 Key Questions ...30
4.4 Sources Consulted ...31
4.5 Summary of Results ...31
4.5.1 HS 847130: Portable automatic data processing machines, wt <= 10kg, with cpu, keyboard and display ...32
4.5.2 HS 850650 (UN 3090): Lithium primary cells and batteries ...33
4.5.3 HS 850760 (UN 3480): Lithium-ion electric accumulators, including separators therefor, whether or not rectangular (including square) ...36
4.5.4 HS 852580: Television cameras, digital cameras and video camera recorders ...39
5. Lithium Battery Transportation Survey ...42
5.1 Purpose ...42
5.2 Methodology ...42
5.3 Sources Consulted ...43
5.4 Summary of Results ...43
6. Appendix A – 71 HS Codes Identified ...75
List of Tables
Table 1 HS Code Product Classifications included in detailed analysis ... 16
Table 2 UN Comtrade Database reporting of exports and re-exports for HS 850650 ... 19
Table 3 UN Comtrade Database reporting of exports and re-exports for HS 850760 ... 21
Table 4 UN Comtrade Database reporting of exports and re-exports for HS 852580 ... 23
Table 5 2014 Global Energy Capacity Market Share of Advanced Batteries by Top 10 Manufacturers within Automotive Sector ... 28
Table 6 2014 Global Energy Capacity Market Share of Advanced Batteries by Top 10 Manufacturers within Stationary Energy Storage Sector ... 28
Table 7 2014 Global Energy Capacity Market Share of Advanced Batteries by Top 10 Manufacturers within Consumer Electronics Sector ... 29
Table 8 2014 Global Energy Capacity Market Share of Advanced Batteries by Li-ion Subchemistry ... 30
Table 9 Reported supply chain(s) and application(s) of companies represented in Question 12. ... 54
Table 10 Reported supply chain(s) and application(s) of companies referenced in Question 23 who ship and receive products with 0-29% SOC. ... 68
List of Figures
Figure 1 HS 847130: Portable Devices and Computers, Quantity of Global Imports ... 17
Figure 2 HS 847130: Portable Devices and Computers, Value of Global Imports ... 17
Figure 3 HS 847130: Portable Devices and Computers, Quantity of Global Exports ... 18
Figure 4 HS 847130: Portable Devices and Computers, Value of Global Exports ... 18
Figure 5 HS 850650: Lithium Primary Cells and Batteries, Quantity of Global Imports ... 19
Figure 6 HS 850650: Lithium Primary Cells and Batteries, Value of Global Imports ... 19
Figure 7 HS 850650: Lithium Primary Cells and Batteries, Quantity of Global Exports ... 20
Figure 8 HS 850650: Lithium Primary Cells and Batteries, Value of Global Exports ... 20
Figure 9 HS 850760: Lithium-ion Electric Accumulators, Quantity of Global Imports... 21
Figure 10 HS 850760: Lithium-ion Electric Accumulators, Value of Global Imports ... 21
Figure 11 HS 850760: Lithium-ion Electric Accumulators, Quantity of Global Exports ... 22
Figure 12 HS 850760: Lithium-ion Electric Accumulators, Value of Global Exports ... 22
Figure 13 HS 852580: Electronic Cameras, Quantity of Global Imports ... 23
Figure 14 HS 852580: Electronic Cameras, Value of Global Imports ... 23
Figure 15 HS 852580: Electronic Cameras, Quantity of Global Exports ... 24
Figure 16 HS 852580: Electronic Cameras, Value of Global Exports... 24
Figure 17 2014 Global Energy Capacity (MWh) of Advanced Batteries by Application Sector ... 25
Figure 18 2014 Global Power Capacity (MW) of Advanced Batteries by Application Sector ... 25
Figure 19 2014 Global Cell Shipments of Advanced Batteries by Application Sector ... 26
Figure 20 2014 Global Revenue of Advanced Batteries by Application Sector ... 26
Figure 21 2014 Global Energy Capacity Market Share by Country of Origin ... 27
Figure 22 HS 847130: Portable Devices and Computers, Quantity of Imports into Canada ... 33
Figure 23 HS 847130: Portable Devices and Computers, Value of Imports into Canada ... 33
Figure 24 HS 850650: Lithium Primary Cells and Batteries, Quantity of Imports into Canada ... 34
Figure 25 HS 850650: Lithium Primary Cells and Batteries, Value of Imports into Canada ... 34
Figure 26 HS 850650: Lithium Primary Cells and Batteries, Quantity of Canadian Domestic Exports ... 35
Figure 27 HS 850650: Lithium Primary Cells and Batteries, Value of Canadian Domestic Exports ... 35
Figure 28 HS 850650: Lithium Primary Cells and Batteries, Quantity of Re-exports from Canada ... 36
Figure 29 HS 850650: Lithium Primary Cells and Batteries, Value of Re-exports from Canada ... 36
Figure 30 HS 850760: Lithium-ion Electric Accumulators, Quantity of Imports into Canada ... 37
Figure 31 HS 850760: Lithium-ion Electric Accumulators, Value of Imports into Canada ... 37
Figure 32 HS 850760: Lithium-ion Electric Accumulators, Quantity of Canadian Domestic Exports ... 38
Figure 33 HS 850760: Lithium-ion Electric Accumulators, Value of Canadian Domestic Exports ... 38
Figure 34 HS 850760: Lithium-ion Electric Accumulators, Quantity of Re-exports from Canada ... 39
Figure 35 HS 850760: Lithium-ion Electric Accumulators, Value of Re-exports from Canada ... 39
Figure 36 HS 852580: Electronic Cameras, Quantity of Imports into Canada ... 40
Figure 37 HS 852580: Electronic Cameras, Value of Imports into Canada ... 40
Figure 39 HS 852580: Electronic Cameras, Value of Canadian Domestic Exports ... 41
Figure 40 HS 852580: Electronic Cameras, Quantity of Re-exports from Canada ... 42
Figure 41 HS 852580: Electronic Cameras, Value of Re-exports from Canada ... 42
Figure 42 What lithium battery supply chain sector(s) are you in? ... 44
Figure 43 For each sector, what category of lithium battery products do you produce, use, ship or receive? ... 45
Figure 44 What is your experience developing or integrating lithium cells or batteries? ... 46
Figure 45 What is the application of the cells, batteries or equipment containing Li batteries that you produce, use, ship or receive? ... 47
Figure 46 Which of the following lithium battery trade activities fit your business best? ... 48
Figure 47 Do you ship and/or receive batteries (cells, modules, packs) or products containing batteries? ... 49
Figure 48 Experience developing or integrating lithium cells or batteries of companies who reported having shipped and received batteries or products containing batteries ... 49
Figure 49 What is your experience shipping and receiving lithium cells or batteries? (Years) ... 50
Figure 50 Via what transportation modes are lithium cells, batteries or equipment containing Li batteries shipped and received? ... 51
Figure 51 Approximately what percentage of shipments do you ship and receive by air?... 52
Figure 52 If you are a carrier, what type of aircraft do you use? ... 52
Figure 53 How many shipments per year of Li cells, batteries or equipment containing Li batteries do you ship and receive? ... 53
Figure 54 Estimated annual shipments transported by air... 55
Figure 55 Do you ship and receive Li cells, batteries or equipment containing Li batteries on a regular schedule? ... 55
Figure 56 What do you ship and receive? ... 56
Figure 57 What type of lithium cells or batteries do you ship and receive (by itself or inside a product)? ... 57
Figure 58 What proportion (%) of lithium cells or batteries do you ship (by itself or inside a product)? .. 58
Figure 59 What proportion (%) of lithium cells or batteries do you receive (by itself or inside a product)? ... 58
Figure 60 What percentage of the lithium cells, batteries or products containing Li batteries that you ship or receive have a brand name or trademark? ... 59
Figure 61 Are the batteries that you ship and receive being shipped as Class 9 dangerous goods under UN regulations? ... 60
Figure 62 On average, what is the number of cells/batteries that you ship and receive per shipment? .. 61
Figure 63 Average number of cells/batteries shipped and received via each mode of transportation. .... 62
Figure 64 Estimated minimum and maximum number of Li cells, batteries or equipment containing Li batteries shipped and received per year ... 63
Figure 65 On average, what is the mass of cells/batteries that you ship or receive per shipment? ... 64
Figure 66 On average, what is the number of equipment containing batteries that you ship or receive per shipment? ... 65
Figure 67 On average, what is the mass of equipment containing batteries that you ship or receive per
shipment? ... 66
Figure 68 What is the average state of charge of the lithium cells, batteries or products containing lithium batteries for each shipment sent or received? ... 67
Figure 69 What is the average state of charge of the lithium cells, batteries or products containing lithium batteries for shipments transported via air? ... 68
Figure 70 What is the capacity of the batteries/cells you ship or receive (Amp-Hour)? ... 69
Figure 71 What is the energy content of the batteries/cells you ship or receive (Watt-Hour)? ... 70
Figure 72 Where do you ship lithium cells, batteries or products containing lithium batteries? ... 71
Figure 73 What is the origin of the lithium cells, batteries or products containing lithium batteries received in your facilities? ... 72
Figure 74 Which Canadian provinces/territories do you ship to? From which Canadian provinces/territories do you receive lithium cells, batteries or products containing lithium batteries? .. 73
Disclaimer
This report reflects the views of the authors only and does not reflect the views or policies of Transport Canada.
Neither Transport Canada, nor its employees, makes any warranty, express or implied, or assumes any legal liability or responsibility for the accuracy or completeness of any information contained in this report, or process described herein, and assumes no responsibility for anyone's use of the information. Transport Canada is not responsible for errors or omissions in this report and makes no representations as to the accuracy or completeness of the information.
Transport Canada does not endorse products or companies. Reference in this report to any specific commercial products, process, or service by trade name, trademark, manufacturer, or otherwise, does not constitute or imply its endorsement, recommendation, or favoring by Transport Canada and shall not be used for advertising or service endorsement purposes. Trade or company names appear in this report only because they are essential to the objectives of the report.
References and hyperlinks to external web sites do not constitute endorsement by Transport Canada of the linked web sites, or the information, products or services contained therein. Transport Canada does not exercise any editorial control over the information you may find at these locations.
Executive Summary
Under a service contract for the Transport of Dangerous Goods Directorate at Transport Canada e titled Lithiu Batte y T a spo t Resea h P og a , the Natio al Resea h Cou il of Ca ada NRC
a ied out Task . Conduct Lithiu Batte ies Ma ket Data Colle tio a d A alysis i o de to suppo t Tra spo t Ca ada’s efforts to better understand the supply chain and commodity flows of lithium batteries and equipment containing lithium batteries in Canada and to help inform their risk analysis efforts. This research will enable Transport Canada to better understand and respond to the public on the hazards involved with the transportation of lithium battery shipments, especially products travelling by air. This final report is comprised of a global trade data analysis of lithium batteries and products containing batteries, an investigation of developments and trends in the global lithium battery market, a Canadian trade data analysis of lithium batteries and products containing batteries, and a survey on lithium battery transportation of new and used lithium batteries within various organizations in the Canadian lithium battery supply chain.
Information is needed about shipments of lithium batteries and products containing them, in order to understand the volume of freight movement into and out of Canada and around the world. This report includes analysis of a subset of data collected from 71 product classifications from various categories identified by NRC. Harmonized System (HS) product codes were used to retrieve statistics for Canadian trade in lithium batteries and/or finished products containing lithium batteries. The four classifications that were included in our detailed analysis are HS 847130 (portable devices and computers), HS 850650 (lithium primary cells and batteries), HS 850760 (Li-ion electric accumulators), and HS 852580 (electronic cameras).
Nearly 440 million portable devices and computers worth $147B USD were imported globally in 2014. The value of global imports has essentially remained flat from 2011 to 2014. The total quantity of imports are on the rise, up 52% overall since 2011. With 9.4 million imports worth $4.1B USD, Canada was ranked 8th globally for imports of portable devices and computers in 2014. 2014 saw more than 470 million global exports of portable devices and computers worth in excess of $150B USD. The value of global exports has essentially remained flat from 2011 to 2014. With 815 thousand exports worth $354M USD, Canada was ranked 22nd globally for exports of portable devices and computers in 2014. More than 2.9 billion lithium primary cells and batteries worth nearly $2.5B USD were imported globally in 2014. The value of global imports has been rising in recent years, up about 11% from 2011 to 2014. The total quantity of imports is on a downward trend, down overall about 13% since 2011. With 28 million imports worth $63M USD, Canada was ranked 12th globally for imports of lithium primary cells and batteries in 2014. More than 2.4 billion lithium primary cells and batteries worth nearly $2.5B USD were exported globally in 2014. The value of global exports has been rising in recent years, up about 33% from 2011 to 2014. The total quantity of exports is on an upward trend, overall up about 15% since 2011. With 1.5 million exports worth almost $105M USD, Canada was ranked 9th globally for exports/re-exports of lithium primary cells and batteries in 2014.
More than 2.8 billion Li-ion electric accumulators worth over $12.8B USD were imported globally in 2014. The value of global imports has been rising in recent years, up overall about 27% from 2012 to 2014. The total quantity of imports is on a downward trend, down overall about 3% since 2012. With 5.7 million imports worth $95M USD, Canada was ranked 19th globally for imports of Li-ion electric accumulators in 2014. Nearly 2.2 billion Li-ion electric accumulators worth over $14.2B USD were exported globally in 2014. The value of global exports has been rising in recent years, up overall about 24% from 2012 to 2014. The total quantity of exports has fluctuated in recent years but is up overall about 22% since 2012. With 5.7 million exports worth nearly $43M USD, Canada was ranked 19th globally for exports of Li-ion electric accumulators in 2014.
More than one billion electronic cameras worth over $41B USD were imported globally in 2014. The value of global imports has been dropping in recent years, overall down by 11% since 2011. The total quantity of imports is on a slight upward trend, up overall about 3% since 2011. With 7.4 million imports worth $727M USD, Canada was ranked 12th globally for imports of electronic cameras in 2014. Nearly 900 million electronic cameras worth over $35B USD were exported globally in 2014. The value of global exports has been dropping in recent years, overall down by 15% since 2011. The total quantity of exports is on a downward trend, down more than 21% overall since 2011. With 1.4 million exports worth $444M USD, Canada was ranked 13th globally for exports of electronic cameras in 2014.
NRC acquired a research report from Naviga t Resea h e titled Ad a ed Batte y T a ke Q : Global Shipments of Advanced Batteries by Application Sector: Automotive, Stationary Energy Storage, a d Co su e Ele t o i s. The epo t t a ks glo al ship e ts of ad a ed atte ies utilized in automotive electrification, stationary energy storage, and consumer electronics.
Navigant Research found that total global shipments of advanced batteries in 2014 were 53.3 GWh. Consumer electronics comprised the bulk of shipments, followed by Automotive and Stationary Energy Storage. 2014 saw continued growth with increased demand for consumer electronics, electric vehicles and systems for storing grid energy at commercial and industrial locations. Globally, 67.1 GW of batteries were purchased, most of which utilized in electrified vehicles of varying type. Automotive consumed greatest market share of batteries in 2014, representing a 112% increase from 2013.
2014 saw shipments of more than 7 billion individual battery cells, up slightly from 2013. Due to heavy demand in the automotive sector, 2014 saw advanced battery shipments worth in excess of $14.1B USD in revenue, up 7.1% over 2013. 2014 saw little change from 2013 regarding the top ten countries manufacturing advanced batteries. China remained the leader in energy capacity market share in 2014, but was down somewhat from 2013. This was followed by production output from both Japan and South Korea. The Asia Pacific region was responsible for 96% of global advanced battery production in 2014.
The report investigated shipments within three industry sectors – automotive, stationary energy storage, and consumer electronics. Navigant Research targeted battery shipments for light duty consumer classes of battery electric vehicles, plug-in hybrid vehicles, and hybrid electric vehicles. In 2014, close to 8.2 GWh of advanced batteries worth $2.7 billion were produced for automotive
applications, considerably surpassing 2013 production of 4.9 GWh worth $2.2 billion. Navigant Research targeted distributed energy storage, including residential, commercial and industrial, community storage projects, and utility-scale grid energy storage installations. In 2014, 300.6 MWh of advanced batteries worth $114.9M USD were produced for stationary energy storage installations, considerably surpassing 2013 production of 148.2 MWh worth $86.7M USD. 2014 saw continued growth in the consumer electronics sector although public preferences for form factors shifted. Production of advanced batteries for consumer electronics increased to 44.8 GWh in 2014, an increase of 8.7% over the 41.2 GWh sold in 2013.
More than 99% of the energy capacity of the advanced batteries represented in the report consisted of Li-ion chemistries. With nearly 85% of market share, advanced Li-ion batteries of lithium cobalt oxide chemistry continued market dominance in 2014.
Information is needed about shipments of lithium batteries and products containing them, in order to understand the volume of freight movement in and out of Canada. We carried out a detailed analysis of the same four classifications as was done for the global trade analysis.
There was no export or re-export data available for portable devices & computers. A total of 9.4 million portable devices and computers worth $4.5B were imported into Canada in 2014. The value of global imports has essentially remained flat from 2011 to 2014. The total quantity of units received has been steadily growing from 2011 to 2014. Canada imported the highest value of portable devices and computers from China than any other country in 2014.
A total of 28 million lithium primary cells and batteries worth $70M were imported into Canada in 2014. The value of global imports has been steadily increasing from 2011 to 2014. The total quantity of units imported is rising up nearly 50% since 2011. 2014 saw about one million domestic exports of lithium primary cells and batteries worth $110M. There were about half as many re-exports of lithium primary cells and batteries from Canada as compared to domestic exports in 2014 but these units accounted for far less value, $5.4M or about 5% of exports. Total quantity of units shipped showed an upward trend from 2011 to 2014. Total value of re-exports is trending up, increasing by more than 46% from 2011 to 2014.
A total of $105M worth of Li-ion electric accumulators was imported into Canada in 2014. The value of global imports has been steadily increasing from 2012 to 2014. 2014 saw just under one million domestic exports of Li-ion electric accumulators worth nearly $18M. The total quantity of units shipped increased sharply from 2012 to 2013 and went down only slightly in 2014. The total value of Canadian domestic exports is on a significant upward trend increasing nearly 400% from 2012 to 2014. There were about 4.8M re-exports of Li-ion electric accumulators from Canada in 2014. Total quantity and value of re-exports showed minor downward trends from 2011 to 2014.
A total of 7.4 million electronic cameras worth $804M were imported into Canada in 2014. The value of global imports is down 22% overall from 2011. 2014 saw slightly more than 908,000 domestic exports of electronic cameras worth $360M. The total quantity of units shipped is steadily increasing, up more
than 92% since 2011. The same can be said about the total value of exports, rising nearly 80% in that time frame. There were about half a million re-exports of electronic cameras worth more than $130M from Canada in 2014. Total quantity of re-exports is on a minor downward trend, losing about 14% since 2011. The total value of re-exports is rising, up 22% overall since 2011.
New portable and electronic devices, as well as utility scale energy storage, are increasingly being powered by lithium batteries. Over the years, the use and transportation of lithium batteries has grown dramatically. The safe transportation of lithium batteries is of paramount importance for Canadian industry and consumers at large, and has an impact on many organizations across the country. NRC prepared a survey on lithium battery transportation asking questions regarding shipping and receiving of new and used lithium batteries within various organizations in the lithium battery supply chain.
To ensure that current safety regulations keep pace with the growing applications for lithium batteries, NRC requested industry participation in a market data survey, to better understand the current battery transportation environment. Of the 173 industry representatives contacted, 38 individuals initiated the survey and 31 completed the survey in full. A thorough analysis was completed after all the results were received and compiled.
The majority of companies are involved in the following lithium battery supply chains: retailing/distribution; equipment/system manufacture; wholesale; and shipping/carrier. Most companies produce, use, ship or receive original (new) products in these sectors: equipment/system manufacture; retailing/distribution; shipping/carrier & lithium battery end user – corporate; and battery manufacture & wholesale.
The bulk of companies have 5 to 9 years of experience developing or integrating lithium cells or batteries. The most common applications were off-grid or grid energy storage, laptops, personal electronic devices (PED) (e.g., smartphones and tablets), and handheld instrumentation. The most common trade activity was importing products into Canada.
The majority of companies ship and receive products containing lithium batteries. Companies had essentially equal experience shipping as they did receiving products. By far, ground transportation is the most common mode used to ship and receive lithium cells, batteries or equipment containing Li batteries. Most companies ship less than 25% of their products by air. However, there is an unequal distribution in the percentage of products received by air. Only one company ships more than 100 shipments per year. Similarly, only one company receives more than 100 shipments per year. The majority of companies do, in fact, ship and receive Li cells, batteries or equipment containing Li batteries on a regular schedule. The most common products shipped are batteries, equipment containing batteries, equipment packaged with batteries, and cells. The most common products received are batteries, cells, equipment containing batteries, and equipment packaged with batteries. About 2/3 of the cells and batteries shipped and received are lithium ion, 19-22% are lithium metal, and 9-10% are other chemistries. By far, the majority of companies ship and receive lithium ion cells or batteries.
Most companies report having shipped all or almost all products with a brand name or trademark. Fewer companies report having received all or almost all products with a brand name or trademark. The vast majority of companies report having shipped and received batteries classified as Class 9 dangerous goods. One company reported that they receive batteries that are not classified as Class 9 dangerous goods. One company reported being exempt for both shipping and receiving.
More companies reported having shipped only 1 to 2 cell/batteries per shipment and having received 50 to 499 cell/batteries per shipment. The majority of companies ship and receive between 10 and 1,000kg of cells/batteries per shipment. All companies reported having shipped an average of 1 to 24 pieces of equipment containing batteries per shipment. Most reported having received similar numbers of equipment.
Products are being shipped and received in varying average states of charge with slightly more reporting having shipped and received products 50-100%SOC. Somewhat troubling is that seven companies reported that they do not know the average state of charge for each shipment sent and/or received. Products of varying capacities are being shipped and received. The majority of the products shipped and received have an energy content >100Wh.
Companies reported shipping the bulk of their products containing lithium batteries within Canada, with the US being the next most popular destination and China a distant 3rd. Companies reported receiving the bulk of their products containing lithium batteries from the US, with Canada and China tying for the 2nd most popular source country, and South Korea a distant 3rd. Companies reported that they ship products to all 10 Canadian provinces and three territories. Ontario sees products from the most companies, followed by Quebec, and then BC and Alberta (tied for 3rd). Ontario is the source of product for the most companies, followed by Quebec, and then BC. No companies reported sourcing products from New Brunswick, Nova Scotia, Prince Edward Island, or any of the three territories.
1.
Introduction
In FY 2014-2015, NRC reviewed codes and standards for general lithium battery safety, as well as specific reports, regulations and protocols for air transport of batteries for Transport Canada. That project generated a request for an in-depth study of the safety risks associated with the air transport of lithium batteries. The study is comprised of global trade data analysis to understand the world commodity flows of lithium batteries and products containing batteries, an investigation of developments and trends in the global lithium battery market, Canadian trade data analysis to understand the commodity flows of lithium batteries and products containing batteries into and out of Canada, and a survey on lithium battery transportation asking specific questions regarding shipping and receiving of new and used lithium batteries within various organizations in the Canadian lithium battery supply chain.
2.
2011-2014 Global Trade Analysis of Lithium Batteries, Battery Packs and
Products Containing Lithium Batteries
2.1
Purpose
Information is needed about shipments of lithium batteries and products containing them, in order to understand the volume of freight movement into and out of Canada and around the world, which could pose risks and therefore require special regulation. This report includes analysis of a subset of data collected from 71 product classifications from various categories identified by NRC (Appendix A – 71 HS Codes Identified).
2.2
Key Questions
• What information is available about the total number of lithium battery packs and cells imported by other countries, and how does this compare with commodity flows into Canada? • What information is available about the number of lithium battery packs and cells
exported/re-exported by other countries, and how does this compare with commodity flows out of Canada? • What information is available about the total number of products which may contain lithium
batteries imported by other countries, and how does this compare with commodity flows into Canada? Products include items such as personal electronic devices, power tools, land vehicles, marine vehicles, aerial vehicles, household devices, and hand held instruments.
• What information is available about the number of products which may contain lithium batteries exported/re-exported by other countries, and how does this compare with commodity flows out of Canada? Products include items such as personal electronic devices, power tools, land vehicles, marine vehicles, aerial vehicles, household devices, and hand held instruments.
2.3
Methodology
Harmonized System (HS) product codes were used to retrieve statistics for Canadian trade in lithium batteries and/or finished products containing lithium batteries as follows:
• Imports - goods that have entered the country by crossing territorial (customs) boundaries, whether for immediate domestic consumption (following the payment of any duty) or for storage in customs (bonded) warehouses.
• Domestic Exports - goods grown, produced, extracted or manufactured in Canada leaving the country, through customs, for a foreign destination.
• Re-exports - goods that have previously entered Canada that are leaving in the same condition as when first imported.
2.4
Sources Consulted
United Nations (UN) - Comtrade Database comtrade.un.org/data
2.5
Summary of Results
The goods are classified according to the HS nomenclature, based on HS2012, in accordance with the World Customs Organization. The system provides a good level of specificity for the identification of products, but the reader should be aware that it does not indicate whether or not battery-operated products contain installed batteries at the time of shipment. It is also important to be aware that the information applies to classes of products; in certain cases, information for specific products is aggregated in larger categories. While the information does not provide a breakdown of the mode of transport, it does provide a sense of the volume of commodity flows around the world.
There were a total of 71 different classifications originally identified (Appendix A – 71 HS Codes Identified) and the detailed datasets are available upon request. Two classifications related directly to lithium cells, batteries and accumulators and the remainder were seen as having the potential for
containing lithium batteries. Table 1 outlines the four classifications that were included in our detailed analysis.
Table 1 HS Code Product Classifications included in detailed analysis
HS Code Description
847130 Portable automatic data processing machines, wt <= 10 kg, with cpu, keyboard and display
850650 Lithium primary cells and batteries
850760 Lithium-ion electric accumulators, including separators therefor, whether or not rectangular (including square)
852580 Television cameras, digital cameras and video camera recorders
Data for 2015 was available in some cases but incomplete and inaccurate. Therefore, 2014 was chosen as the most current baseline of complete and accurate data. There were significant gaps and inconsistencies observed with the data for re-exports from the UN Comtrade Database so no analysis was performed on any re-exports. In some cases, it was determined that re-exports were lumped together with exports.
Data is sorted by the top ten countries in the world for imports and exports and ranked by value in US dollars in 2014, Value (USD) 2014. As such, in many cases, you will notice the quantity data, Quantity (NMB - number), is not necessarily in order. Furthermore, we decided to maintain this order for data from previous years (as far back as 2011, if available) in order to illustrate historical trends of growth and/or recession of trade with these same 10 countries. In many cases, these top ten countries represent the vast majority (95%+) of trade values and quantities. In other cases, they represent significantly less. The latter is more likely with the quantity data since the top ten ranking is based on value and not quantity. Also, the top ten countries ranked by value vary from year to year, i.e. for years prior to 2014, there will be a high probability that other countries will displace those in the top ten for 2014. Unfortunately, there are several gaps in the quantity data as some countries either did not report or chose only to report shipments in kilograms, which is not readily comparable at this time. Finally, it is unclear as to whether the quantity unit refers to a singular item (cell, battery pack, equipment) or the package being shipped (consignment).
2.5.1
HS 847130: Portable automatic data processing machines, wt <= 10kg,
with cpu, keyboard and display
Fo si pli ity, e ill efe to this lassifi atio as po ta le de i es & o pute s . It is assu ed that a large proportion of these products would incorporate secondary (rechargeable) lithium ion batteries.
2.5.1.1
Imports
Figure 1 and Figure 2 show the data from 2011-2014. Nearly 440 million portable devices and computers worth $147B USD were imported globally in 2014. The value of global imports has essentially remained flat, up only 3% from 2011 to 2014. The total quantity of imports are on the rise, climbing 22% in 2012 and 26% in 2013, then remaining flat in 2014 but up 52% overall since 2011. The US imported portable devices and computers of highest value in 2014, accounting for 29% of total value and 22% of total quantities reported. With 9.4 million imports worth $4.1B USD, Canada was ranked 8th globally for imports of portable devices and computers in 2014 with 2.78% of total value and 2.15% of total quantities reported.
Figure 1 HS 847130: Portable Devices and Computers, Quantity of Global Imports
Figure 2 HS 847130: Portable Devices and Computers, Value of Global Imports
2.5.1.2
Exports
Figure 3 and Figure 4 show the data from 2011-2014. 2014 saw more than 470 million global exports of portable devices and computers worth in excess of $150B USD. The value of global exports has essentially remained flat, up only 5% from 2011 to 2014. The total quantity of exports is steadily climbing, rising 17% in 2012, 11% in 2013, 7% in 2014 and up 40% overall since 2011. China exported the overwhelming majority of portable devices and computers worth the highest value in 2014, accounting for 72% of total value and 71% of total quantities reported. With 815 thousand exports worth $354M USD, Canada was ranked 22nd globally for exports of portable devices and computers in 2014 with 0.23% of total value and 0.17% of total quantities reported.
Figure 3 HS 847130: Portable Devices and Computers, Quantity of Global Exports
Figure 4 HS 847130: Portable Devices and Computers, Value of Global Exports
2.5.2
HS 850650 (UN 3090): Lithium primary cells and batteries
2.5.2.1
Imports
Figure 5 and Figure 6 show the data from 2011-2014. More than 2.9 billion lithium primary cells and batteries worth nearly $2.5B USD were imported globally in 2014. The value of global imports has been rising in recent years, with a slight dip in 2013, but overall up about 11% from 2011 to 2014. The total quantity of imports is on a downward trend, rising 6% in 2012 but dropping 8% in 2013 and a further 10% in 2014, down overall about 13% since 2011. The US imported lithium primary cells and batteries of highest value in 2014, accounting for 13% of total value. Unfortunately, the US did not report total quantity for 2014 imports. However, it is evident that China and Hong Kong have been the leaders in terms of total quantities, together representing nearly 56% of total quantities reported in 2014. With 28 million imports worth $63M USD, Canada was ranked 12th globally for imports of lithium primary cells and batteries in 2014 with 2.56% of total value and 0.97% of total quantities reported.
Figure 5 HS 850650: Lithium Primary Cells and Batteries, Quantity of Global Imports
Figure 6 HS 850650: Lithium Primary Cells and Batteries, Value of Global Imports
2.5.2.2
Exports
It appears as though the UN Comtrade Database combined Canadian re-exports with exports. Furthermore, it is obvious that the UN Comtrade Database double counted Re-exports for 2011, since they were already included in Exports. See Table 2 for clarification. More detailed Canadian data was gathered from the Canadian International Merchandise Trade (CIMT) database at Statistics Canada (Refer to Section 4).
Table 2 UN Comtrade Database reporting of exports and re-exports for HS 850650
Quantity (NMB) 2011 2012 2013 2014
UN - Exports 1,262,949 598,799 1,196,326 1,504,994
CIMT - Exports 1,092,901 468,204 437,567 991,151
UN - Re-exports 168,582 - - -
CIMT - Re-exports 168,582 130,595 758,737 513,841
CIMT Exports + Re-exports 1,261,483 598,799 1,196,304 1,504,992
Figure 7 and Figure 8 show the data from 2011-2014. More than 2.4 billion lithium primary cells and batteries worth nearly $2.5B USD were exported globally in 2014. The value of global exports has been rising in recent years, up about 33% from 2011 to 2014. The total quantity of exports remained essentially flat from 2011 to 2012, dropped nearly 14% in 2013, and then climbed again by 32% in 2014, overall up about 15% since 2011. Singapore exported lithium primary cells and batteries of highest
value in 2014, worth 18% of total value and just beating out the US. Unfortunately, Singapore has not reported total export quantities from 2011 to 2014. However, it is evident that China and Hong Kong have been the leaders in terms of total quantities, together representing nearly 62% of total quantities reported in 2014. With 1.5 million exports worth almost $105M USD, Canada was ranked 9th globally for exports/re-exports of lithium primary cells and batteries in 2014 with 4.23% of total value and 0.06% of total quantities reported.
Figure 7 HS 850650: Lithium Primary Cells and Batteries, Quantity of Global Exports
Figure 8 HS 850650: Lithium Primary Cells and Batteries, Value of Global Exports
2.5.3
HS 850760 (UN 3480): Lithium-ion electric accumulators, including
separators therefor, whether or not rectangular (including square)
There was no data available for 2011 for this classification since countries only started recording data for Li-ion batteries in 2012.
2.5.3.1
Imports
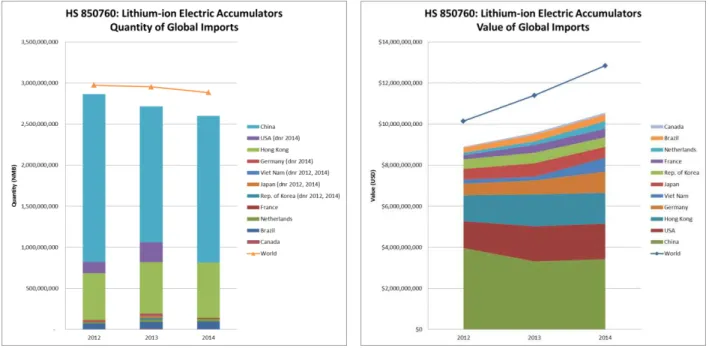
Figure 9 and Figure 10 show the data from 2012-2014. More than 2.8 billion Li-ion electric accumulators worth over $12.8B USD were imported globally in 2014. The value of global imports has been rising in recent years, rising about 12% in each of 2013 and 2014, and up overall about 27% from 2012 to 2014. The total quantity of imports is on a downward trend, dropping very slightly in 2012 and a further 2% in 2013, down overall about 3% since 2012. China imported the most Li-ion electric accumulators worth the highest value in 2014, accounting for 27% of total value and 62% of total quantity. If you include
Hong Kong, then this represents 38% of total value and 85% of total quantities reported in 2014. With 5.7 million imports worth $95M USD, Canada was ranked 19th globally for imports of Li-ion electric accumulators in 2014 with 0.74% of total value and 0.20% of total quantities reported.
Figure 9 HS 850760: Lithium-ion Electric Accumulators, Quantity of Global Imports
Figure 10 HS 850760: Lithium-ion Electric Accumulators, Value of Global Imports
2.5.3.2
Exports
It appears as though the UN Comtrade Database combined Canadian re-exports with exports (Table 3).
Table 3 UN Comtrade Database reporting of exports and re-exports for HS 850760
Quantity (NMB) 2011 2012 2013 2014
UN - Exports - 6,024,170 5,774,620 5,739,649
CIMT - Exports - 56,859 1,000,562 961,548
UN - Re-exports - - - -
CIMT - Re-exports - 5,967,311 4,774,058 4,778,101
CIMT Exports + Re-exports - 6,024,170 5,774,620 5,739,649
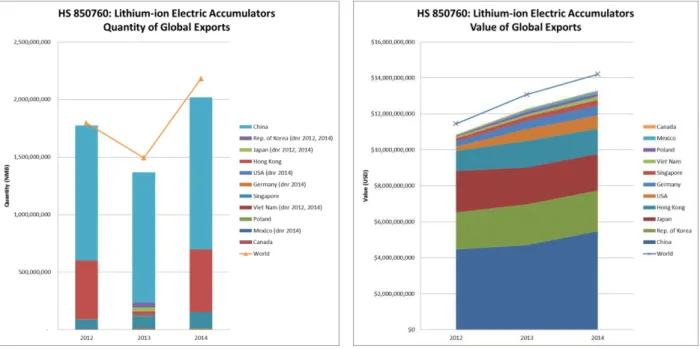
Figure 11 and Figure 12 show the data from 2012-2014. Nearly 2.2 billion Li-ion electric accumulators worth over $14.2B USD were exported globally in 2014. The value of global exports has been rising in recent years, climbing 14% in 2013 and 9% in 2014, and up overall about 24% from 2012 to 2014. The total quantity of exports has fluctuated in recent years, dropping nearly 17% in 2012 and then jumping 46% in 2013, up overall about 22% since 2012. China exported the majority of Li-ion electric accumulators worth the highest value in 2014, accounting for 39% of total value and 61% of total
quantities reported. With 5.7 million exports worth nearly $43M USD, Canada was ranked 19th globally for exports of Li-ion electric accumulators in 2014 with 0.30% of total value and 0.26% of total quantities reported.
Figure 11 HS 850760: Lithium-ion Electric Accumulators, Quantity of Global Exports
Figure 12 HS 850760: Lithium-ion Electric Accumulators, Value of Global Exports
2.5.4
HS 852580: Television cameras, digital cameras and video camera
recorders
Fo si pli ity, e ill efe to this lassifi atio as ele t o i a e as . It is assu ed that a la ge proportion of these products would incorporate secondary (rechargeable) lithium ion batteries.
2.5.4.1
Imports
Figure 13 and Figure 14 show the data from 2011-2014. More than one billion electronic cameras worth over $41B USD were imported globally in 2014. The value of global imports rose in 2012 by 9% but has been dropping in recent years, down 3% in 2013 and 16% in 2014, overall down by 11% since 2011. The total quantity of imports is on a slight upward trend, dropping 7% in 2012, then rebounding nearly 15% in 2013, but again slipping almost 3% in 2014, but up overall about 3% since 2011. China imported by far the most electronic cameras worth the highest value in 2014, accounting for 25% of total value and 73% of total quantities reported. With 7.4 million imports worth $727M USD, Canada was ranked 12th globally for imports of electronic cameras in 2014 with 1.76% of total value and 0.68% of total quantities reported.
Figure 13 HS 852580: Electronic Cameras, Quantity of Global Imports
Figure 14 HS 852580: Electronic Cameras, Value of Global Imports
2.5.4.2
Exports
It appears as though the UN Comtrade Database combined Canadian re-exports with exports. Furthermore, it is obvious that the UN Comtrade Database double counted Re-exports for 2011, since they were already included in Exports. Refer to Table 4 below.
Table 4 UN Comtrade Database reporting of exports and re-exports for HS 852580
Quantity (NMB) 2011 2012 2013 2014
UN - Exports 1,072,063 1,179,247 1,401,403 1,424,403
CIMT - Exports 471,858 617,201 867,425 908,123
UN - Re-exports 600,212 - - -
CIMT - Re-exports 600,193 562,046 533,978 516,280
CIMT Exports + Re-exports 1,072,051 1,179,247 1,401,403 1,424,403
Figure 15 and Figure 16 show the data from 2011-2014. Nearly 900 million electronic cameras worth over $35B USD were exported globally in 2014. The value of global exports rose in 2012 by 8% but has been dropping in recent years, down 4% in 2013 and 18% in 2014, overall down by 15% since 2011. The total quantity of exports is on a downward trend, dropping 12% in 2012, then rebounding 13% in 2013, but again slipping more than 20% in 2014, down more than 21% overall since 2011. China exported the overwhelming majority of electronic cameras worth the highest value in 2014, accounting for 33% of total value and 89% of total quantities reported. With 1.4 million exports worth $444M USD, Canada
was ranked 13th globally for exports of electronic cameras in 2014 with 1.26% of total value and 0.16% of total quantities reported.
Figure 15 HS 852580: Electronic Cameras, Quantity of Global Exports
Figure 16 HS 852580: Electronic Cameras, Value of Global Exports
3.
2014 Global Shipments of Advanced Batteries for Automotive, Stationary
Energy Storage, and Consumer Electronics Applications
3.1
Introduction
NRC a ui ed a esea h epo t f o Na iga t Resea h e titled Ad a ed Batte y T a ke Q : Global Shipments of Advanced Batteries by Application Sector: Automotive, Stationary Energy Storage, a d Co su e Ele t o i s. The epo t t a ks glo al ship e ts of ad a ed atte ies i o de to glea information about technology progress and market trends. Navigant Research has shifted its focus from the medical and defense advanced battery sectors to the growing sectors of automotive electrification, stationary energy storage, and consumer electronics (including power tools). All comparisons with p e ious yea ’s pe fo a e a e ased o i fo atio f o ea lier editions of the report.
The market for advanced batteries is continuing to grow in large part to increases in demand for consumer electronics such as smartphones, electric vehicles (battery electric, plug-in hybrid electric, and hybrid electric), and stationary grid energy storage systems.
The report defines advanced batteries as rechargeable batteries consisting of chemistries that began being mass-produced within the last 20 years. It excludes all chemistries still in research and development phases. In addition to all lithium ion chemistries, they also include advanced lead-carbon, aqueous sodium ion, all flow battery chemistries, sodium-metal halide, and sodium sulphur.
3.2
Global Shipments in 2014
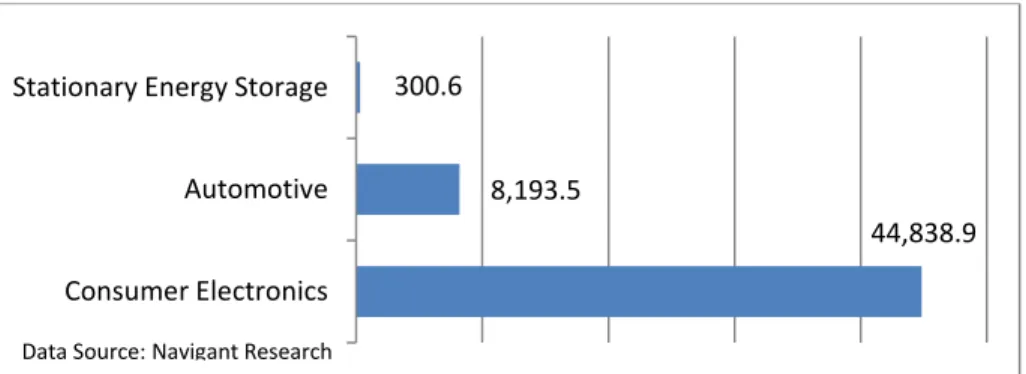
Navigant Research found that total global shipments of advanced batteries in 2014 were 53.3 GWh, representing an increase of 12.8% in energy capacity as compared to 2013. Consumer electronics comprised the bulk of shipments, followed by Automotive and Stationary Energy Storage (Figure 17).
Figure 17 2014 Global Energy Capacity (MWh) of Advanced Batteries by Application Sector
3.3
The Market Position in 2014
2014 saw continued growth with increased demand for consumer electronics, electric vehicles and systems for storing grid energy at commercial and industrial locations. Globally, 67.1 GW of batteries were purchased, most of which utilized in electrified vehicles of varying type. This is represents a 68% increase from 2013. Automotive consumed the greatest market share of batteries in 2014 (Figure 18), representing a 112% increase from 2013.
Figure 18 2014 Global Power Capacity (MW) of Advanced Batteries by Application Sector
44,838.9 8,193.5
300.6
Consumer Electronics Automotive Stationary Energy Storage
Data Source: Navigant Research
48,935.2 18,018.1
176.0
Automotive Consumer Electronics Stationary Energy Storage
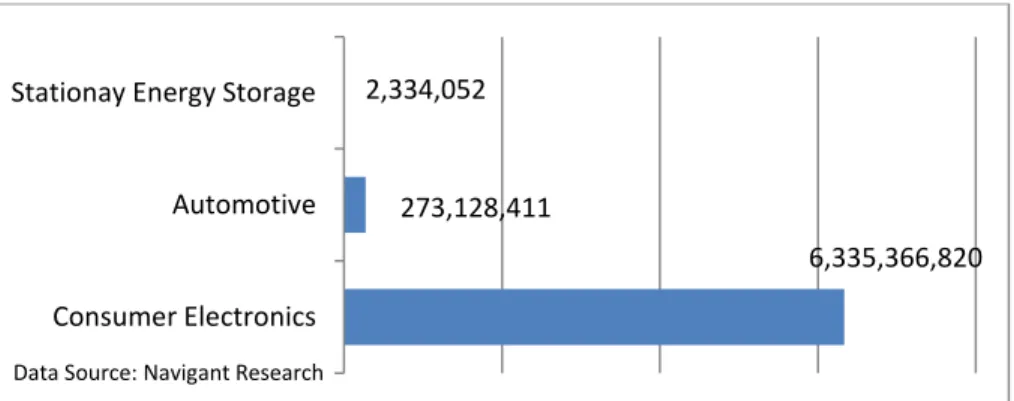
2014 saw shipments of more than 7 billion individual battery cells, up slightly from 2013 (Figure 19). Automotive cell shipments are relatively low compared to the proportion of power and energy capacity that the sector accounts for.
Figure 19 2014 Global Cell Shipments of Advanced Batteries by Application Sector
Due to heavy demand in the automotive sector, 2014 saw advanced battery shipments worth in excess of $14.1B USD in revenue, up 7.1% over 2013 (Figure 20). As costs go down and performance and safety improve, batteries become more attractive and sales improve, resulting in year-over-year revenue growth in the industry.
Figure 20 2014 Global Revenue of Advanced Batteries by Application Sector
3.3.1
2014 Shipments by Country of Origin
Little changed between 2013 and 2014 regarding the top ten countries manufacturing advanced batteries. China remained the leader in energy capacity market share in 2014, but was down somewhat from 2013. This was followed by production output from both Japan and South Korea (Figure 21). The Asia Pacific region was responsible for 96% of global advanced battery production in 2014.
6,335,366,820 273,128,411
2,334,052
Consumer Electronics Automotive Stationay Energy Storage
Data Source: Navigant Research
$11,300,870,530 $2,703,409,725
$114,946,397
Consumer Electronics Automotive Stationary Energy Storage
Figure 21 2014 Global Energy Capacity Market Share by Country of Origin
3.3.2
2014 Shipments by Application Sector
The report investigated shipments within three industry sectors – automotive, stationary energy storage, and consumer electronics.
3.3.2.1
Shipments of Automotive Batteries
Navigant Research targeted battery shipments for light duty consumer classes of battery electric vehicles, plug-in hybrid vehicles, and hybrid electric vehicles.
In 2014, close to 8.2 GWh of advanced batteries worth $2.7 billion were produced for automotive applications, considerably surpassing 2013 production of 4.9 GWh worth $2.2 billion. This represents an increase in production of 67% and in value of 23%, with the lower average cell cost reflecting cost reductions occurring in the industry.
Panasonic continued to lead global market share of automotive advanced batteries in 2014, followed by AESC and LG Chem (Table 5).
35.2% 30.8% 28.5% 4.8% 0.3% 0.1% 0.1% China Japan South Korea USA France Germany UK
Table 5 2014 Global Energy Capacity Market Share of Advanced Batteries by Top 10 Manufacturers within Automotive Sector
Company Market Share
Panasonic 38.3% AESC 18.8% LG Chem 13.9% LEJ 5.7% Samsung SDI 5.0% BYD 4.6% Tianneng Group 2.8% A123 Systems 2.2% Blue Energy 2.0%
Beijing Pride Power Company 1.5%
Others 5.2%
Data Source: Navigant Research
3.3.2.2
Shipments of Stationary Energy Storage Batteries
Navigant Research targeted distributed energy storage, including residential, commercial and industrial, community storage projects, and utility-scale grid energy storage installations.
In 2014, 300.6 MWh of advanced batteries worth $114.9M USD were produced for stationary energy storage installations, considerably surpassing 2013 production of 148.2 MWh worth $86.7M USD. This represents an increase in production of 103% and in value of 33%. LG Chem led the market in 2014, followed by Saft and both Panasonic and Samsung with slightly more than 10% share (Table 6).
Table 6 2014 Global Energy Capacity Market Share of Advanced Batteries by Top 10 Manufacturers within Stationary Energy Storage Sector
Company Market Share
LG Chem 31.3% Saft 20.0% Panasonic 10.7% Samsung SDI 10.2% Gildemeister 4.5% Ashlawn Energy 2.9% NEC Energy Solutions 2.7%
BYD 1.7%
UniEnergy Technologies 1.3%
Toshiba 1.2%
Others 13.4%
3.3.2.3
Shipments of Consumer Electronics Batteries
2014 saw continued growth in the consumer electronics sector although public preferences for form factors shifted. Laptop computers and, to a lesser extent, tablet sales continued to show a slowing trend but smartphones sales continued to climb.
In the face of these changes in consumer demand and the ensuing effects on market share, production of advanced batteries for consumer electronics increased to 44.8 GWh in 2014, an increase of 8.7% over the 41.2 GWh sold in 2013. Total earnings increased from $10.9B USD to $11.3B USD and total shipments increased from 6.5 billion to 6.7 billion. Samsung SDI continued to lead the market in 2014, followed by LG Chem and BYD each with around 11%, and Amperex Tech Ltd (Table 7).
Table 7 2014 Global Energy Capacity Market Share of Advanced Batteries by Top 10 Manufacturers within Consumer Electronics Sector
Company Market Share
Others 24.3% Samsung SDI 17.7% BYD 11.0% LG Chem 11.2% Amprex Tech Ltd 9.7% Panasonic 8.6% Sony 7.1% Lishen 6.4% Hitachi 3.9%
Data Source: Navigant Research
3.3.3
2014 Shipments by Battery Chemistry
More than 99% of the energy capacity of the advanced batteries represented in the report consisted of Li-ion chemistries, which is favoured by makers of EVs and consumer electronics. The stationary energy storage market was the only application sector that used other chemistries in significant quantities, where flow batteries, sodium-metal halide and advanced lead-acid batteries were deployed in 2014. With nearly 85% of market share, advanced Li-ion batteries of lithium cobalt oxide chemistry continued market dominance in 2014, due to continued high demand from the consumer electronics industry (Table 8). Other Li-ion subchemistries that utilize cobalt also increased market presence. The report also highlighted that the manganese spinel subchemistries are expected to continue to be blended with nickel manganese cobalt with the push for increased energy density.
Table 8 2014 Global Energy Capacity Market Share of Advanced Batteries by Li-ion Subchemistry
Subchemistry Market Share
Li Cobalt Oxide 84.7%
Li Manganese Spinel 7.1% Li Nickel Cobalt Aluminum 5.9% Li Iron Phosphate 1.7%
Li Polymer 0.3%
Li Nickel Manganese Cobalt 0.2%
Li Titanate 0.0%
Data Source: Navigant Research
4.
2011-2014 Canadian Trade Analysis for Lithium Batteries, Battery Packs
and Products Containing Lithium Batteries
4.1
Purpose
Information is needed about shipments of lithium batteries and products containing them, in order to understand the volume of freight movement in and out of Canada which could pose risks and therefore require special regulation. This report includes analysis of a subset of data collected from 71 product classifications from various categories identified by NRC (Appendix A – 71 HS Codes Identified).
4.2
Key Questions
• What information is available about the number of lithium battery packs and cells, imported into Canada?
• What information is available about the number of lithium battery packs and cells exported from Canada as domestic exports and re-exported from Canada to other countries?
• What information is available about the number of products which may contain lithium batteries imported into Canada? Products include items such as personal electronic devices, power tools, land vehicles, marine vehicles, aerial vehicles, household devices, and hand held instruments.
• What information is available about the number of products which may contain lithium batteries exported from Canada as domestic exports and re-exported from Canada to other countries? Products include items such as personal electronic devices, power tools, land vehicles, marine vehicles, aerial vehicles, household devices, and hand held instruments.
4.3
Methodology
Harmonized System (HS) product codes were used to retrieve statistics for Canadian trade in lithium batteries and/or finished products containing lithium batteries as follows:
• Imports - goods that have entered the country by crossing territorial (customs) boundaries, whether for immediate domestic consumption (following the payment of any duty) or for storage in customs (bonded) warehouses.
• Domestic Exports - all goods grown, produced, extracted or manufactured in Canada leaving the country, through customs, for a foreign destination.
• Re-exports - goods that have previously entered Canada that are leaving in the same condition as when first imported.
4.4
Sources Consulted
Statistics Canada - Canadian International Merchandise Trade (CIMT) http://www5.statcan.gc.ca/cimt-cicm
4.5
Summary of Results
The goods are classified according to the HS nomenclature, based on HS2012, in accordance with the World Customs Organization. The system provides a good level of specificity for the identification of products, but the reader should be aware that it does not indicate whether or not battery-operated products contain installed batteries at the time of shipment. It is also important to be aware that the information applies to classes of products; in certain cases, information for specific products is aggregated in larger categories. While the information does not provide a breakdown of the mode of transport, it does provide a sense of the volume of goods that enter and exit Canada.
There were a total of 71 different classifications originally identified (Appendix A – 71 HS Codes Identified) and the detailed datasets are available upon request. Two classifications related directly to lithium cells, batteries and accumulators and the remainder were seen as having the potential for containing lithium batteries. We carried out a detailed analysis of the same four classifications as was previous mentioned in Section 2.
Data for 2015 was available in some cases but incomplete and inaccurate. Therefore, 2014 was chosen as the most current baseline of complete and accurate data. Data is sorted by the top ten countries that
Canada imported from, exported and re-exported to, and ranked by value in Canadian dollars in 2014, Value (CAD) 2014. As such, in many cases, you will notice the quantity data, Quantity (NMB - number), is not necessarily in order. Furthermore, we decided to maintain this order for data from previous years (as far back as 2011, if available) in order to illustrate historical trends of growth and/or recession of trade with these same 10 countries. In many cases, these top ten countries represent the vast majority (95%+) of trade values and quantities. In other cases, they represent significantly less. The latter is more likely with the quantity data since the top ten ranking is based on value and not quantity. Also, the top ten countries ranked by value vary from year to year, i.e. for years prior to 2014, there will be a high probability that other countries will displace those in the top ten for 2014. Finally, it is unclear as to whether the quantity unit refers to a singular item (cell, battery pack, equipment) or the package being shipped (consignment).
4.5.1
HS 847130: Portable automatic data processing machines, wt <= 10kg,
with cpu, keyboard and display
There was no export or re-export data available for this classification. For simplicity, we will refer to this lassifi atio as po ta le de i es & o pute s . It is assumed that a large proportion of these products would incorporate secondary (rechargeable) lithium ion batteries.
4.5.1.1
Imports
Figure 22 HS 847130: Portable Devices and Computers, Quantity of Imports into Canada
Figure 23 HS 847130: Portable Devices and Computers, Value of Imports into Canada
A total of 9.4 million portable devices and computers worth $4.5B were imported into Canada in 2014. The value of global imports has essentially remained flat, up only 2% from 2011 to 2014. The total quantity of units received has been steadily growing, rising 2% from 2011 to 2012, 12% in 2013, and 3% in 2014. Canada imported the highest value of portable devices and computers from China than any other country in 2014, about 85% of total units received worth more than 90% of total value. This was followed by Vietnam and the US. Imports from China have been increasing from 2011 to 2014, climbing 27% in quantity and 13% in value. Interestingly, Vietnam exported very few portable devices and computers to Canada in 2011 and 2012 but the value skyrocketed in 2013 nearly 500-fold, followed by a 36% increase in 2014. The quantity of these imports rose even more, jumping 1485-fold in 2013 and by 50% in 2014. Imports from Taiwan have gone down dramatically since 2011, dropping more than 25-fold in quantity and nearly 10-25-fold in value.
4.5.2
HS 850650 (UN 3090): Lithium primary cells and batteries
4.5.2.1
Imports
Figure 24 and Figure 25 show the data from 2011-2014. A total of 28 million lithium primary cells and batteries worth $70M were imported into Canada in 2014. The value of global imports has been steadily increasing with a 23% increase from 2011 to 2014. Although the total quantity of units received dipped slightly in 2013, it appears as though the rising trend is continuing in 2014 with an increase of 32% over the previous year and nearly 50% since 2011. Canada imported more lithium primary cells and batteries
from Indonesia than any other country in 2014. Although 3rd after Indonesia and China for quantity of units shipped, the US provided lithium primary cells and batteries with the highest value in 2014, more than 45% of global imports.
Figure 24 HS 850650: Lithium Primary Cells and Batteries, Quantity of Imports into Canada
Figure 25 HS 850650: Lithium Primary Cells and Batteries, Value of Imports into Canada
4.5.2.2
Exports
Figure 26 and Figure 27 show the data from 2011-2014. 2014 saw about one million domestic exports of lithium primary cells and batteries worth $110M. The total quantity of units shipped decreased by nearly 60% in 2012, dipped again slightly in 2013 and rebounded by 127% in 2014, down only 9% since 2011. On the positive side, the value of Canadian domestic exports has been increasing steadily, up 115% from 2011 to 2014. There was an 85% increase in value from 2011 to 2012, followed by a flat 2013, and then a 16% increase in 2014. Even though total units exported were only 3.5% of imports, total value was 57% more. Units destined for the US dominated global export quantities until 2014, when units to Hong Kong skyrocketed 1,450-fold from 2013, accompanied by a 32-fold increase in value. On the other hand, the highest value of units shipped in 2014 went to France, which accounted for nearly 50% of export value with the US close behind at nearly 40%. France surged past the US in export value in 2012 and has led ever since. The remaining eight countries accounted for only 8% of total export value.
Figure 26 HS 850650: Lithium Primary Cells and Batteries, Quantity of Canadian Domestic Exports
Figure 27 HS 850650: Lithium Primary Cells and Batteries, Value of Canadian Domestic Exports
4.5.2.3
Re-exports
Figure 28 and Figure 29 show the data from 2011-2014. There were about half as many re-exports of lithium primary cells and batteries from Canada as compared to domestic exports in 2014 but these units accounted for far less value, $5.4M or about 5% of exports. Total quantity of units shipped went down by about 23% in 2012 but increased nearly 6-fold in 2013. This was followed by a 32% drop in 2014. After a significant dip in 2012, total value of re-exports is trending up, increasing by more than 46% from 2011 to 2014. 63% of re-export units went to Israel in 2014, although the US was the dominant destination country in past years. The US alone accounted for more than 95% of all re-exports in 2013, which was about 40% more than total global units shipped in 2014. These units represented about 50% of the value of re-exports in 2013. There were no reported re-exports to Israel in 2011, followed by an 833% increase from 2012 to 2013, and an incredible 1,160-fold increase in 2014. Total units destined for the US have fluctuated, dropping 25% from 2011 to 2012, shooting up 650% in 2013, and then dropping more than 75% in 2014. Total value was dominated in 2014 by Israel and the US, who accounted for 55% of the value of total value. Mexico has recently become an attractive market, with re-exports rising 136-fold in value in 2014, representing over 18% of total value.