Atomic-resolution electron microscopy of nanoscale
local structure in lead-based relaxor ferroelectrics
The MIT Faculty has made this article openly available. Please share how this access benefits you. Your story matters.
Citation Kumar, Abinash et al. “Atomic-resolution electron microscopy of
nanoscale local structure in lead-based relaxor ferroelectrics.” Nature Materials, 12 (September 2020): 3876 © 2020 The Author(s)
As Published 10.1038/s41563-020-0794-5
Publisher Springer Science and Business Media LLC
Version Author's final manuscript
Citable link https://hdl.handle.net/1721.1/127773
Terms of Use Article is made available in accordance with the publisher's
policy and may be subject to US copyright law. Please refer to the publisher's site for terms of use.
Atomic-resolution electron microscopy of nanoscale
local structure in lead-based relaxor ferroelectrics
Abinash Kumar
1, Jonathon N. Baker
2, Preston C. Bowes
2, Matthew J. Cabral
2,
Shujun Zhang
3, Elizabeth C. Dickey
2, Douglas L. Irving
2, James M. LeBeau
11Department of Materials Science and Engineering, Massachusetts Institute of Technology,
Cambridge, MA 02139, USA
2Department of Materials Science and Engineering, North Carolina State University, Raleigh,
North Carolina 27695, USA
3Institute for Superconducting and Electronic Materials, Australian Institute of Innovative
Materials, University of Wollongong, Wollongong, NSW 2500, Australia
Abstract
Relaxor ferroelectrics, which can exhibit exceptional electromechanical coupling, are some of the most important functional materials with applications ranging from ultrasound imaging to actuators. Since their discovery, their complexity of nanoscale chemical and structural het-erogeneity has made understanding the origins of their electromechanical properties a seem-ingly intractable problem. Here, we employ aberration-corrected scanning transmission elec-tron microscopy (STEM) to quantify various types of nanoscale heterogeneities and their con-nection to local polarization in the prototypical relaxor ferroelectric system Pb(Mg1/3Nb2/3)O3
-PbTiO3 (PMN-PT). We identify three main contributions that each depend on Ti content:
chemical order, oxygen octahedral tilt, and oxygen octahedral distortion. These heterogeneities are found to be spatially correlated with low angle polar domain walls, indicating their role in disrupting long-range polarization and leading to nanoscale domain formation and the re-laxor response. We further locate nanoscale regions of monoclinic- like distortion that cor-relate directly with Ti content and electromechanical performance. Through this approach, the connection between chemical heterogeneity, structural heterogeneity and local
polariza-tion is revealed, validating models that are needed to develop the next generapolariza-tion of relaxor ferroelectrics.
Relaxor ferroelectrics are distinguished from traditional ferroelectrics by their frequency de-pendent, diffuse phase transitions that are commonly attributed to the existence of nanoscale
or-der.1 Among this class of materials, Pb-based systems remain essential as they exhibit the largest
known piezoelectric coefficients and outstanding dielectric properties.2–4 These properties have
been commonly attributed to the existence of polar nanoregions in the material that align to the
applied field.5,6 This simple model fails, however, to explain relaxor behavior in a variety of
ma-terials, including polymer-based systems.7 The recently proposed “polar slush” model overcomes
these limitations by considering a multi-domain polar state with low energy, low angle domain
walls formed throughout.8Model validation has, however, been hindered by the seemingly endless
number of structural characterization studies with differing interpretations, leading these systems
to be described as a “hopeless mess”.1
Pb(Mg1/3Nb2/3)O3-PbTiO3 (PMN-PT) is the prototypical Pb-based relaxor ferroelectric
sys-tem and exhibits state-of-the-art properties. For example, piezoelectric constants up to 4100 pC/N
have been achieved via Sm doping9. PMN-PT adopts the perovskite structure (formula ABO
3) with the A sub-lattice occupied by Pb and the B sub-lattice occupied by the either Mg, Nb, or Ti.
Fur-thermore, as PbTiO3 is added to PMN, the system reaches a morphotropic phase boundary (MPB)
near PMN-30PT where the electromechanical properties are maximized.10Deciphering the origins
of these enhanced properties is, however, complicated by nanoscale heterogenity of chemistry and structure. While X-ray and neutron scattering are the predominate characterization methods used to explain these details, making direct connections between composition, structure, and
polariza-tion have proven exceedingly difficult11–17. For example, while nanoscale chemical ordering of the
B sub-lattice cations was one of the first signatures revealed17,18and is found to varying degrees in
all Pb-based relaxor ferroelectrics19,20, its details are still being explored21–23.
polariza-tion in relaxor ferroelectrics requires characterizapolariza-tion techniques that are able to account for both cation and anion sub-lattices. While distortions of the oxygen sub-lattice have been previously
de-tected24, a combination of X-ray and neutron diffraction recently discovered that correlated oxygen
displacements are likely integral to bringing forth the outstanding electromechanical properties in
PMN-PT10. Diffraction characterization methods, however, lack the spatial resolution required to
directly determine the origin of nanoscale polar variation25,26. In contrast, annular dark-field
scan-ning transmission electron microscopy (ADF STEM), Figure 1a, can readily image the projected
crystal structure at the atomic length scale and is sensitive to chemical distribution21.
Unfortu-nately, ADF images are dominated by cation contrast that precludes detailed detection and
quan-tification of light elements such as oxygen. Recently, annular bright field (ABF)27,28and integrated
differential phase contrast (iDPC)29,30 STEM techniques have been developed to overcome these
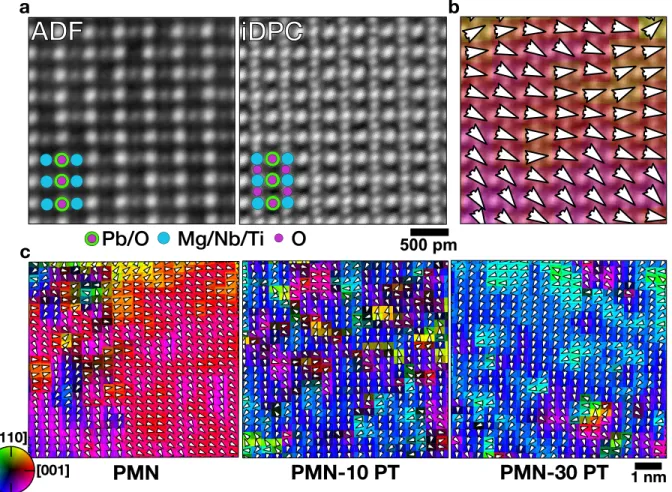
challenges. While iDPC can detect the cation and oxygen atom column positions, as shown in Figure 1a, it too has a major drawback: the image contrast lacks the atomic number interpretability of ADF STEM. On the other hand, both limitations can be overcome by simultaneously capturing ADF and iDPC images, with the resulting datasets akin to merging results from X-ray and neu-tron diffraction techniques, and enabling correlation between polarization, chemistry, and structure directly at the atomic scale.
Here, we investigate the structural and chemical origins of relaxor ferroelectric properties in PMN-xPT (x=0, 10, and 30). Through a combination of ADF and iDPC aberration corrected STEM, the projected positions of cation and anion sub-lattices are used to measure the subtle features of nanoscale polarization in these materials. The projected polarization reveals the
pres-ence of nanoscale domains that are consistent with the polar slush model.8 We further quantify
the distribution of chemical and structural heterogeneities as a function of Ti content, and a direct correlation is found between the spatial distribution of chemical/structural heterogeneities and po-larization domain walls. The heterogeneities are found to inhibit popo-larization rotation, leading to the formation of low angle domain walls. In combination, these results provide evidence for the
ADF
iDPC
Pb/O
Mg/Nb/Ti
O
500 pm a b cPMN
PMN-10 PT
PMN-30 PT
colorwheel5.pdf 1000x1000 [110] [001] 1 nmFigure 1: (a) Simultaneously acquired ADF and iDPC images of PMN along the h1¯10i projection
with the (b) projected displacement (polarization) map from iDPC. (c) Projected displacement (po-larization) for PMN-xPT (x=0, 10, and 30) unit cells in representative iDPC images. The projected displacement(polarization) magnitude ranges from 1 to 20 pm, and is indicated by luminosity. underlying mechanisms responsible for yielding relaxor behavior.
Mapping nanoscale polarization variation
Using iDPC STEM, the projected polarization is measured across ten different sample locations using the approach outlined in the Methods, and the influence of projection on these measure-ments is explored in Supplementary Information Section S1. These datasets yields approximately 5,000 analyzed unit cells at each of the three PMN-PT compositions. The high sampling of each composition provides a statistical representation of the underlying structure of the material,
aid-ing in connectaid-ing the results presented here to prior diffraction studies. Calculataid-ing the center of mass difference between the cations and anions using iDPC STEM, Figure 1c shows
representa-tive projected polarization maps for PMN, PMN-10PT, and PMN-30PT imaged along h1¯10i. The
projected polarization exhibits regions with similar magnitude and direction, i.e. polar domains, that vary smoothly across each image.
Notably for PMN, the observed polar domains do not decay to a non-polar background, which contrasts with the polar nanoregion model that assumes a non-polar matrix. These nanoscale do-mains vary in size from 2-12 nm and form low angle domain walls between them, which are located using the method described in Supplementary Information Section S2. This observation is
also remarkably similar to reverse Monte Carlo analysis of diffraction data.23 Moreover, a
signifi-cant majority (72%) of the domain wall angles are in the range of 10-35◦ , which is in agreement
with predictions from the polar slush model (see Supplementary Information Section S2).8,31 As
the fraction of PT increases, the average domain wall angle increases, reflecting the onset of fer-roelectric behavior. This behavior leads to the mixed relaxor and ferfer-roelectric properties found
in PMN-PT materials and expected from the polar slush model.8,31 This model does not,
how-ever, incorporate the specific structure and chemistry details that drive the formation of the polar domains.
Quantifying the types of local order
Chemical ordering is revealed in the ADF STEM data, as shown in Figure 2a,left. Clustered os-cillation of B sub-lattice atom column intensity on (111) planes indicates a doubled perovskite lattice where occupancy of Mg and Nb vary systematically. The weaker normalized intensity atom
columns (blue) contain more Mg or Ti (βI), while those stronger intensity atom columns (red)
contain more Nb (βII). Correlation analysis, shown in Figure 2a and detailed in Supplementary
Information Section S3, is used to quantify the relative fraction of these chemically ordered re-gions (CORs). At each composition, the CORs are found throughout and account for 39±1% of
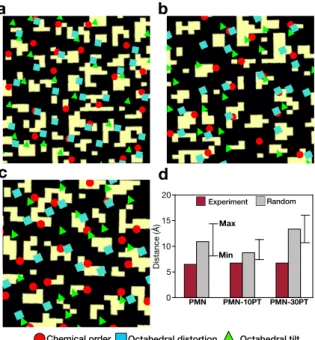
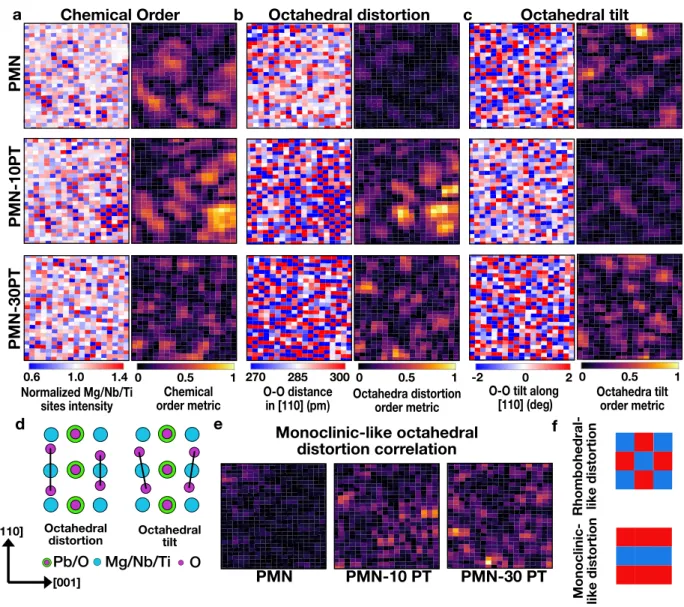
a b c d e f PMN PMN-10 PT PMN-30 PT Monoclinic-like octahedral distortion correlation 0.6 1.0 1.4 0 0.5 1 270 285 300 0 0.5 1 -2 0 2 0 0.5 1 Chemical Order P M N P M N -1 0P T P M N -3 0P T
Octahedral distortion Octahedral tilt
Normalized Mg/Nb/Ti
sites intensity order metricChemical O-O distancein [110] (pm) Octahedra distortionorder metric O-O tilt along[110] (deg) Octahedra tiltorder metric
[110] [001] R ho m b o he d ra l-lik e d is to rt io n M o no cl in ic -lik e d is to rt io n Octahedral
distortion Octahedraltilt
Pb/O Mg/Nb/Ti O
Figure 2: Spatial distribution of structural and chemical heterogeneities, (a) chemical order, (b) octahedral distortion, (c) octahedral tilt, (d) schematic of distortion types and their corresponding O-O patterns, (e) monoclinic-like distortion analysis, and (f) schematic patterns of rhombohedral-like and monoclinic-rhombohedral-like distortion.
the total projected area in the case of PMN, 37±2% for 10% of PT, and only 11±1% for 30% PT. The decreasing chemical order with increasing Ti is in agreement with previous X-ray and neutron scattering results where superlattice reflection intensity also decreases as the composition
approaches the MPB.10,32
Recently, Krogstad suggested the presence of anti-ferrodistortive displacements based on
dif-fuse scattering features, i.e. Pb displaces in the opposite direction of its B sub-lattice neighbors10.
The chemical and spatial origins of this behavior could not, however, be unambiguously deter-mined. From iDPC STEM data, the Pb atom columns are anti-ferrodistortive relative to the B-sites largely in the CORs, (Supplementary Information Section S4). These anti-ferrodistortive displace-ments decrease in accordance with the decreasing COR density as PT content increases, and in agreement with Krogstad.
As noted from recent X-ray and neutron scattering experiments, oxygen displacements may
hold the key to understanding structure-property relationships in Pb-based relaxors.10 To this end,
oxygen octahedral distortion (expansion/compression) and tilting (schematically shown in Figure 2d) are determined from iDPC images, as in Figures 2b-c. At each composition, distortion and tilting exhibit local ordering, reminiscent of the CORs.
Similar correlation analysis (see Supplementary Information Section S3) is used to determine the area fraction of octahedral distortion regions (ODRs), as shown in Figure 2b. In PMN, 21% of the projected area exhibits distortion ordering, with 63% overlapping the CORs and 27% at the COR boundaries.The overlap of the CORs and ODRs highlights the spatial correlation between octahedral distortion and chemical ordering. As PT content increases, the ODRs increase to 28% for PMN-10PT. Furthermore, a similar checkerboard octahedral distortion pattern is predicted for the chemically ordered PMN from density functional theory (DFT) (Supplementary Information Sections S5 and S6).
At PMN-30PT, however, the distortion order changes. Rather than exhibiting the rhombohedral-like, checkerboard distortion pattern (see Figure 2f), the distortion becomes predominately striped
0.4 0.8 1.2 1.6 350 375 400 425 450 0.4 0.8 1.2 1.6 350 375 400 425 450 0.4 0.8 1.2 1.6 350 375 400 425 450 P b /O -P b /O d is ta n c e a lo n g [0 0 1 ] (p m ) P b /O -P b /O d is ta n c e a lo n g [0 0 1 ] (p m ) P b /O -P b /O d is ta n c e a lo n g [0 0 1 ] (p m )
Normalized intensity of Mg/Nb sites
Normalized intensity of Mg/Nb/Ti sites
Normalized intensity of Mg/Nb/Ti sites
Slope: 6.6 pm/unit R : 0.13 Slope: -43.4 pm/unit R : -0.5 Slope: -15.6 pm/unit R : -0.12 PMN-10PT PMN-30PT PMN 0.4 0.8 1.2 1.6 200 240 280 320 360 0.4 0.8 1.2 1.6 200 240 280 320 360 0.4 0.8 1.2 1.6 200 240 280 320 360
Normalized intensity of Mg/Nb sites
O -O d is ta n c e a lo n g [1 1 0 ] (p m ) 200 0.8 1.2 1.6 0.4 240 280 320 360 200 0.8 1.2 1.6 0.4 240 280 320 360 200 0.8 1.2 1.6 0.4 240 280 320 360 350 0.8 1.2 1.6 0.4 375 400 425 450 350 0.8 1.2 1.6 0.4 375 400 425 450 350 0.8 1.2 1.6 0.4 375 400 425 450 O -O d is ta n c e a lo n g [1 1 0 ] (p m ) O -O d is ta n c e a lo n g [1 1 0 ] (p m )
Normalized intensity of Mg/Nb/Ti sites
Normalized intensity of Mg/Nb/Ti sites
Slope: -21.6 pm/unit R : -0.5 Slope: -73.2 pm/unit R : -0.56 Slope: -51.3 pm/unit R : -0.33 PMN PMN-10PT PMN-30PT 0.4
Figure 3: Correlation between the Mg/Nb/Ti normalized atom column intensity and the O-O dis-tance along [110] or Pb/O-Pb/O disdis-tance along [001] as indicated.
on (110) planes, which indicates the formation of monoclinic-like unit cells as verified with STEM image simulations (Supplementary Information Figure S11) and agrees with prior diffraction
stud-ies11. The area fractions of rhombohedral- and monoclinic-like distortions were determined by
use of the correlation analysis approach discussed in Supplementary Information Section S3. As Ti content increases so too does monoclinic-like distortion as shown in Figure 2e. Moreover, this
type of local planar distortion should give rise to asymmetric diffuse scattering33. Importantly,
Krogstad10 found that the oxygen-mediated asymmetric diffuse scattering in neutron scattering
was the only feature linked to the piezoelectric properties. The results presented here confirm that oxygen displacements are key and they originate in monoclinic-like regions. It is also important to note that due to presence of gradients in local chemistry and structure, pure phases (rhombohedral or monoclinic) are not observed. From this, one can argue that such strong local structural vari-ations and short correlation lengths give rise to local triclinic symmetry, which can facilitate the free rotation of polarization by small angles. This finding further supports the polar slush model’s description of relaxors.
Beyond expansion and contraction, the oxygen octahedra also tilt with respect to [110], as shown in Figure 2c. Applying correlation analysis (see Supplementary Information Section S3), 19% of the total projected area exhibits octahedral tilt ordering in PMN. Analysis of the B sub-lattice atom column intensities in and around these octahedral tilt regions (OTRs) shows that the atom column intensities are normally distributed (see Supplementary Information Section S7). Thus the OTRs do not occur at the interior of the CORs, but that they form in close proximity to the boundary between CORs. Furthermore, these regions are rich in magnesium, as exhibited by the shift in mean column intensities towards lower values (Supplementary Information Figure S13). Taken together with the DFT determined bond length distributions, these findings suggest a mechanism for the OTRs. Specifically, Mg-O bond lengths are much more strongly conserved than Nb-O bond lengths. As a result, Mg-O-Mg bonded octahedra would be more likely to tilt rather than stretch. Moreover, because Mg-O-Mg bonds can only exist in regions that are not chem-ically ordered (Supplementary Information Figure S7), such tilting is expected to be especially pronounced in transition regions due to the change in local chemistry.
The anti-phase tilt pattern suggest the presence of local rhombohedral, R3c local symmetry.34
With increasing PT, the OTR area decreases from 11% to 5% for 10PT and 30PT, respectively. As the fraction of these features decrease with composition, their disappearance also explains another distinct diffuse scattering contribution noted by Krogstad that had both temperature dependent and independent components. While the temperature independent contribution is thought to originate from the CORs, the temperature dependent part then arises from the octahedral tilt ordering that is disrupted by thermal fluctuations. The intensity of this type of diffuse scattering is found to decrease with PT content and follows the same trend as OTRs quantified from STEM.
Relating local chemistry and structure
Combining the ADF and iDPC STEM data, the change in B site chemistry measured with the Mg/Nb/Ti atom column intensity is also found to correlate to the O-O neighbor distance, as shown
in Figure 3. In each case, the B sub-lattice intensity is negatively correlated with the O-O atom
column distances35.This shows that Mg/Ti expands the local oxygen sub-lattice, while Nb leads
to contraction, which is consistent with the prior reports.23,36,37. In combination with the response
of oxygen at the MPB where the O-O spread increases, the observed correlation indicates the key role of Ti to disrupt the lattice to stabilize the monoclinic-like distortion and increase the piezoelectric coefficient. The Pb/O-Pb/O atom column distances, in comparison, show weak-to-no correlation with variation in B-site chemistry in PMN as shown in Figure 3, likely due to the dominant contribution of Pb on the observed atom column positions (Supplementary Information Section S1).
PMN-10PT, in contrast, exhibits moderate, negative correlation as shown in Figure 3. At the MPB, PMN-30PT, significantly larger distortions are observed that correspond to the increased polarization and piezoelectric coefficient. This correlated structural variation in Pb displacement also explains the diffuse scattering feature found by Krogstad that correlates to the cation size mismatch. Furthermore, the above mentioned correlation is significant as nearly ≈10,000 atom columns are used in the analysis.
Further analysis of the PMN-10PT βI and βII normalized intensities (Supplementary
Informa-tion Figure S12) also reveals that their intensity difference is enhanced with the introducInforma-tion of Ti.
This suggests that Ti initially replaces Nb in the mixed βI sites of the CORs leading to a
concomi-tant decrease in intensity for those atom columns and increased image contrast. Imporconcomi-tantly, the preferential incorporation of Ti to the CORs has not been previously shown and can be explained by analysis of the B sub-lattice bond lengths from DFT, albiet via an indirect argument. Any cova-lent bond has an ideal length or range of lengths it prefers to adopt for any particular coordination environment, and adopting bond lengths outside of this range is associated with severe energetic penalties and a commensurate decrease in the likelihood of incorporation. For example in oxide
perovskites, titanium tends to prefer bond lengths between 1.9 and 2.2 ˚A38–41. Supplementary
Chemical order Octahedral distortion Octahedral tilt 0 5 10 15 20 PMN PMN-10PT PMN-30PT Min Max Random Experiment D is ta nc e (Å ) a c d b 0 5 10 15 20
Figure 4: Positions of CORs, ODRs, OTRs, and domain walls for (a) PMN, (b) PMN-10PT, and (c) PMN-30PT. (d) Nearest distance between 95 % of heterogeneities maxima (random points) and domain wall for each PMN-xPT composition. Domain walls occur at the blocked, yellow regions. within a certain range. It is clear from this figure that, for a given bond length window, the COR structure has significantly more sites close to Ti’s ideal octahedral bonding environment than the disordered structure, especially when considering 5 and 6 B-O bonds. In fact, the COR structure has between 2 and 3 times more sites available than the disordered structure over most of the bond length range considered, and nearly 20 times more in the most extreme case. These high ratios result from the 2-4 pm differences in the onset of optimal coordination environments between the two systems, and indicate that Ti can form more strong bonds in the chemically ordered regions than in the disordered regions without changing any other bond lengths or otherwise altering the structures. All else being equal, this strongly suggests that Ti will preferentially incorporate into the CORs, at least on the PMN side of the composition space where CORs form.
Linking polarization and heterogeneity
The heterogeneity distribution is also found to link directly with the local variation in polarization and domain walls. First, the centers of the CORs, ODRs, and OTRs are identified as maxima in the results from correlation analysis as detailed in Supplementary Information Section S8. Qual-itatively, Figure 4a-c, the heterogeneity maxima occur at, or very near, the locations of greatest polarization variation, i.e. low angle domain walls.
The observed relationship between ordered heterogeneities and domains walls is validated by quantifying the nearest neighbor distance. As shown in Figure 4d, 95% of the heterogeneities are within a distance of 1.5-2 unit cells of the nearest domain wall regardless of PT content. Across the composition range investigated, 1/3 of CORs, 1/3 ODRs, and 1/3 OTRs are within this distance of the domain walls. In addition, 1/3 of the domain walls have at least two nearby types of structural or chemical ordering. This indicates that the polar domain walls cannot be explained by a single type of heterogeneity, but requires the consideration of all features identified.
To determine the significance of this observation, consider the null-hypothesis that hetero-geneities are randomly distributed with respect to polarization. Taking 10,000 random sets of data equivalent to experiment, but with random heterogeneity locations, the 95% threshold is not reached until a distance two times larger than experiment, see Figure 4d. Further highlighting the difference, the error bars indicate the maximum and minimum 95% distances for the 10,000 datasets at each composition. A result similar to experiment is not found in any of the random data, indicating that p is significantly less than 0.05, safely discounting the null-hypothesis. Taken together, the results presented here unambiguously reveal that chemical and structural hetero-geneities are not randomly distributed with respect to polarization, but instead act as the mech-anism to disrupt the formation of long-range polarization. Although this role of heterogeneity has
been postulated17,42, its connection to generating low angle domain walls has not been directly
Outlook
The combination of nanoscale features explains the origin for relaxor ferroelectric behavior in PMN-PT that lead to the dramatically improved piezoelectric performance. Thus, to design ma-terials with higher piezoelectric coefficients, balancing order (chemical and/or octahedral distor-tion/tilt) with disorder is key. In other words, to support relaxor behavior, barriers to polarization rotation need to be distributed throughout the material at a concentration that disrupts long-range (ferroelectric) polarization. For example, this tuning might be achieved by changing the alloy com-position, adding dopants, or modifying synthesis conditions. Broadly, engineering a combination of short-range structural and chemical order will be essential for advancing the next generation of Pb-free relaxor-ferroelectric materials.
References
1. Cohen, R. E. Relaxors go critical. Nature 441, 941–942 (2006).
2. Park, S.-E. & Shrout, T. R. Ultrahigh strain and piezoelectric behavior in relaxor based
fer-roelectric single crystals. Journal of Applied Physics 82, 1804 (1997).
3. Zhang, S. & Li, F. High performance ferroelectric relaxor-PbTiO3single crystals: Status and
perspective. Journal of Applied Physics 111, 031301 (2012).
4. Zhang, S. et al. Advantages and challenges of relaxor-PbTiO3 ferroelectric crystals for
elec-troacoustic transducers - A review. Prog Mater Sci. 68, 1–66 (2015).
5. Burns, G. & Dacol, F. H. Glassy polarization behavior in ferroelectric compounds Pb(Mg1/3Nb2/3)O3
and Pb(Zn1/3Nb2/3)O3. Solid State Communications 48, 853–856 (1983).
6. Burns, G. & Dacol, F. H. Crystalline ferroelectrics with glassy polarization behavior. Phys.
7. Yang, L. et al. Relaxor ferroelectric behavior from strong physical pinning in a Poly(vinylidene fluoride-co-trifluoroethylene-co-chlorotrifluoroethylene) random terpolymer. Macromolecules 47, 8119–8125 (2014).
8. Takenaka, H., Grinberg, I., Liu, S. & Rappe, A. M. Slush-like polar structures in single-crystal
relaxors. Nature 546, 391–395 (2017).
9. Li, F. et al. Giant piezoelectricity of Sm-doped Pb(Mg1/3Nb2/3)O3-PbTiO3 single crystals.
Science364, 264–268 (2019).
10. Krogstad, M. J. et al. The relation of local order to material properties in relaxor
ferro-electrics. Nature Materials 17, 718–724 (2018).
11. Singh, A. K., Pandey, D. & Zaharko, O. Powder neutron diffraction study of phase transitions
in and a phase diagram of (1-x) [Pb(Mg1/3Nb2/3)O3]-xPbTiO3. Phys. Rev. B 74, 024101
(2006).
12. Singh, A. K. & Pandey, D. Evidence for MB and MC phases in the morphotropic phase
boundary region of (1-x) [Pb(Mg1/3Nb2/3)O3]-xPbTiO3: A Rietveld study. Phys. Rev. B 67,
064102 (2003).
13. Thomas, N. W., Ivanov, S. A., Ananta, S., Tellgren, R. & Rundlof, H. New evidence for
rhom-bohedral symmetry in the relaxor ferroelectric Pb(Mg1/3Nb2/3)O3. Journal of the European
Ceramic Society19, 2667–2675 (1999).
14. Kim, K. H., Payne, D. A. & Zuo, J. M. Symmetry of piezoelectric (1-x) Pb(Mg1/3Nb2/3)O3
-xPbTiO3(x=0.31) single crystal at different length scales in the morphotropic phase boundary
region. Phys. Rev. B 86, 184113 (2012).
15. Cowley, R. A., Gvasaliya, S. N., Lushnikov, S. G., Roessli, B. & Rotaru, G. M. Relaxing with
16. Davis, M. Picturing the elephant: Giant piezoelectric activity and the monoclinic phases of relaxor-ferroelectric single crystals. Journal of Electroceramics 19, 25–47 (2007).
17. Randall, C. A. & Bhalla, A. S. Nanostructural-Property Relations in Complex Lead
Per-ovskites. Japanese Journal of Applied Physics 29, 327–333 (1990).
18. Randall, C. A., Bhalla, A. S., Shrout, T. R. & Cross, L. E. Classification and consequences of
complex lead perovskite ferroelectrics with regard to B-site cation order. Journal of Materials
Research5, 829–834 (1990).
19. Takesue, N. et al. Effects of B-site ordering/disordering in lead scandium niobate. Journal of
Physics: Condensed Matter11, 8301–8312 (1999).
20. Goossens, D. J. Local ordering in lead-based relaxor ferroelectrics. Acc. Chem. Res. 46,
2597–2606 (2013).
21. Cabral, M. J., Zhang, S., Dickey, E. C. & LeBeau, J. M. Gradient chemical order in the
relaxor Pb(Mg1/3Nb2/3)O3. Appl. Phys. Lett. 112, 082901 (2018).
22. Kopeck´y, M., Kub, J., F´abry, J. & Hlinka, J. Nanometer-range atomic order directly recovered
from resonant diffuse scattering. Phys. Rev. B 93, 054202 (2016).
23. Eremenko, M. et al. Local atomic order and hierarchical polar nanoregions in a classical
relaxor ferroelectric. Nat Commun 10, 2728 (2019).
24. Rosenfeld, H. D. & Egami, T. Short and intermediate range structural and chemical order in
the relaxor ferroelectric lead magnesium niobate. Ferroelectrics 164, 133–141 (1995).
25. Keen, D. A. & Goodwin, A. L. The crystallography of correlated disorder. Nature 521, 303–
309 (2015).
26. Xu, G., Wen, J., Stock, C. & Gehring, P. M. Phase instability induced by polar nanoregions
27. Findlay, S. D. et al. Robust atomic resolution imaging of light elements using scanning trans-mission electron microscopy. Appl. Phys. Lett. 95, 191913 (2009).
28. Kim, Y. M., Pennycook, S. J. & Borisevich, A. Y. Quantitative comparison of bright field and
annular bright field imaging modes for characterization of oxygen octahedral tilts.
Ultrami-croscopy181, 1–7 (2017).
29. Lazi´c, I., Bosch, E. G. & Lazar, S. Phase contrast STEM for thin samples: Integrated
differ-ential phase contrast. Ultramicroscopy 160, 265–280 (2016).
30. De Graaf, S., Momand, J., Mitterbauer, C., Lazar, S. & Kooi, B. J. Resolving hydrogen atoms
at metal-metal hydride interfaces. Science Advances 6, eaay4312 (2020).
31. Kim, J. et al. Epitaxial Strain Control of Relaxor Ferroelectric Phase Evolution. Adv. Mater.
31, 1901060 (2019).
32. Hilton, A. D., Barber, D. J., Randall, C. A. & Shrout, T. R. On short range ordering in the
perovskite lead magnesium niobate. Journal of Materials Science 25, 3461–3466 (1990).
33. Kreisel, J. et al. High-pressure x-ray scattering of oxides with a nanoscale local structure:
Application to Na1/2Bi1/2TiO3. Phys. Rev. B 68, 014113 (2003).
34. Glazer, A. M. The classification of tilted octahedra in perovskites. Acta Cryst. B28, 3384–
3392 (1972).
35. Sang, X., Grimley, E. D., Niu, C., Irving, D. L. & Lebeau, J. M. Direct observation of charge
mediated lattice distortions in complex oxide solid solutions. Appl. Phys. Lett. 106, 061913 (2015).
36. Kvyatkovskii, O. E. Oxygen Position in Pb(Mg 1/3 Nb 2/3 )O 3 from ab initio Cluster
Calculations. Ferroelectrics 299, 55–57 (2004).
37. Sepliarsky, M. & Cohen, R. E. First-principles based atomistic modeling of phase stability in
38. Abramov, Y. A., Tsirelson, V., Zavodnik, V., Ivanov, S. & Brown, I. The chemical bond and
atomic displacements in SrTiO3 from X-ray diffraction analysis. Acta Cryst. B51, 942–951
(1995).
39. Cole, S. S. & Espenschied, H. Lead Titanate: Crystal Structure, Temperature of Formation,
and Specific Gravity Data. J. Phys. Chem 41, 445–451 (1937).
40. Shin, Y.-H., Son, J.-Y., Lee, B.-J., Grinberg, I. & Rappe, A. M. Order-disorder character of
PbTiO3. J. Phys.: Condens. Matter 20, 015224 (2008).
41. Yoshiasa, A. et al. High-temperature single-crystal X-ray diffraction study of tetragonal and
cubic perovskite-type PbTiO3 phases. Acta Cryst. Section B 72, 381–388 (2016).
42. Fu, D. et al. Relaxor Pb(Mg1/3Nb2/3)O3: A Ferroelectric with Multiple Inhomogeneities.
Phys. Rev. Lett.103, 207601 (2009).
Correspondence and requests for materials should be addressed to J.M.L.
Acknowledgements
We gratefully acknowledge support for this work from the National Science Foundation, as part of the Center for Dielectrics and Piezoelectrics under Grant Nos. IIP-1841453 and IIP-1841466. SZ acknowledges support from the Australian Research Council (FT140100698) and the Office of Naval Research Global (N62909-18-12168). PCB was supported by the Department of Defense through the National Defense Science & Engineering Graduate (NDSEG) fellowship program. Computational time and financial support for JNB was provided by AFOSR grant FA9550-17-1-0318. MJC acknowledges support from National Science Foundation as part of the NRT-SEAS under Grant No. DGE-1633587. This work was performed in part at the Analytical Instrumenta-tion Facility (AIF) at North Carolina State University, which is supported by the State of North Carolina and the National Science Foundation (ECCS-1542015). AIF is a member of the North
Carolina Research Triangle Nanotechnology Network (RTNN), a site in the National Nanotech-nology Coordinated Infrastructure (NNCI). The NVIDIA Titan Xp GPU used for this research was donated by the NVIDIA Corporation. We acknowledge Matthew Hauwiller for useful suggestions while preparing the manuscript.
Author Contributions
AK conducted the electron microscopy experiments, data analysis, and image simulations. MJC prepared the PMN samples for electron microscopy and collected STEM data. SZ grew the PMN-xPT single crystals. JNB, PCB, and DLI performed the DFT calculations and the corresponding analysis. JML and ECD designed the electron microscopy experiments and guided the research. All authors co-wrote and edited the manuscript.
Methods
Sample Information
Pb(Mg1/3Nb2/3)O3-xPbTiO3 (PMN-xPT) single crystals were grown via the high temperature flux
method. Samples for electron microscopy were cut from these larger single crystals and oriented
along h1¯10i and then thinned to electron transparency using mechanical wedge polishing43
fol-lowed by low temperature, low energy Ar ion milling.
Scanning Transmission Electron Microscopy
STEM imaging was performed with a probe-corrected FEI Titan G2 60-300 kV S/TEM equipped with an X-FEG source at a beam current of 30 pA and probe semi-convergence angle of 19.6 mrad. We used a custom scripting interface to automate the Thermo Fisher Scientific Velox software for simultaneous ADF and iDPC acquisition. ADF images were collected with a semi-collection angle range of 34-205 mrad and iDPC with a collection semi-angle range of 7-28 mrad. For high image
accuracy and precision, the revolving STEM (RevSTEM) method was used.44,45 Each RevSTEM
data set consisted of 20 1024×1024 pixel frames with a 90◦ rotation between each successive
frame. Sample thickness ranged from 6 to 10 nm as determined using position averaged convergent
beam electron diffraction46. Because, polarization is linearly proportional to the net displacement
of cations from anions in an unit cell47, the projected polarization is calculated from iDPC images
as the difference between the cation and anion center of masses. Atom column centers are extracted from drift and scan distortion corrected iDPC images using a custom python based atom column
Density Functional Theory and Image Simulations
Density functional theory (DFT) calculations of PMN were performed to investigate the atomic structures in three dimensions, and to examine charge localization and bond length distributions. These calculations were performed with the PBE exchange correlation functional in VASP 5.3.3,
collinear spin polarization, and a plane wave kinetic energy cutoff of 520 eV.49–52 A single
recip-rocal space point at Γ was used. Projector Augmented Wave pseudopotentials were used with 2, 11, 4, and 6 valence electrons explicitly treated for Mg, Nb, Pb, and O, respectively. Additional details of the calculation are provided in Supplementary Information Section S5.
For STEM image simulations, supercells were constructed using relaxed structures from DFT. A repeating unit was cropped and simulated using a custom python based STEM image simulation software. Simulated ADF and iDPC images were convolved with a Gaussian with full-width at
half-maximum of 80 pm to approximately account for the finite effective source size53.
Data availability
The image datasets analysed during the current study are available from https://doi.org/10.7910/DVN/F0FHTG. Other data is available from the corresponding author by reasonable request.
Code availability
Custom Python scripts used to analyse STEM images are available from the corresponding author upon request.
References
43. Voyles, P. M., Muller, D. A., Grazul, J. L., Citrin, P. H. & Gossmann, H.-J. L. Atomic-scale
imaging of individual dopant atoms and clusters in highly n-type bulk Si. Nature 416, 826– 829 (2002).
44. Sang, X. & LeBeau, J. M. Revolving scanning transmission electron microscopy: Correcting
sample drift distortion without prior knowledge. Ultramicroscopy 138, 28–35 (2014).
45. Dycus, J. H. et al. Accurate Nanoscale Crystallography in Real-Space Using Scanning
Trans-mission Electron Microscopy. Microsc. Microanal. 21, 946–952 (2015).
46. LeBeau, J. M., Findlay, S. D., Allen, L. J. & Stemmer, S. Position averaged convergent
beam electron diffraction: Theory and applications. English. Ultramicroscopy 110, 118–125 (2010).
47. Tao, H. et al. Ultrahigh Performance in Lead-Free Piezoceramics Utilizing a Relaxor Slush
Polar State with Multiphase Coexistence. J. Am. Chem. Soc. 141, 13987–13994 (2019).
48. Sang, X., Oni, A. A. & Le Beau, J. M. Atom column indexing: Atomic resolution image
analysis through a matrix representation. Microsc. Microanal. 20, 1764–1771 (2014).
49. Kresse, G. & Hafner, J. Ab Initio Molecular Dynamics of Liquid Metals. Phys. Rev. B 47,
558–561 (1993).
50. Kresse, G. & Hafner, J. Ab Initio Molecular-Dynamics Simulation of the
Liquid-Metal-Amorphous-Semiconductor Transition in Germanium. Phys. Rev. B 49, 14251–14269 (1994).
51. Kresse, G. & Furthm¨uller, J. Efficiency of ab-initio total energy calculations for metals and
semiconductors using a plane-wave basis set. Computational Materials Science 6, 15–50 (1996).
52. Kresse, G. & Furthm¨uller, J. Efficient iterative schemes for ab initio total-energy calculations
53. LeBeau, J. M., Findlay, S. D., Allen, L. J. & Stemmer, S. Quantitative atomic resolution scanning transmission electron microscopy. Phys. Rev. Lett. 100, 206101 (2008).
![Figure 3: Correlation between the Mg/Nb/Ti normalized atom column intensity and the O-O dis- dis-tance along [110] or Pb/O-Pb/O distance along [001] as indicated.](https://thumb-eu.123doks.com/thumbv2/123doknet/14121024.467656/9.918.301.612.112.447/figure-correlation-normalized-column-intensity-tance-distance-indicated.webp)