Publisher’s version / Version de l'éditeur:
NAACL 2012 Workshop on Statistical Machine Translation: (WMT-2012), pp. 59-63, 2012-06-08
READ THESE TERMS AND CONDITIONS CAREFULLY BEFORE USING THIS WEBSITE.
https://nrc-publications.canada.ca/eng/copyright
Vous avez des questions? Nous pouvons vous aider. Pour communiquer directement avec un auteur, consultez la
première page de la revue dans laquelle son article a été publié afin de trouver ses coordonnées. Si vous n’arrivez pas à les repérer, communiquez avec nous à [email protected].
Questions? Contact the NRC Publications Archive team at
[email protected]. If you wish to email the authors directly, please see the first page of the publication for their contact information.
NRC Publications Archive
Archives des publications du CNRC
This publication could be one of several versions: author’s original, accepted manuscript or the publisher’s version. / La version de cette publication peut être l’une des suivantes : la version prépublication de l’auteur, la version acceptée du manuscrit ou la version de l’éditeur.
Access and use of this website and the material on it are subject to the Terms and Conditions set forth at
Improving AMBER, an MT Evaluation Metric
Chen, Boxing; Kuhn, Roland; Foster, George
https://publications-cnrc.canada.ca/fra/droits
L’accès à ce site Web et l’utilisation de son contenu sont assujettis aux conditions présentées dans le site LISEZ CES CONDITIONS ATTENTIVEMENT AVANT D’UTILISER CE SITE WEB.
NRC Publications Record / Notice d'Archives des publications de CNRC:
https://nrc-publications.canada.ca/eng/view/object/?id=a0fb52ca-4e0d-49b5-9ba8-e34401cc787d https://publications-cnrc.canada.ca/fra/voir/objet/?id=a0fb52ca-4e0d-49b5-9ba8-e34401cc787d
Improving AMBER, an MT Evaluation Metric
Boxing Chen, Roland Kuhn and George Foster
National Research Council Canada
283 Alexandre-Taché Boulevard, Gatineau (Québec), Canada J8X 3X7
{Boxing.Chen, Roland.Kuhn, George.Foster}@nrc.ca
Abstract
A recent paper described a new machine translation evaluation metric, AMBER. This paper describes two changes to AMBER. The first one is incorporation of a new ordering penalty; the second one is the use of the downhill simplex algorithm to tune the weights for the components of AMBER. We tested the impact of the two changes, using data from the WMT metrics task. Each of the changes by itself improved the performance of AMBER, and the two together yielded even greater improvement, which in some cases was more than additive. The new version of AMBER clearly outperforms BLEU in terms of correlation with human judgment.
1 Introduction
AMBER is a machine translation evaluation metric first described in (Chen and Kuhn, 2011). It is de-signed to have the advantages of BLEU (Papineni
et al., 2002), such as nearly complete language independence and rapid computability, while at-taining even higher correlation with human judg-ment. According to the paper just cited: “It can be thought of as a weighted combination of dozens of computationally cheap features based on word sur-face forms for evaluating MT quality”. Many re-cently defined machine translation metrics seek to exploit deeper sources of knowledge than are available to BLEU, such as external lexical and syntactic resources. Unlike these and like BLEU, AMBER relies entirely on matching surface forms in tokens in the hypothesis and reference, thus sac-rificing depth of knowledge for simplicity and speed.
In this paper, we describe two improvements to AMBER. The first is a new ordering penalty called “v” developed in (Chen et al., 2012). The second remedies a weakness in the 2011 version of AMBER by carrying out automatic, rather than manual, tuning of this metric’s free parameters; we now use the simplex algorithm to do the tuning.
2 AMBER
AMBER is the product of a score and a penalty, as in Equation (1); in this, it resembles BLEU. How-ever, both the score part and the penalty part are more sophisticated than in BLEU. The score part (Equation 2) is enriched by incorporating the weighted average of n-gram precisions (AvgP), the F-measure derived from the arithmetic averages of precision and recall (Fmean), and the arithmetic average of F-measure of precision and recall for each n-gram (AvgF). The penalty part is a weighted product of several different penalties (Equation 3). Our original AMBER paper (Chen and Kuhn, 2011) describes the ten penalties used at that time; two of these penalties, the normalized Spearman’s correlation penalty and the normalized Kendall’s correlation penalty, model word reorder-ing. penalty score AMBER= × (1) AvgF Fmean AvgP score × − − + × + × = ) 1 ( 1 2 2 1
θ
θ
θ
θ
(2)∏
= = P i w i i pen penalty 1 (3) whereθ
1 andθ
2 are weights of each score com-ponent; wi is the weight of each penalty peni.In addition to the more complex score and pen-alty factors, AMBER differs from BLEU in two other ways:
• Not only fixed n-grams, but three different kinds of flexible n-grams, are used in com-puting scores and penalties.
• The AMBER score can be computed with different types of text preprocessing, i.e. different combinations of several text pre-processing techniques: lowercasing, to-kenization, stemming, word splitting, etc. 8 types were tried in (Chen and Kuhn, 2011). When using more than one type, the final score is computed as an average over runs, one run per type. In the experiments re-ported below, we averaged over two types of preprocessing.
3 Improvements to AMBER
3.1 Ordering penalty v
We use a simple matching algorithm (Isozaki et
al., 2010) to do 1-1 word alignment between the hypothesis and the reference.
After word alignment, represent the reference by a list of normalized positions of those of its words that were aligned with words in the hypothesis, and represent the hypothesis by a list of positions for the corresponding words in the reference. For both lists, unaligned words are ignored. E.g., let P1 =
reference, P2 = hypothesis: P1: 1 1 p p12 p13 p14 … p1i … p1n P2: 1 2 p 2 2 p 3 2 p 4 2 p … pi2 … p2n Suppose we have
Ref: in the winter of 2010 , I visited Paris Hyp: I visited Paris in 2010 ’s winter Then we obtain
P1: 1 2 3 4 5 6 (the 2 nd
word “the”, 4th word “of” and 6th word “,” in the reference are not aligned to any word in the hypothesis. Thus, their positions are not in P1, so the positions of the matching words
“in winter 2010 I visited Paris” are nor-malized to 1 2 3 4 5 6)
P2: 4 5 6 1 3 2 (the word “’s” was
unaligned).
The ordering metric v is computed from two distance measures. The first is absolute permutation distance: = − = n i i i p p P P DIST 1 2 1 2 1 1( , ) | | (4) Let 2 / ) 1 ( ) , ( 1 1 1 2 1 + − = n n P P DIST
ν
(5)v1 ranges from 0 to 1; a larger value means more
similarity between the two permutations. This metric is similar to Spearman’s (Spearman, 1904). However, we have found that punishes long-distance reordering too heavily. For instance,
1
ν
is more tolerant than of the movement of “recently” in this example:Ref: Recently , I visited Paris Hyp: I visited Paris recently P1: 1 2 3 4
P2: 2 3 4 1
Its =1-6(14(16+1+−11)+9) =−0.2; however, its 4 . 0 -1 4(41)/2 3 1 1 1 = = ++++ 1 v .
Inspired by HMM word alignment (Vogel et al., 1996), our second distance measure is based on jump width. This punishes only once a sequence of words that moves a long distance with the internal word order conserved, rather than on every word. In the following, only two groups of words have moved, so the jump width punishment is light:
Ref: In the winter of 2010, I visited Paris Hyp: I visited Paris in the winter of 2010 The second distance measure is
= − − − − − = n i i i i i p p p p P P DIST 1 1 2 2 1 1 1 2 1 2( , ) |( ) ( )| (6)
where we setp10 =0 and 0
0 2 = p . Let 1 ) , ( 1 22 1 2 2 − − = n P P DIST v (7)
As with v1, v2 is also from 0 to 1, and larger values
indicate more similar permutations. The ordering measure vsis the harmonic mean of v1 and v2 (Chen et al., 2012): ) 1 1 ( 2/ /v1 /v2 vs = + . (8) In (Chen et al., 2012) we found this to be slightly more effective than the geometric mean. vsin (8) is
computed at segment level. We compute document level ordering vD with a weighted arithmetic mean:
= = × = l s s l s s s D R len R len v v 1 1 ) ( ) ( (9) where l is the number of segments of the document, and len(R) is the length of the reference after text preprocessing. vs is the segment-level
ordering penalty.
Recall that the penalty part of AMBER is the weighted product of several component penalties. In the original version of AMBER, there were 10 component penalties. In the new version, v is in-corporated as an additional, 11th weighted penalty in (3). Thus, the new version of AMBER incorpo-rates three reordering penalties: Spearman’s correlation, Kendall’s correlation, and v. Note that
v is also incorporated in a tuning metric we recent-ly devised (Chen et al., 2012).
3.2 Automatic tuning
In (Chen and Kuhn, 2011), we manually set the 17 free parameters of AMBER (see section 3.2 of that paper). In the experiments reported below, we tuned the 18 free parameters – the original 17 plus the ordering metric v described in the previous sec-tion - automatically, using the downhill simplex method of (Nelder and Mead, 1965) as described in (Press et al., 2002). This is a multidimensional optimization technique inspired by geometrical considerations that has shown good performance in a variety of applications.
4 Experiments
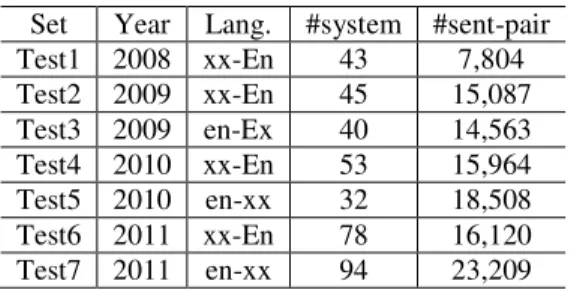
The experiments are carried out on WMT metric task data: specifically, the WMT 2008, WMT 2009, WMT 2010, WMT 2011 all-to-English, and English-to-all submissions. The languages “all” (“xx” in Table 1) include French, Spanish, German and Czech. Table 1 summarizes the statistics for these data sets.
Set Year Lang. #system #sent-pair Test1 2008 xx-En 43 7,804 Test2 2009 xx-En 45 15,087 Test3 2009 en-Ex 40 14,563 Test4 2010 xx-En 53 15,964 Test5 2010 en-xx 32 18,508 Test6 2011 xx-En 78 16,120 Test7 2011 en-xx 94 23,209 Table 1: Statistics of the WMT dev and test sets.
We used 2008 and 2011 data as dev sets, 2009 and 2010 data as test sets. Spearman’s rank correlation coefficient was employed to measure correlation of the metric with system-level human judgments of translation. The human judgment score was based on the “Rank” only, i.e., how often the translations of the system were rated as better than those from other systems (Callison-Burch et al., 2008). Thus, BLEU and the new ver-sion of AMBER were evaluated on how well their rankings correlated with the human ones. For the segment level, we followed (Callison-Burch et al., 2010) in using Kendall’s rank correlation coefficient .
In what follows, “AMBER1” will denote a vari-ant of AMBER as described in (Chen and Kuhn, 2011). Specifically, it is the variant AMBER(1,4) – that is, the variant in which results are averaged over two runs with the following preprocessing:
1. A run with tokenization and lower-casing 2. A run in which tokenization and
lower-casing are followed by the word splitting. Each word with more than 4 letters is seg-mented into two sub-words, with one being the first 4 letters and the other the last 2 let-ters. If the word has 5 letters, the 4th letter appears twice: e.g., “gangs” becomes “gang” + “gs”. If the word has more than 6 letters, the middle part is thrown away. The second run above requires some explana-tion. Recall that in AMBER, we wish to avoid use of external resources such as stemmers and mor-phological analyzers, and we aim at maximal lan-guage independence. Here, we are doing a kind of “poor man’s morphological analysis”. The first four letters of a word are an approximation of its stem, and the last two letters typically carry at least some information about number, gender, case, etc. Some information is lost, but on the other hand, when we use the metric for a new language (or at least, a new Indo-European language) we know that it will extract at least some of the information hidden inside morphologically complex words.
The results shown in Tables 2-4 compare the correlation of variants of AMBER with human judgment; Table 5 compares the best version of AMBER (AMBER2) with BLEU. For instance, to calculate segment-level correlations using
Kendall’s , we carried out 33,071 paired compari-sons for out-of-English and 31,051 paired compar-isons for into-English. The resulting was calculated per system, then averaged for each con-dition (out-of-English and into-English) to obtain one out-of-English value and one into-English val-ue.
First, we compared the performance of AMBER1 with a version of AMBER1 that in-cludes the new reordering penalty v, at the system and segment levels. The results are shown in Table 2. The greatest impact of v is on “out of English” at the segment level, but none of the results are par-ticularly impressive. AMBER1 +v Change Into-En System 0.860 0.862 0.002 (+0.2%) Into-En Segment 0.178 0.180 0.002 (+1.1%) Out-of-En System 0.637 0.637 0 (0%) Out-of-En Segment 0.167 0.170 0.003 (+1.8%) Table 2: Correlation with human judgment for
AMBER1 vs. (AMBER1 including v). Second, we compared the performance of manu-ally tuned AMBER1 with AMBER1 whose param-eters were tuned by the simplex method. The tuning was run four times on the dev set, once for each possible combination of into/out-of English and system/segment level. Table 3 shows the re-sults on the test set. This change had a greater im-pact, especially on the segment level.
AMBER1 +Simplex Change Into-En System 0.860 0.862 0.002 (+0.2%) Into-En Segment 0.178 0.184 0.006 (+3.4%) Out-of-En System 0.637 0.637 0 (0%) Out-of-En Segment 0.167 0.182 0.015 (+9.0%) Table 3: Correlation with human judgment for
AMBER1 vs. simplex-tuned AMBER1.
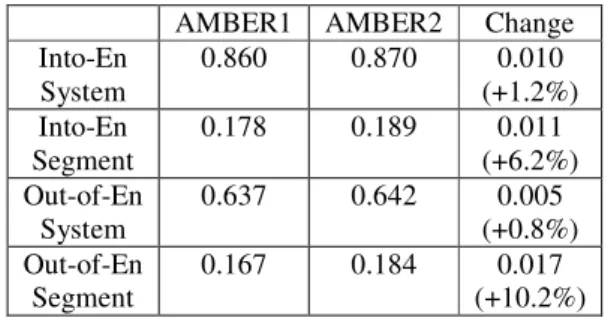
Then, we compared the performance of AMBER1 with AMBER1 that contains v and that
has been tuned by the simplex method. We will denote the new version of AMBER containing both changes “AMBER2”. It will be seen from Table 4 that AMBER2 is a major improvement over AMBER1 at the segment level. In the case of “into English” at the segment level, the impact of the two changes seems to have been synergistic: adding together the percentage improvements due to v and simplex from Tables 2 and 3, one would have expected an improvement of 4.5% for both changes together, but the actual improvement was 6.2%. Furthermore, there was no improvement at the system level for “out of English” when either change was tried separately, but there was a small improvement when the two changes were com-bined.
AMBER1 AMBER2 Change Into-En System 0.860 0.870 0.010 (+1.2%) Into-En Segment 0.178 0.189 0.011 (+6.2%) Out-of-En System 0.637 0.642 0.005 (+0.8%) Out-of-En Segment 0.167 0.184 0.017 (+10.2%) Table 4: Correlation with human judgment for
AMBER1 vs. AMBER2.
Of course, the most important question is: does the new version of AMBER (AMBER2) perform better than BLEU? Table 5 answers this question (the version of BLEU used here was smoothed BLEU (mteval-v13a)). There is a clear advantage for AMBER2 over BLEU at both the system and segment levels, for both “into English” and “out of English”.
BLEU AMBER2 Change Into-En System 0.773 0.870 0.097 (+12.5%) Into-En Segment 0.154 0.189 0.035 (+22.7%) Out-of-En System 0.574 0.642 0.068 (+11.8%) Out-of-En Segment 0.149 0.184 0.035 (+23.5%) Table 5: Correlation with human judgment for
5 Conclusion
We have made two changes to AMBER, a metric described in (Chen and Kuhn, 2011). In our exper-iments, the new version of AMBER was shown to be an improvement on the original version in terms of correlation with human judgment. Furthermore, it outperformed BLEU by about 12% at the system level and about 23% at the segment level.
A good evaluation metric is not necessarily a good tuning metric, and vice versa. In parallel with our work on AMBER for evaluation, we have also been exploring a machine translation tuning metric called PORT (Chen et al., 2012). AMBER and PORT differ in many details, but they share the same underlying philosophy: to exploit surface similarities between hypothesis and references even more thoroughly than BLEU does, rather than to invoke external resources with richer linguistic knowledge. So far, the results for PORT have been just as encouraging as the ones for AMBER re-ported here.
Reference
C. Callison-Burch, P. Koehn, C. Monz, K. Peterson, M. Przybocki and O. Zaidan. 2010. Findings of the 2010 Joint Workshop on Statistical Machine Translation and Metrics for Machine Translation. In Proceedings
of WMT.
C. Callison-Burch, C. Fordyce, P. Koehn, C. Monz and J. Schroeder. 2008. Further Meta-Evaluation of Ma-chine Translation. In Proceedings of WMT.
B. Chen, R. Kuhn, and S. Larkin. 2012. PORT: a Preci-sion-Order-Recall MT Evaluation Metric for Tuning. Accepted for publication in Proceedings of ACL. B. Chen and R. Kuhn. 2011. AMBER: a Modified
BLEU, Enhanced Ranking Metric. In Proceedings of
the Sixth Workshop on Statistical Machine Transla-tion, Edinburgh, Scotland.
H. Isozaki, T. Hirao, K. Duh, K. Sudoh, H. Tsukada. 2010. Automatic Evaluation of Translation Quality for Distant Language Pairs. In Proceedings of
EMNLP.
J. Nelder and R. Mead. 1965. A simplex method for function minimization. Computer Journal V. 7, pages 308–313.
K. Papineni, S. Roukos, T. Ward, and W.-J. Zhu. 2002. BLEU: a method for automatic evaluation of ma-chine translation. In Proceedings of ACL.
W. Press, S. Teukolsky, W. Vetterling and B. Flannery. 2002. Numerical Recipes in C++. Cambridge Uni-versity Press, Cambridge, UK.
C. Spearman. 1904. The proof and measurement of as-sociation between two things. In American Journal of
Psychology, V. 15, pages 72–101.
S. Vogel, H. Ney, and C. Tillmann. 1996. HMM based word alignment in statistical translation. In