Publisher’s version / Version de l'éditeur:
Handbook of Research on Culturally-Aware Information Technology: Perspectives
and Models, 14, pp. 1-21, 2010
READ THESE TERMS AND CONDITIONS CAREFULLY BEFORE USING THIS WEBSITE.
https://nrc-publications.canada.ca/eng/copyright
Vous avez des questions? Nous pouvons vous aider. Pour communiquer directement avec un auteur, consultez la première page de la revue dans laquelle son article a été publié afin de trouver ses coordonnées. Si vous n’arrivez pas à les repérer, communiquez avec nous à [email protected].
Questions? Contact the NRC Publications Archive team at
[email protected]. If you wish to email the authors directly, please see the first page of the publication for their contact information.
NRC Publications Archive
Archives des publications du CNRC
Access and use of this website and the material on it are subject to the Terms and Conditions set forth at
Culturally Appropriate Web User Interface Design Study: Research
Methodology and Results
Kondratova, Irina; Goldfarb, Ilia
https://publications-cnrc.canada.ca/fra/droits
L’accès à ce site Web et l’utilisation de son contenu sont assujettis aux conditions présentées dans le site LISEZ CES CONDITIONS ATTENTIVEMENT AVANT D’UTILISER CE SITE WEB.
NRC Publications Record / Notice d'Archives des publications de CNRC:
https://nrc-publications.canada.ca/eng/view/object/?id=34f5c1f7-2e60-431b-be4a-4c5127defd06 https://publications-cnrc.canada.ca/fra/voir/objet/?id=34f5c1f7-2e60-431b-be4a-4c5127defd061
Culturally Appropriate Web User
Interface Design Study: Research
Methodology and Results
Irina Kondratova, Ilia Goldfarb
National Research Council of Canada, Canada ABSTRACT
A number of research studies support the importance of culturally appropriate design for e-business, e-commerce and advanced learning applications. This is not surprising, considering influence of user interface design on usability, accessibility and acceptability of software. To identify cultural preferences in visual interface design, we conducted research studying culture-specific web interface design elements for a large number of countries all over the globe. This chapter reports on study methodology and results, focusing mostly on the global colors study. We explain the approach and research methodology we utilized to conduct the automated “cultural audit” for identification of culture-relevant design and color preferences in web interface design. Research methodology for a manual “cultural audit” is also discussed. We present the overall findings of our study, and conclude with observations on the usefulness of our research approach, the applicability of cultural analysis tools we developed and future research in culturally appropriate user interfaces.
INTRODUCTION
Cultural appropriateness of user interface design directly impacts on the user’s perception of credibility, trustworthiness and user acceptance of websites and results in significant economic impact. According to Forrester Consulting: “Global businesses are losing market share worth as much as $1.6 billion per year, or $4.7 billion over three years, by failing to localize product information” (Devine, 2007). Research shows that there is a lack of software development tools to support culturally sensitive user interface design. Availability of such tools will aid in broadening global business opportunities for small and medium size business enterprises (SME)s and help governments to inclusively provide electronic services to all segments of population including ethnic communities and recent immigrants.
In our research project we work on addressing the universal need in culturally appropriate user interface design that is brought up by globalization and is affecting most computer-mediated communication and, in particular, user interface design for web applications. In the background research conducted in the onset of the project, we discovered that, in spite of the wealth of information available regarding the issues related to design of international user interfaces, it is not easy for web designers and developers to acquire a deep cross-cultural understanding of user interface design. There is a number of existing cultural models and theories, which can be used to develop a set of broad cross-cultural design guidelines, similar to ones developed by Marcus and Gould (Marcus, 2000). This approach results in a mostly theoretical model of cross-cultural design, while the practical website development requires effective prototyping.
2
This was our motivation for the current research project where we work on development of a new approach to assist in cultural user interface design for web applications. We are building a cultural advisor tool that can aid software development teams in the quick production of the first draft of the cultural “look and feel” design including visual design elements that affect appearance of the webpage such as the choice of design colors, layout of the web page, use of white space, typography, the type and number of imagery used, etc. The design of this advisor tool is based on the extensive research utilizing data collection and analysis on a large number of websites for a number of locales. Data collection for the study was conducted using both automated and manual approaches. The study involves approximately 36,000 websites for 38 countries. This chapter addresses the research methodology we employed in both automated and manual evaluation of specific cultural markers, reports on results, focusing on the global colors study, addresses several important aspects of transferring our research results into practical implementation of the cultural design advisor tool, and provides several exemplary scenarios of how to utilize the advisor tool for culturally-appropriate web user interface development.
BACKGROUND
With wide-spread development of online communications, we learned to appreciate that the world is rapidly becoming a global marketplace. This is especially true for web applications and services that could be accessed all over the globe. In this new global economy: “As a consequence of existing international Internet users and in anticipation of potential users, usability takes on a relevant cultural context” (Barber, 1998). The importance of culturally appropriate user interface design for web-based business and government applications is emphasized by many researchers (Becker, 2002; Del Galdo, 1996; Hornby, 2002; Smith, 2004; Sun, 2001). Specifically, it is noted by many, that the “culturability” (Barber, 1998), a combination of culture and usability in web design, directly impacts on the user’s perception of credibility and trustworthiness of websites (Fogg, 2002; Jarvenpaa, 1999; Marcus, 2000).
There is a growing body of scientific evidence that supports the importance of culturally appropriate design for web-based learning applications (Barron, 2003; McLoughlin, 1999; Pfremmer, 2004; Priutt-Mentle, 2003; Seufert, 2002). This is not surprising, considering the influence of user interface design on the usability, accessibility and acceptability of software. “Usability is the measure of the quality of user’s experience when interacting with a product or system” (Usability.gov, 2004). International Standards Association (ISO/IEC9126, 1991) defines usability as “the capability of the software product to be understood, learned, used and attractive to the user, when used under specified conditions”. Usability includes factors such as ease of learning, efficiency of use, memorability, error frequency and severity, and subjective satisfaction. Thus, applying culturability design principles in the design process of web-based learning materials is an important factor to consider.
Culturally appropriate user interface design theories
As a part of our cultural user interface design study conducted at the National Research Council of Canada, Fitzgerald (Fitzgerald, 2004) wrote a comprehensive overview of issues related to cross-cultural user interface design presenting a thorough review of the models developed by researchers for managing the “subjective” aspects of cross-cultural user interface design. Within our research study, the term “culture” encompasses customary beliefs, forms of expression, and material traits of a particular racial group situated within certain geographical location and within certain time. The most broadly accepted models are cultural dimension (n-factor) models (Hall, 1990; Hofstede, 1991; Khaslavsky, 1998; Trompenaars, 1993), cultural marker models (Barber, 1998) and cultural attractors model (Smith, 2004). Cultural dimensions models attempt to measure and compare different cultures,
3
using a number of cultural factors. The number of factors varies from a four-factor model by Hall (1990), to five-factor model by Hofstede (1991), a seven-factor model by Trompenaars (1993), and a nine-factor model by Khaslavsky (1998), that combines Hall’s, Hofstede’s and Trompenaars’ models. The most extensively cited cultural dimensions model is the Hofstede’s (1991) model. This cultural model contains five factors including Power Distance, Uncertainty Avoidance, Masculinity vs. Femininity, Individualism vs. Collectivism and Time Orientation (orientation to past, present and future). Hofstede (1991) conducted his studies almost 20 years ago, using a large group of global IBM employees, thus limiting the results to a particular time and a particular “slice” of the local population (Jagne, 2004).
To date, several empirical research studies were conducted in order to evaluate the influence of Hofstede’s (1991) five cultural factors on human performance and user acceptance (Ford, 2003; Sun, 2002). Based on this model, cultural interface design guidelines were produced by Sheridan (2001) and Marcus (Marcus, 2000). Some researchers, such as Ford and Gelderblom (2003) did not find a strong correlation between human performances in groups of users differing in four of the five factors of Hofstede’s model. Other researchers (Del Galdo, 1996; Fernandes, 1995) have shown that it is quite difficult, if not impossible to translate cultural models, most often designed for the business arena, into user interface designs for particular cultures. We believe it is due to the fact that it is not easy to directly link visual user interface design elements such as colors, layout, imagery, metaphors, banners, navigation elements, etc. to such cultural factors as masculinity, femininity, uncertainty avoidance, etc.
A cultural markers model was developed by Barber and Badre (1998). “Cultural markers are interface design elements and features that are prevalent, and possibly preferred, within a particular cultural group” (Badre, 2001). Badre (2001) provides a detailed list of cultural markers corresponding to web design elements such as color, spatial organization, fonts, shapes, icons, metaphors, geography, language, flags, sounds, motion, preferences for text vs. graphics, directionality of how language is written (left vs. right), help features and navigation tools. Smith et al. (2004), in their work, define cultural design elements as “cultural attractors”, and list a smaller number of them: colors, color combinations, banner adverts, and trust signs, as well as use of metaphor, language cues and navigation controls.
Empirical studies focused on evaluating the influence of cultural markers on user performance and acceptance of websites did find some evidence of user preference for websites with cultural markers from their own cultures (Badre, 2001), improved performance for users on their local sites (Sheppard, 1999), or some cultural differences between website designs for different countries, such as UK and Korea (Juric, 2003). Based on our background study in to the work of others and our own research observations, it appears that the cultural markers approach is the one that is easier to “map” directly into culturally appropriate design elements, for a website, since most cultural markers represent design elements that are commonly used to create web user interface.
Practical development
Our background research shows that, in spite of the wealth of information available, on the issues related to designing culturally appropriate user interfaces, it is not easy for web designers and developers to acquire a deep cross-cultural understanding of cultural user interface design. There are a number of existing cultural models and theories, described earlier in this chapter, which can be used to develop a set of broad cross-cultural guidelines. This type of approach results in a mostly theoretical model of cross-cultural design, while the practical website development approach requires effective prototyping. To address this gap, within our research on the culturally appropriate web user interface design we are building a cultural “look and feel” prototyping tool. “Look and feel” of the web user interface relates to visual design elements that affect appearance of the webpage, including the choice of design colors, layout of the web page, use of white space, typography, the type and number of imagery used, etc. The tool is envisioned as an advisor tool that can aid software development teams
4
in the rapid production of the first draft of the cultural “look and feel” web design for the client. The client could be a company that wants to sell products or services in a different country or global region, an educational institution that delivers distance education courses to students abroad, or a government organization that provides services to immigrant or ethnic communities. Next section of the chapter provides some background on different approaches in user interface design and on user interface prototyping tools that help us to position the cultural advisor tool we are developing within the broad domain of user interface design tools.
User interface design approaches
The Human Computer Interaction (HCI) community, in order to develop user interfaces for software products, uses several common design approaches. Palanque and Bastide (Palanque, 2003) describe five of the most common approaches: “abstraction first: architectures at the forefront”; “semantic first: metaphors at the forefront”; “implementation first: toolkits at the forefront”; “process first: user centered design”, and “model first: model-based approaches”.
The “abstraction first” approach is based on the description of a typical structure of an interactive system in terms of abstract functionalities to be covered (e.g. presentation, or functional core interface). This approach is based on the Seeheim and Arch design models (Bass, 1992). The “semantic first, metaphors at the forefront” approach usually involves the use of metaphors to provide the unifying view of software elements. Toolkits are used to make the life of the software designers easier; however, most of these toolkits are hard to master and are usually poorly documented. User interface design based on the “process first” approach is an iterative, incremental user-centered design process. Initially it involves low fidelity software prototypes, and then moves towards high fidelity prototypes influenced by the user feedback. Model-based user interface design approach supports many models, such as the domain model, task model and scenarios, the user model, the platform model that links to the toolkits and to the environment, and the presentation model that is based on the appearance of the application, etc. (Palanque, 2003). Szekely (Szekely, 1996) describes a generic model-based interface development architecture consisting of four main components: modeling tools, a model, and automated design and implementation tools. Modeling tools may include a “design critics and advisors” component which provides a set of tools to evaluate user interface design. Design advisors frequently use a knowledge base of design knowledge, typically represented as rules, where the condition part of the rule presents a design element and the action part presents a way of refining the matched design element. However, there are some well-known difficulties with the automated user interface design approach. The main concern is the quality of the interface produced using automated tools. In addition, it is frequently not feasible to produce high quality interfaces from just data and task models (Harning, 1996). Consequently, some of the model-based interface design environments are moving away from automation and towards the use of computerized advisors, or wizard tools. Our cultural user interface design advisor tool belongs to this category of tools and is built on the knowledge base of data collected within our cultural user interface design research study.
User-centered design is the most widely known method for designing user interfaces. It is defined in the ISO 13407 standard as the process that typically “entails involving users in the design and evaluation of the system so that feedback can be obtained” (ISO13407, 1999). User-centered design for web applications is described in detail by Van Duyne et al. (van Duyne, 2002). In their book they use the term “customer-centered” design rather than “user-centered” design and argue that the term customer “evokes the fact that successful web sites account for issues that go beyond ease of use and satisfaction…” (van Duyne, 2002). Customer-centered design process or contextual design process often involves ethnographic studies to gather data relevant to the product. Customer-centered design builds on user-centered design by fusing marketing issues with usability issues. Marketing issues, for example, are quite important in the e-learning industry, where the client is usually not buying “shrink-wrapped” software, and, is from the beginning, actively participating in the development process. In particular, these issues in e-learning industry involve the need for the product to appeal to both the
5
learners (e.g. future users) and the managers who are normally the clients and buyers for the products. Utilizing the customer-centered design approach should help to escape the pitfalls of the company-centered design process, where the needs and interests of the company dominate the structure and the content of the final software product. The fatal flaw in this is that what the company executives think should be in the product is not necessarily what real customers (learners or end users) need or want.
Products developed using the technology-centered design approach are often built with little upfront research about customer needs and business needs, resulting in products overloaded with animations, audio and graphics and often looking amateurish. The designer-centered design approach is the one that is the most difficult to escape. Often the thinking is: “What the client sometimes doesn’t understand is the less they talk to us, the better it is. We know what’s best” (van Duyne, 2002). In the designer-centered approach the needs of clients are placed beneath the creative and expressive needs of the designer. This approach normally will not work well in the courseware development environment, where client’s preferences have the most impact on the design outcomes. The cultural design advisor tool helps to overcome pitfalls of both, technology-centered and designer-centered approaches, by focusing on the needs and preferences of users in a particular geographical locale.
Rapid prototyping tools
Within our cultural user interface design research project, the cultural “look and feel” advisor tool we are building is envisioned as a tool that will help web designers in generating ideas and sharing them with the development team members, getting feedback from the clients, and choosing the best design from several design alternatives. In particular, the tool allows with a few clicks of the mouse to create several prototype user interfaces for a particular locale based on the library of culturally appropriate user interface templates within the tool. These prototypes could be demonstrated to the client to elicit client preferences, at the same time maintaining overall cultural appropriateness of user interface design. This tool belongs to the category of online rapid prototyping tools that are used at the early stage of the design process, where prototype is defined as “a concrete representation of part or all of an interactive system” (Beaudouin-Lafon, 2003). Designers in creative fields, such as typography or graphic design, frequently create offline (paper-based) prototypes to express ideas and reflect on them. The advantage of offline prototypes is that a wide range of people, not just programmers, can create them quickly and inexpensively at the early stage of design. However, in the case when rapid feedback from the user is required on the interface design, online (software-based) prototypes are much more useful. Our software-based design advisor tool is developed based on the results of the extensive cultural web user interface design study.
CULTURAL WEB USER INTERFACE STUDY
The cultural user interface design research study began several years ago when we were approached by a local non-profit organization working in the area of translation and localization - they wanted to develop a database of cultural information to help local business in their global business efforts. At the inception of the project we conducted background research in order to find out what resources and information is available to help web developers in designing culturally appropriate websites. This study revealed that there is lack of localization resources, beyond simple date/time/currency formatting, to help web developers in creating culturally appropriate user interface designs. We wanted to fill this gap by developing the advisor tool to assist in building culturally appropriate user interfaces for the web.
In order to collect culturally relevant visual design information for the cultural advisor tool, we implemented both, an automated and manual “cultural audits” on a large number of websites, from different countries. We focused on the usage of specific visual cultural markers for website design. Within our study, cultural markers are defined as “interface design elements and features that are
6
prevalent, and possibly preferred, within a particular cultural group” (Badre, 2001). Visual cultural markers we investigated utilizing automated cultural web data mining techniques are colors, font usage, number of images, and layout of the webpage. Information on these cultural markers is normally contained within the HTML code. Clearly, not all cultural markers could be automatically collected. By their nature, some cultural markers, especially those related to images, such as icons, flags, symbols, pictures related to geography, shape and architecture require involvement of human evaluators. This was accomplished in the design of the manual cultural web user interface evaluation study that is conducted manually by several researchers to provide further insights on design trends observed on a large number of website from different countries such as types of images, graphics, creative use of typography, and overall color choices. All data collected in the process of manual observations and through automated analysis tools inform the design of and the information contained within the cultural advisor tool.
Automated cultural data mining
Within the automated cultural data mining study we utilized a Cultural Web Spider (CWS) software tool. A CWS tool is a web crawler: an “intelligent web search agent that takes as input a specialized information need and returns as output search results that satisfy the information need” (Kraft, 2004). The Google API has enabled rapid development and easy maintenance of a wide range of intelligent web crawlers for efficient information gathering on the web (Finin, 2004).
A CWS tool is designed to extract information on culture specific web page design elements (cultural markers) from the HTML and CSS code of websites for a particular country domain (eg: .ca for Canada, .fr for France, .jp for Japan, etc.) (Kondratova, 2005). The CWS application utilizes Google web services (Google, 2006) to search for particular cultural markers on web pages of top ranked websites within the GOOGLE index for a country domain. The web crawler tool collects information on the color usage (e.g. page background colors, table background colors, font colors, etc.), font usage, and number of images on a website. This information is saved in a database and is available for further statistical analysis and visualization. An analysis software tool was developed to analyze the information collected in the database and generate in between countries comparisons for different cultural markers such as color usage, font usage, the number of images used on the page, usage of style sheets, etc. To date we have collected and analyzed data based on 900-1000 top ranked web domains in GOOGLE index for 38 countries located in Africa (4), Asia (9), Europe (17), Latin America (3), North America (3), and Oceania (2). The list of countries studied is presented in (Kondratova, 2007).
When utilizing a web crawler to collect data for further analysis, it is important to make a proper choice of methodology for the survey, and, especially, of websites for data collection (Fitzgerald, 2004). We trust that the utilization of a web crawler for cultural information gathering provides data representative of a particular country’s cultural preferences due to the chosen data collection methodology within the study. The crawler is searching the top-ranked (the most popular) pages in GOOGLE index for a particular country, limiting search to country-specific web domains located within the particular region and written in country’s official language. It is possible that for some of the top-ranked websites we studied the local users favor accessing the website because they find the content useful and not because they like the design. However, since these websites are most likely designed by local web designers (as assured by country domain restricted search in GOOGLE index) we believe they do truly represent country-specific design choices. The validity of our methodology for choosing the most popular websites for a country was confirmed by our manual evaluation process where researchers visually observed and confirmed common trends in design on large number of websites for that particular country.
To investigate the appropriateness of our research approach, and the functionality and usefulness of the cultural analysis software tools we have developed within the project such as the cultural web
7
spider tool, HTML data analysis and visualization tools and color analysis tools, we conducted an in-depth research study that focused on web design color preferences for 38 countries around the globe. We conducted our netnographic (Kozinets, 2002) color usage study on a large number of website for a certain locales and harvested color usage data on the top ranked websites for a particular locale. We believe that the choice of colors on these “popular” local websites, to a significant degree, reflects local users’ preference for a particular color or color combinations. Next section of the chapter describes our global color study.
Study on cultural color preferences in web design
Color plays an important role in different cultures throughout the history, and the choice of color plays vital role in design, advertising and marketing (Cage, 1999). Some researchers suggest that certain colors have symbolic connotations in different countries, for example that green is preferred color in Islamic counties, red is preferred color in China and black is preferred in US, although has some unfavorable connotations in Asia, Latin America and Europe (Chattopadhyay, 2002). Others (Gorn, 1997) connect colors with feelings, especially in advertising. Recent research study by Chattopadhyay et al. (2002) suggests that most aspects of color (hue) preference are likely to be culturally universal: in fact, in their research they found that blue was the most preferred hue in every culture.
In our study on cultural preferences in website design for a number of countries we wanted to explore, in addition to other cultural markers, color preferences expressed by web designers in choosing colors for their websites, including colors chosen for webpage background, table background, graphics, text, imaging, etc. The underlying assumption is that the Internet, as a medium of communication, presents an opportunity for designers to truly express their color choices since the choice of colors for webpage is not constrained by cost or technical limitations that are frequently imposed when working with the print media.
The color usage pilot study investigated color use on the web by studying a large number (from 900 to about 1000) of county-specific websites per each of 38 countries. The first stage of the study involved web crawling with the CWS tool and extraction of color-specific information from HTML code, such as background color, font color, colors used within the tables, colors used in design elements, etc. For the second stage of our study, the results collected by the CWS tool were statistically analyzed and visualized via the cultural analysis software we developed. Visualization involved presenting most frequently used colors within the Red, Green Blue (RGB) color model for a particular country as color charts.
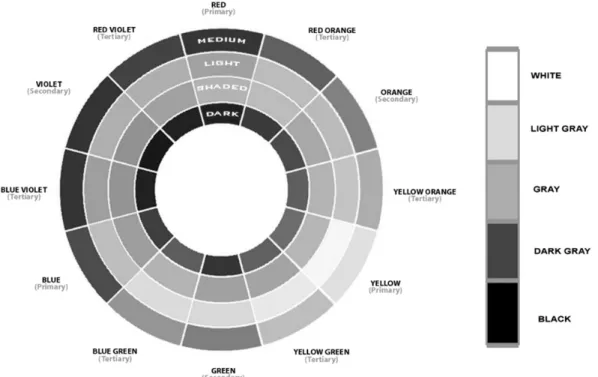
Visualization of color usage presented some difficulties. Designers have at their disposal a palette of about 16.7 million colors based on HTML RGB color code to create their interface designs. Therefore, the main inconvenience, in visualizing the results of our study, was that it is difficult to present all the RGB design colors used preferentially within a particular country in a convenient and user friendly format. To resolve this issue, we developed a visualization methodology that enabled us to categorize all the colors discovered in our search into a manageable number of color categories corresponding to the user friendly “artistic” color palette based on the “color wheel” palette of twelve hues (Itten, 1974). Our “artistic” palette includes such intuitive and easy to understand color categories as white, black, three shades of gray (dark gray, gray and light gray), and four shades for each color hue such as dark blue, light blue, medium blue and shaded blue for blue; light yellow, medium yellow, dark yellow and shaded yellow for yellow, etc. (see Figure 1). By utilizing the proprietary algorithm for color clustering, we were able to analyze the color usage data more efficiently and visualize the results, presenting color information as a color pie chart for a particular country where the colors are clustered into a manageable number of color categories.
In the process of further data analysis we have discovered limitations imposed by the nature of the HTML “harvesting” process. For example, for any website that has images and graphics as most prominent design elements, image color information is lost in the automated color analysis based on
8
HTML code, since image color information is not contained in the HTML or CSS code. Moreover, within HTML color analysis we count instances of a particular color usage in the HTML code. However, the number of instances for a particular color does not necessarily provide true indication of color preferences, since the area of color coverage is not taken into account. For example, multiple usage of a color “dark blue” as a cell background color in the table will result in an overall higher count of “dark blue” color usage, than when the same “dark blue” color is used as a background color for the entire table (despite the fact that the resulting visual effect could be the same).
Figure 1. “Artistic” color wheel
To overcome this apparent shortcoming in our HTML data collection and analysis methodology, we developed another method and a set of tools for color analysis that allowed us to analyze and quantify the totality of color usage on the web page. This approach provides an opportunity to automatically analyze color usage on a large number of websites, and capture and analyze total color usage on the webpage.
The “total color analysis” method and software tools we developed allow us to precisely measure the relative coverage of different colors on the webpage of interest in percentage of the total webpage area and visualize color usage through country-specific color usage charts (Kondratova, 2007). As an example of results we obtained by analyzing colors on Japanese websites, a total color usage chart for Japanese websites is presented in Figure 2. Similar color charts were produced for all countries studied.
Color Palettes
In order to derive country-specific color palettes for all countries studied, results obtained by utilizing both, the HTML color analysis and the total color analysis methods, were examined using the following approach. We chose the sixteen most commonly used colors for a particular country, based on results obtained by the “total color usage” methodology, since it does represent the overall color
9
usage on the web page. After this, we cross referenced these color palettes for a particular country with the results obtained by using the HTML color analysis. In this way we could eliminate colors that might be present in images on web pages, but do not correspond to color preferences we identified though the HTML analysis. This cross-referencing process helped us to choose a country palette of colors with both, high coverage area and high number of usage instances, verifying country-specific color preferences obtained by using each of the methods separately.
Figure 2: Total color usage: color palette for Japan
“International” color palette
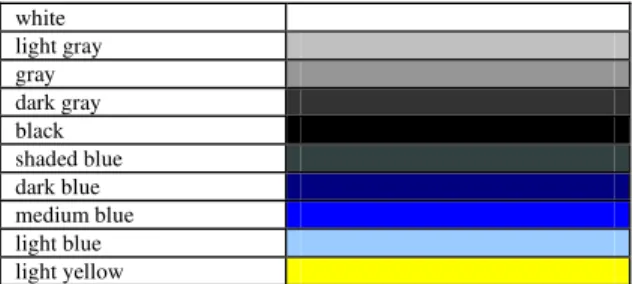
When we completed data analysis for all countries, results of our cultural color usage analysis revealed that some colors are commonly and preferentially used across all countries studied. These colors include white, black, all shades of gray, all shades of blue and a light yellow color. We named this color palette the “international colors palette” (Figure 3). As a next step, we continued with further data analysis in order to single out country-specific color preference. As a result, we identified two to four additional “country-specific” colors by cross-referencing data obtained via HTML color analysis and total color usage analysis methods.
10 white light gray gray dark gray black shaded blue dark blue medium blue light blue light yellow
Copyright © Her Majesty in Right of Canada, (2009)
Figure 3. “International” color palette
“Country-specific” color palettes
In order to further expand the palette of country-specific colors for different countries, we chose to base our color usage recommendations on the range of preferred colors obtained through the total color usage analysis on web pages. We believe that they represent the overall visual appearance of country-specific websites more precisely than the color information contained in HTML code since results of total color analysis capture overall color usage including colors in images, graphic elements, as well as HTML elements. During the further data analysis process, we removed the “international” colors from the color charts obtained via total color analysis of country-specific websites and obtained resulting color palettes represented with pie charts with relative percentage of the coverage area for each color identified. An example of a country- specific color palette for Japan is presented in Figure 4. Similar color palettes were prepared for all countries we studied.
As a next step in our global color study, we looked at the process of how these “country-specific” color palettes could be used to develop recommendations on country-specific color combinations for culturally appropriate web design. Since color categories in our color palettes are based on widely accepted in graphic design Johannes Itten’s twelve-point color circle, we suggest that the process steps could follow the color theory approach to choosing colors from the color circle for determining complementary color pairs and harmonious color triads (Itten, 1974). It is important to mention, that there are other relevant sources of information available for designers for choosing appropriate color combinations (Kobayashi, 1991; Mante, 1972), as well as some software resources such as ColorWheel software (ColorWheelPro, 2007). Design color decisions could be also supported by the sources that present information on “historical” meaning of particular colors (Cabarga, 2001; Cage, 1999; Cage, 2000; Vanka, 1999). As a result, there could be many sources of information on design color combinations, available through various published sources, which designers could use in their work to design country-specific website designs, with overall choices of color combinations guided by statistical country-specific color usage information obtained in our study. To accommodate design creativity, in our suggested approach we do not restrict the choice of design colors, for example, a red orange color category contains a wide range of red orange hues for a designer to choose from. This is true for all other color choices.
11
Figure 4. “Country-specific” color palette for Japan
Example: Color Combinations for Japan
As an example, we demonstrate how a designer can choose appropriate color combinations for Japan, based on the color palette in Figure 4 and utilizing Itten’s color theory. As seen from Figure 4, the following colors are prevalent in the country-specific palette for Japan: green (21.5% in total for dark, light and medium green), red orange (13.7% in total), orange (13.6% in total) and yellow orange (12.7% in total). In addition to these colors, yellow has quite a significant presence in the palette of colors used in Japan (medium and dark yellow in total give 7.2 % and light yellow is popular as well as seen from Figure 2). Choosing these hues as dominant colors and based on the color theory, a designer can look for the appropriate color combinations (schemes) that could be used with these colors.
Such color schemes to choose from could be complementary, split complementary, analogous, etc. Complementary color pairs are any two colors which are diametrically opposite one another in the color wheel. Split complementary scheme could be achieved by substituting for one color of a complementary pair the two colors that lie on either side of the color wheel. For example, to harmonize green, a designer can choose a pair of colors such as red-orange and red-violet (or either one of them) to form the triple or pair harmony with the predominant green color. In case of Japan, since red orange is predominantly used, it might be appropriate to use this color with green. To expand the analysis, based on the color chart for Japan, an analogous color scheme that uses colors that are
12
adjacent to each other on the color wheel would be yellow, yellow orange, orange and red orange. If a designer were to choose a different source or a system for appropriate color combinations (Kobayashi, 1991), there will be a different set of harmonious color combinations that could be defined for webpage design that is culturally appropriate.
MANUAL CULTURAL AUDIT
In our research we studied the usage of specific cultural markers for website design using both automated cultural web data mining tools and visual observations by human observers. The first study was completed utilizing automated evaluation tools, such as a Cultural Web Spider tool (CWS) and various cultural analysis and visualization tools. To validate results of this study and to collect data set that could not be collected in the automated study such as types of graphics and imagery used, layout of the page, use of white space, navigation controls, etc. the manual cultural audit study was conducted. Researchers manually conducted observations to collect data on the specific cultural markers on the same set of websites for all countries that were evaluated within the automated cultural data mining study.
Data Collection Methodology
For our second research study, we chose the following design elements that would be analyzed by human evaluators: typography, graphics and layout, in combination with color. A survey tool was developed using these elements in general, as well as any relevant sub-category for each of the elements, adding up to twenty five different variables to be observed by human evaluators for each website (an example of the survey tool is presented in Table 1). A sample of 100 out of 1000 websites, specific to a particular country, was examined in close detail by at least two human evaluators using the survey tool. Any indication of reoccurring trends was recorded. After this, the trends observed on a smaller set of websites were confirmed by researchers’ observations on the rest (around 900) of websites for a specific country. Based on the results of this evaluation work, some general and country-specific recommendations for culturally appropriate design were developed. These recommendations, along with research results from the first automated study and the results of the literature review on culturally specific visual design elements for all countries studied, together form the knowledgebase for the cultural design advisor tool.
To obtain country-preferred color combinations for the survey tool, two top country-specific colors were selected from the country-specific color usage pie chart (see example for Brazil in Figure 5) and combined with their opposing or neighboring colors on the color wheel. The resulting choice of color preferences for a particular country was cross-referenced with the results of the ethnographic studies conducted by Cabarga (Cabarga, 2001). Two color palettes (international and country-specific) were defined for each country and used by researchers to survey color usage in web design at a deeper level. It is important to note, that, as we found though our observations, in some countries designers are using blue color predominantly in their domestic design palette (for example in UK, Australia), this is why we chose to incorporate shades of blue within the country-specific color palettes for these countries.
13
Figure 5. Country-specific color palette for Brazil
Colors Internationa1
Country specific colors
Typography Type of fonts
Colored fonts
Graphics Number Types
Layout Banners Menu location
Use of white space Justification Number of columns
Culture Holfstede’s dimensions
Copyright © Her Majesty in Right of Canada, (2009)
14
Examination of Specific Visual Cultural Markers
Of equal importance to the design of culturally appropriate web site is the use of imagery in combination with layout. In our research, imagery included graphics, photographs of people or things, cartoons, maps, graphs, banners that display stylized fonts, etc. In the manual survey we identified certain country-specific imagery preferences that can be attributed to cultural dimensions or attributes specific to the country. Within the imagery, we were looking for preferences in using images of people, people’s close-ups, or images of “things” (e.g. buildings, landscapes, equipment, etc.). For example, we found that Brazilian web designers frequently use images of people, including close ups of human faces and well as “things” in their designs, while in Japan there is clear preference to use images of “things” (nature, buildings, etc.).
In our manual evaluation process through visual observations of a representative set out of 900-1000 website per country, we also recorded visual design features corresponding to Hofstede’s cultural factor model (Hofstede, 1991). In particular, we recorded and analyzed features associated with such cultural factors such as Power Distance; Uncertainty Avoidance; and Masculinity vs. Femininity as reflected in visual interface design. Following methodology developed in the research study done by Marcus and Gould (Marcus, 2000), we measured Power Distance by site’s focus on logos/seals or focus on people. When evaluating tendency towards Femininity/Masculinity dimension in visual design, we were looking for women’s editions of popular websites. To estimate tendency to Uncertainty Avoidance, we were looking for navigation structure and the amount of links on the menu or on the website. Predominant typography features on web pages for a particular country were examined as well. In particular, we paid attention to the usage of elaborate heading fonts, and recorded the usage of color in typography.
We will now illustrate some aspects of our research methodology using the example of data collection for Brazil. We used the survey form presented in Figure 6 to conduct a manual survey on websites from Brazil, in detail examining top 100 websites and confirming our observations by taking note of visual design patterns on another 900 websites. Our manual evaluation confirmed prevalence of country-specific design color choices we identified as country-specific palettes on Brazilian websites; our observations also revealed that there are, in general, plenty of images on Brazilian websites, without any well defined preference for images of people vs. images of “things”. Examination of typography on Brazilian websites showed prevalent use of stylish fonts in various places from menus to explanatory text. Layout observations showed that the layout preference for Brazilian website designs is clean and organized with web pages, in general, containing significant amount of white space. We found that the majority of Brazilian websites favor their menus either at the top or along the left side of the screen. Banners are also popular and placed equally at the bottom and the top of the page. Brazil scores 69 on the Power Distance index, indicating a moderately high power distance. This may translate into website designs with strong, hierarchical structures and an appearance of seals and logos. We did find evidence of this tendency in our observations. Brazil scores 49 on the Masculinity vs. Femininity index (MASC), this may translate into web design that is sometimes gender specific. We observed a very small number of feminine styled websites that somewhat supports the neutral MASC factor. As for uncertainty avoidance (UA): Brazil scores 76 on the UA index. With a high uncertainty avoidance score, the expectation is for websites to be designed with clear and guided navigation, as was confirmed by our observations.
The most challenges we experienced in collecting data and interpreting results of our observations, within the manual evaluation study, were in evaluating Hofstede’s cultural factors based on observations of visual website design. In spite of closely following the methodology developed by Marcus and Gould (Marcus, 2000), we found that cultural factors categorization process is somewhat lacking precision and clarity, as compared with evaluating colors and visual design elements.
15
IMPLEMENTATION OF FINDINGS – CULTURAL ADVISOR TOOL
Within our research study, results we obtained in the automatic and manual cultural studies form the basis for the cultural advisor tool design. This software tool contains a step-by-step design guide, a set of cultural templates for each country studied, useful information on local culture, and results of our cultural user interface study, including country-specific findings on usage of color, imagery, fonts, and other observations. This information could be used by web developers and SMEs to aid in the production of the first draft of the cultural “look and feel” design for their web application. It could also be used to collaborate with clients, balancing client preferences for product interface design with the need for culturally appropriate design features. We believe that our advisor tool would be especially useful for SMEs that want to develop software applications for international markets, but frequently do not have in-house internationalization/localization expertise or the budget to hire a professional localization company.
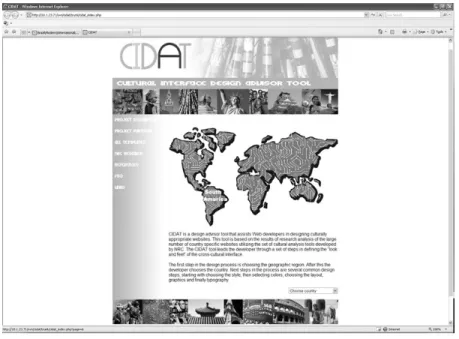
We envision the cultural advisor tool being used by non-expert designers (e.g. novice web developers or SMEs) in the following fashion. The developer can choose a region or a particular country directly from the menu or on the map (see Figure 7). After this, the developer follows the step-by-step design process driven by the advisor tool, starting from the choice of predefined design style (e.g. modern, traditional, etc.), followed by the choice of an appropriate color palette (e.g. international or country-specific) and typography. At the end of the process the developer has a ready-to-go, culturally appropriate web template for a particular country that is based on design choices made. The user can also skip the step-by-step design process altogether and go directly to the set of design templates prepared for a country and choose from them. These templates are created by a designer/researcher within the team and deeply inspired by the results of observations on the large number of websites for a particular country. Within the advisor tool, there is also plenty of supporting information on our research findings for the country and on research results from others. The tool contains general information on the country, preferred choices of colors, imagery, fonts, layout and Hofstede’s indices as well as our observations based on the manual evaluation of visual design elements. All this information is provided to assist in the decision making process related to a choice of culturally appropriate visual design.
16
Figure 7. Cultural interface advisor tool
We also believe that the advisor tool will be as well a useful tool for expert designers who are not familiar with cultural user preferences for a particular country. This relates to the choice of culturally appropriate color palettes, imagery, navigation and layout. Since all our research results, including information on country specific color usage and preferred color palettes is incorporated within the advisor tool, experienced designers will have valuable data in their hands to support design decisions. To name a few, this includes statistical results on color usage per country; average number of images per page as well as types of preferred imagery; preference towards colored fonts or stylized fonts; usage of white (empty) space; justification; menu placing preferences, etc. This information provides designers with a general framework and guidelines on what the Internet users in a particular country are used to seeing on the web page. The designers’ choices will be informed by this knowledge and by the utility of the website. In some cases, it might be a proper choice by a designer to choose a web design that is different and “stands out” in order to attract attention of potential customers or buyers of the particular product, or it could be more “traditional” design, in line with what customers in this particular country are accustomed to. Most importantly, we believe that the design choice that is based on the knowledge collected within the cultural advisor tool will be well informed and culturally appropriate, and should attract and not offend or upset potential users and customers.
CONCLUSIONS
The cultural interface design study investigated the usage of specific cultural markers for website design in a number of countries, in order to incorporate the results into a cultural interface design advisor tool. In particular, along with other visual markers, such as fonts, layout, number of images, we investigated in detail the usage of color for website design in different countries and developed recommendations for country-specific color palettes which are culturally appropriate. Within the cultural color usage study, we in-depth investigated colors chosen for the webpage background, table background, graphics, text, imaging, as well as overall usage of color in the web interface design. The underlying assumption was that the Internet, as a medium of communication, presents an opportunity for designers to truly express their color choices since the choice of colors for webpage is not
17
constrained by cost or technical limitations that are frequently imposed when working with print media. Interestingly enough, in our color usage study we found that a palette of about ten colors is commonly and preferentially used across all countries studied. These colors include white, black, shades of grey, shades of blue, and a light yellow color. We named this color palette the “international colors palette.” We believe that colors from this palette could be used by designers to develop “international” user interfaces by choosing design colors that will be appropriate for a multitude of cultures. When localization is required, other country-specific color palettes that we discovered could be utilized to design an interface that will be attractive and culturally appropriate for the local audience.
In addition to in-depth study of cultural color preferences, we investigated the usage of other cultural markers in web design such as layout, font usage, types and number of images, menu location, use of banners, etc. In our research, we utilized automated web data mining tools and complemented results with a manual evaluation on a representative number of the websites per country. This methodology allowed us to confirm results of automated evaluation, complement automated cultural data mining results with observations of researchers, and develop a set of cultural web templates that are truly inspired by country-specific web design preferences. Another important outcome of this research study is that we developed a number of cultural research tools and research methodologies that could be used by researchers for conducting ethnographic and cultural studies on the Internet, by marketing and advertising companies to identify cultural trends for advertising and marketing purposes, and by web designers to design culturally appropriate web user interfaces.
FUTURE WORK
Within the cultural user interface design research project, we evaluated the cultural advisor tool internally in our work with external clients. In particular, we utilized the cultural interface design advisor tool to generate advice on culturally appropriate design for websites that provide information to potential immigrants to Canada. In the future, the final version of the cultural advisor tool will be evaluated by web designers and developers, in order to confirm the usefulness of the tool for the industry. Another promising development for the project will be to look at expanding the set of our cultural web data mining tools and research methodology towards analyzing other cultural artifacts such as multimedia, gaming, mobile user interfaces, etc. This will allow us to develop deeper understanding of different aspects of cultural visual design for new digital media and develop other useful software tools geared towards designers as well as advertising, marketing and creative industries.
REFERENCES
Badre, A. N. (2001). The Effects of Cross Cultural Interface Design Orientation on World Wide Web
User Performance Atlanta, GA: Georgia Institute of Technology, College of Computing, GVU Centre. Barber, W., Badre, A.N. (1998). Culturability: The Merging of Culture and Usability Paper presented at the Human Factors and the Web, Our Global Community, Basking Ridge, New Jersey, USA. Barron, A. E., Rickerman, C. (2003). Going Global. Designing E-Learning for an International
18
Bass, L., Faneuf, R., Little, R., Mayer, N., Pellegrino, B., Reed, S., Seacord, R., Sheppard, S., Szczur, M. R. (1992). A Metamodel for the Runtime Architecture of an Interactive System. ACM SIGCHI
Bulletin, 24(1), 32-37.
Beaudouin-Lafon, M., MacKay, W. (2003). Prototyping tools and techniques. In The
Human-Computer Interaction Book (pp. 1006-1031): Lawrence Erlbaum Associates Publishers, London. Becker, S. A. (2002). An Exploratory Study on Web Usability and the Internationalization of US E-Businesses. Journal of Electronic Commerce Research, 3(4), 265-278.
Cabarga, L. (2001). The Designer's Guide to Global Color Combinations. 750 Color Formulas in
CMYK and RGB from Around the Word. Cincinnati, Ohio.
Cage, J. (1999). Color and Culture: Practice and Meaning from Antiquity to Abstraction: University of California Press.
Cage, J. (2000). Color and Meaning: Art, Science, and Symbolism: University of California Press. Chattopadhyay, A., Darke, Peter R., Gorn, Gerald J. (2002). Roses are Red and Violets are Blue -
Everywhere? Cultural Differences and Universals in Color Preference and Choice Among Consumers and Marketing Managers: Sauder School of Business
ColorWheelPro. (2007). Retrieved January 25, 2007, from http://www.color-wheel-pro.com
Del Galdo, E. M., Nielsen, J. (1996). International User Interfaces. New York John Wiley & Sons Devine, P. (2007). The Total Economic Impact of Global Information Management: Forrester Consulting.
Fernandes, T. (1995). Global Interface Design Academic Press.
Finin, T., Peng, Y., Cost, R. S., Sachs, J., Joshi, A., Reddivari, P., Pan, R., Doshi, V., Ding, L. (2004). Swoogle: A search and metadata engine for the Semantic Web. Paper presented at the CIKM’04.
Fitzgerald, W. (2004). Models for cross cultural communications for cross-cultural website design. from http://iit-iti.nrc-cnrc.gc.ca/publications/nrc-46563_e.html
Fogg, B. J. (2002). Persuasive technology: Morgan Kaufmann Publishers.
Ford, G., Gelderblom, H. (2003). The effects of culture on performance achieved through the use of
human-computer interaction. Paper presented at the Proc. 2003 annual research conference of the South African Institute of Computer Scientists and Information Technologists on Enablement through technology (SAICSIT 2003).
Google. (2006). Google Web APIs. Retrieved January 26, 2007, from http://www.google.com/apis/
Gorn, G. J. C., Amitava, Yi, Tracey, Dahl, Darren W. . (1997). Effects of Color As an Executional Cue in Advertising: They're in the Shade Management Science, 43(10), 1387-1400.
Hall, E., Hall, M. R. (1990). Understanding cultural differences. Yarmouth, Maine: Intercultural Press.
Harning, M. (1996). An Approach to Structured Display Design - Coping with Complexity. Paper presented at the Proceedings of CADUI’96., Namur , Belgium.
19
Hornby, G., Goulding, P., Poon S. . (2002). Perceptions Of Export Barriers And Cultural Issues: The SME E-Commerce Experience. Journal of Electronic Commerce Research, 3(4), 213-226.
ISO13407. (1999). Human centred design processes for interactive systems. Retrieved. from.
ISO/IEC9126. (1991). Software product evaluation - Quality characteristics and guidelines for their
use. Retrieved. from.
Itten, J. (1974). The Art of Color: the Subjective Experience and Objective Rationale of Color John Wiley and Sons.
Jagne, J. (2004). Integrating cultural and social factors of the shopping metaphor, in the context of
indigenous users, into e-Commerce interface design (No. Technical Report: IDC-TR-2004-004). Middlesex University: Interaction Design Centre, School of Computing Science.
Jarvenpaa, S. L., Tractinsky, N., Saarinen L., Vitale, M. (1999). Consumer Trust In An Internet Store: A Cross-Cultural Validation. Journal of Computer Mediated Communication 5(2).
Juric, R., Kim, I., Kuljis,J. (2003). Cross cultural web design: an experience of developing UK and
Korean cultural markers. Paper presented at the Proceedings of 25th International Conference on Information Technology Interfaces ITI 2003, Cavtat, Croatia.
Khaslavsky, J. (1998). Integrating culture into interface design. Paper presented at the Proceedings of CHI 98 on Human factors in computing systems, Los Angeles, CA.
Kobayashi, S. (1991). Color Image Scale: Kodansha International .
Kondratova, I., Goldfarb, I. (2007). Color Your Website: Use of Colors on the Web. Paper presented at the HCI International 2007, Beijing, China.
Kozinets, R. V. (2002). The Field behind the Screen: Using Netnography For Marketing Research in Online Communities. Journal of Marketing Research, 39, 61-72.
Kraft, R., Kim, S., Stata, R. (2004). Extending the Google API for web carnivores. Paper presented at the WWW2004.
Mante, H. (1972). Color Design in Photography.
Marcus, A., Gould, E.W. (2000). Cultural Dimensions and Global Web User Interface Design: What?
So What? Now What? Paper presented at the Proceedings 16th Conference on Human Factors and the Web, Austin, Texas.
McLoughlin, C. (1999). Culturally Inclusive Learning on the Web. Paper presented at the Proceedings Teaching and Learning Forum 99.
Palanque, P., Bastide, R. . (2003). UML for Interactive Systems: What Is Missing. Paper presented at the Proc. of the IFIP INTERACT Workshop: Closing the Gap: Software Engineering and Human-Computer Interaction. from http://www.se-hci.org/bridging/interact/.
Pfremmer, R. (2004). Content Design Considerations for Localizing E-learning Projects. MultiLingual
computing.
Priutt-Mentle, D. (2003). Cultural Dimensions of Multimedia Design for Instruction. Paper presented at the Proceedings National Educational Computing Conference, Seattle, USA.
Seufert, S. (2002). Cultural Perspectives. In H. H. Adelsgerger, Collis, B., Pawlowski, J. M. (Ed.),
20
Sheppard, C., Scholtz,J. (1999). The effects of cultural markers on website use. Paper presented at the Proceedings 5th Conference on Human Factors and the Web, Gaithersburg, Maryland.
Smith, A., Dunckley, L., French, T., Minocha S., Chang, Y. (2004). A Process Model For Developing Usable Cross-Cultural Websites. Interacting With Computers, 16(1), 69-91.
Sun, H. (2001, October 21-24). Building A Culturally-Competent Corporate Web Site: An Exploratory
Study Of Cultural Markers In Multilingual Web Design. Paper presented at the Proceedings 19th annual international conference on computer documentation, SIGDOC 01, Santa Fe, New Mexico, USA.
Sun, H. (2002). Why Cultural Contexts Are Missing: A Rhetorical Critique of Localization Practices. Paper presented at the Proceedings of STC 49th Annual Conference, Nashville, TN.
Szekely, P. (1996). Retrospective and Challenges for Model-Based Interface Development. Paper presented at the Proceedings of the CADUI’96: Second International Workshop on Computer-Aided Design of User Interfaces.
Trompenaars, F. (1993). Riding the waves of culture: Understanding cultural diversity in business London: Nicholas Brealey.
Usability.gov. (2004). Usability Basics., from http://usability.gov/basics/index.html
van Duyne, D. K., Landay, J.A., Hong, J.I. . (2002). The Design of Sites: Patterns, Principles, and
Processes for Crafting a Customer-Centered Web Experience (1st edition ed.): Addison-Wesley Pub Co.
Vanka, S. (1999). ColorTool: The cross cultural meanings of color. Paper presented at the IWIPS.
21
KEY TERMS & DEFINITIONS
Culture: Includes the customary beliefs, forms of expression, and material traits of a particular racial group situated within certain geographical location and within certain time.
Culturability: a combination of usability and cultural appropriateness for a particular audience
Cultural appropriateness: Cultural appropriateness is essential for designing user interfaces or web interfaces for international and country-specific audiences that will be accepted and liked by the users.
Cultural markers: In our study cultural markers are web user interface design elements such as colors, fonts, images, layout that are prevalent within website designs for a particular country.
Cultural web data mining: collecting and analyzing and visualizing data related to cultural preferences expressed in website designs for a particular locale (country).
Cultural analysis tools: software tools that assist in collecting data and analyzing usage of specific cultural markers on websites for a particular locale (country or region).
Cultural Interface Design Advisor Tool: A decision support tool that helps the user to select culturally appropriate design elements for a website.
Rapid prototyping: A step in software development process that supports user’s involvement in design by allowing users to see and experience the final system before it is built.
Visual web design: Important in communicating with the uses, involves choices of visual design elements and their organization on the webpage to engage the users.