Publisher’s version / Version de l'éditeur:
Journal of Computing in Civil Engineering, 22, 6, pp. 360-372, 2008-11-01
READ THESE TERMS AND CONDITIONS CAREFULLY BEFORE USING THIS WEBSITE. https://nrc-publications.canada.ca/eng/copyright
Vous avez des questions? Nous pouvons vous aider. Pour communiquer directement avec un auteur, consultez la
première page de la revue dans laquelle son article a été publié afin de trouver ses coordonnées. Si vous n’arrivez pas à les repérer, communiquez avec nous à [email protected].
Questions? Contact the NRC Publications Archive team at
[email protected]. If you wish to email the authors directly, please see the first page of the publication for their contact information.
NRC Publications Archive
Archives des publications du CNRC
This publication could be one of several versions: author’s original, accepted manuscript or the publisher’s version. / La version de cette publication peut être l’une des suivantes : la version prépublication de l’auteur, la version acceptée du manuscrit ou la version de l’éditeur.
For the publisher’s version, please access the DOI link below./ Pour consulter la version de l’éditeur, utilisez le lien DOI ci-dessous.
https://doi.org/10.1061/(ASCE)0887-3801(2008)22:6(360)
Access and use of this website and the material on it are subject to the Terms and Conditions set forth at Integrated decision support system for optimal renewal planning of sewer networks
Halfawy, M. R.; Dridi, L.; Baker, S.
https://publications-cnrc.canada.ca/fra/droits
L’accès à ce site Web et l’utilisation de son contenu sont assujettis aux conditions présentées dans le site LISEZ CES CONDITIONS ATTENTIVEMENT AVANT D’UTILISER CE SITE WEB.
NRC Publications Record / Notice d'Archives des publications de CNRC:
https://nrc-publications.canada.ca/eng/view/object/?id=304619cf-bb15-48af-b431-0c4ea0ee4f3b https://publications-cnrc.canada.ca/fra/voir/objet/?id=304619cf-bb15-48af-b431-0c4ea0ee4f3b
http://irc.nrc-cnrc.gc.ca
I n t e g r a t e d d e c i s i o n s u p p o r t s y s t e m f o r
o p t i m a l r e n e w a l p l a n n i n g o f s e w e r n e t w o r k s
N R C C - 5 0 0 9 5
H a l f a w y , M . R . ; D r i d i , L . ; B a k e r , S .2 0 0 8 - 1 0 - 2 8
A version of this document is published in / Une version de ce document se trouve dans:
Journal of Computing in Civil Engineering, v. 22, no. 6, Nov-Dec. 2008, .pp 360-372
The material in this document is covered by the provisions of the Copyright Act, by Canadian laws, policies, regulations and international agreements. Such provisions serve to identify the information source and, in specific instances, to prohibit reproduction of materials without written permission. For more information visit http://laws.justice.gc.ca/en/showtdm/cs/C-42
Les renseignements dans ce document sont protégés par la Loi sur le droit d'auteur, par les lois, les politiques et les règlements du Canada et des accords internationaux. Ces dispositions permettent d'identifier la source de l'information et, dans certains cas, d'interdire la copie de documents sans permission écrite. Pour obtenir de plus amples renseignements : http://lois.justice.gc.ca/fr/showtdm/cs/C-42
Integrated Decision Support System for Optimal Renewal Planning of Sewer Networks
Mahmoud Halfawy*, Leila Dridi*, and Samar Baker* Abstract
Municipalities are under increasing pressure to adopt proactive and optimized renewal strategies to reduce the risks, lifecycle costs, and resources needed to maintain acceptable performance and service levels of their infrastructure assets. A new integrated approach for optimal renewal planning of municipal infrastructure systems has been developed. This paper discusses the application of the proposed approach to implement a GIS-based Decision Support System (DSS) to support the renewal planning of sewer networks. Condition rating, risk assessment, and prioritization techniques are described. A procedure for identifying and selecting the most suitable renewal technologies is also presented. A genetic algorithm-based multi-objective optimization technique is used to find a Pareto front of feasible solutions, each comprising a set of sewers to be renewed each year, along with the associated costs and expected benefits in terms of condition improvement and risk reduction. The paper also presents an example application of the prototype DSS on the sewer network in Regina, Canada.
Keywords:
Sewer networks, asset management, renewal planning, optimization.
*
Centre for Sustainable Infrastructure Research, Institute for Research in Construction,
National Research Council of Canada, 6 Research Drive, Regina, SK S4S 7J7, Phone +1 306/780-5396, FAX +1 306/780-3421
Introduction
Municipal sewer networks are complex infrastructure systems that have significant impact on the economic, environmental, and social aspects of all modern societies. Sustainable management and renewal of these critical assets pose a wide range of challenges due to the increasing demand, deterioration of aging assets, climbing renewal deficits, new requirements to comply with stricter environmental and accounting regulations, and limited renewal budgets.
Municipalities across the world are moving towards adopting more proactive and optimized approaches to manage sewer assets and plan for their short and long term renewal in a more sustainable way. These approaches primarily aim to maximize the return on investment by optimizing budget allocation. Return on investment of such complex systems comprises elements such as high asset performance, low risk of failure, and low life-cycle costs. As these elements are inherently conflicting, an integrated multi-criteria approach is needed to develop renewal plans that satisfy these multi-criteria in a balanced and optimized manner.
The sewer renewal planning process remains fundamentally heuristic and subjective in nature, and is still largely considered as much an art as it is science. The process is mainly documented in the form of guidelines or manuals of best practices, e.g., WEF and ASCE (1994), WRc (2001), and InfraGuide (2004). However, the application of these guidelines varies significantly between different municipalities, and few or no standards have been defined for performing most of the activities involved. As a result, the renewal
planning has been typically performed in a manual and subjective manner, with limited or no software support.
A survey of commercial asset management software (Halfawy et al 2006a) concluded that the vast majority of existing systems focus primarily on managing day-to-day operational activities (e.g., issuing and tracking work orders, mapping and data management, logging service requests, cost estimating, etc.) and that commercial offerings of renewal planning software are scarce. This scarcity is mainly attributed to: the lack of systematized, standardized, and quantitative models (e.g., deterioration, risk, prioritization, and optimization models); and the lack of adequate reliable data sufficient to support the application of such models. However, with increasing infrastructure challenges (Vanier 2001), the need to systematize the renewal planning practices and to develop more consistent, standardized, and integrated renewal planning software solutions are now widely recognized.
This paper proposes a new step-wise integrated approach that could potentially assist municipal professionals in developing optimized plans that would identify the most appropriate compromise of renewal solutions while simultaneously optimizing the renewal costs, condition state, and risk of failure of the sewer network. The approach defines a systematic procedure to quantitatively assess and evaluate the costs and benefits of alternative renewal options, which helps reduce the subjectivity typically employed in the decision-making process. The implementation and example application of a GIS-based DSS are also presented.
Decision Support Systems for Renewal Planning of Sewer Networks
During the last decade, significant investment has been made in developing and deploying software tools to support various sewer renewal planning activities. The majority of these tools mainly supported two activities: CCTV inspection and condition rating, and hydraulic modeling. These tools are commonly used in municipalities. More advanced tools, which are less commonly used, implemented capabilities for deterioration modeling, prioritization, and capital planning activities. Examples of these tools include Harfan and RIVA, among others (Halfawy et al 2006a). Another software in this category, which is less common in North America, is AQUA-WertMin (AQUA-WertMin 2008). AQUA-(AQUA-WertMin uses a cohort survival function to model the sewer deterioration process (Baur and Herz 2002) for selective inspection planning, prediction of remaining service life, calculation of renewal costs, and investment planning. However, the use of these advanced tools is still rare. This may be attributed to the high cost and technical requirements for customizing and deploying these tools.
Many municipalities and consulting firms have also developed their own in-house renewal planning software to conform to their work practices and specific data and process requirements. Most of these tools were developed by customizing general-purpose tools such as spreadsheets, database management systems (DBMS), computer-aided design (CAD) systems, or geographic information systems (GIS). Examples of such tools include UMA’s sewer management system (SMS) (Homeniuk and Croft 2005). The SMS software mainly supports condition assessment and rating, rehabilitation
design, and maintenance management. Halfawy et al (2000) also reported the development of a GIS-based software that supported integrated management and assessment of sewer networks inventory, condition, and hydraulic data.
A significant number of decision models and software prototypes have been reported in the literature. Many studies have proposed models to predict and assess sewer deterioration rates, risk of failure, asset prioritization, and selection of possible rehabilitation options. The Computer-Aided Rehabilitation of Sewer Networks research project (CARE-S 2008) was an international collaborative effort to develop a comprehensive suite of tools to support renewal planning activities. Ariaratnam and MacLeod (2002) proposed a proactive rehabilitation infrastructure sewer management (PRISM) model that used linear programming to optimize allocation of funding for maintenance and repair of a sewer network. Abraham et al (1998) proposed an integrated sewer management system that used probabilistic Markovian deterioration models and deterministic dynamic programming to optimize the selection of sewer rehabilitation techniques. Fenner and Sweeting (1999) described a decision support model for rehabilitating non-critical sewers by using sewer performance and GIS data to rank variable sized grid squares into priority zones for rehabilitation action. Kleiner (2001) defined a semi-Markov process to model asset deterioration and a decision framework to optimize the scheduling of rehabilitation and inspection of large buried assets (e.g., trunk sewers). Fenner (2000) presented a review of several techniques employed in a number of countries for optimizing and prioritizing sewer rehabilitation strategies. Few studies proposed optimization models for sewer network renewal planning. DeMonsabert et al
(1999) proposed an integer programming model to determine optimal rehabilitation plans for sanitary sewers by analyzing the costs and benefits of reducing the amount of infiltration/inflow over a 20-year planning horizon. Abraham et al (1998) and Wirahadikusumah and Abraham (2003) described a dynamic programming technique to select sewer rehabilitation methods that would maximize the benefit/cost ratio (or minimize the total cost) over a planning horizon.
An Integrated Approach for Optimal Renewal Planning of Sewer Networks
The renewal planning decision-making is inherently an integrated process that requires the assimilation of a multitude of condition, risk, cost, and optimization models. The process involves several inter-dependent data-intensive activities, which include inspection and condition assessment, risk assessment, prediction of future condition, asset prioritization, selecting appropriate renewal technologies, and evaluating alternative renewal plans. Clearly, an effective renewal planning scheme would require addressing these various activities from an integrative perspective. The need to define and adopt new integrated approaches to infrastructure management, in general, is widely recognized in industry and academia (Lemer 1998; Grigg 1999; Halfawy et al 2002). The development of proactive and optimized renewal plans will depend, to a large extent, on our ability to fully integrate models, data, and processes in a unified and consistent framework.
A process model that systematizes the structure, organization, and information flow among various asset management and renewal planning processes was developed (Halfawy 2008). This model characterized key infrastructure management processes by
identifying the main activities involved and their interrelationships and information requirements. Based on this model, an integrated approach for optimal renewal planning of municipal infrastructure assets has been defined. The next section outlines the main elements of the proposed approach as it applies to sewer networks.
The Algorithm
The renewal planning problem can be defined as follows: what are the renewal actions (i.e., what assets to rehabilitate or replace, what methods to use, and when) for a specific planning horizon that would optimize the allocation of renewal budget by maximizing the network’s average condition and minimizing risk of failure, subject to condition, risk, and budget constraints. This problem is tackled by adopting a step-wise algorithm where multi-year plans are optimized on a year-by-year basis. A typical plan establishes, for a given year and for each sewer, the most appropriate and cost-effective renewal action, if any. A plan would be used to update the sewer condition and risk levels and to develop renewal plans for subsequent years. Figure 1 shows the flowchart of the proposed renewal planning algorithm. The algorithm proceeds in the following main steps.
{Insert Figure 1: Flow chart of the renewal planning algorithm}
The proposed approach generates renewal plans on a segment level (i.e. manhole to manhole). The algorithm starts by classifying and subdividing the network into a set of homogeneous groups in terms of their current condition and deterioration pattern as well as their criticality (or expected consequence of failure). Then, for each group, a renewal plan is developed for each planning period (e.g., one or more years increment). At the beginning of each planning period, sewer condition indices are re-evaluated using the
deterioration model, taking into consideration any renewal actions that have been planned in previous periods. The condition indices and deterioration models are used to estimate the remaining service life and the likelihood of failure index. The consequence of failure (or criticality) is then determined, which, together with the calculated likelihood of failure index, is used to estimate the sewer risk indices. Definition and calculation procedures of these indices are described in subsequent sections.
Based on the condition and risk indices, a list of sewers prioritized according to their urgency of intervention is prepared. For each sewer on the priority list, the most cost-effective feasible renewal actions are selected based on their technical and economic merits. The costs and benefits of these renewal actions are evaluated, and a set of feasible optimal renewal plans is generated using a multi-objective optimization model. The plans are further evaluated according to the budget constraints as well as their projected impact on the overall condition and risk levels. The decision-maker can carry out several iterations to evaluate alternatives and study the impact of various decision parameters until a renewal plan that meets all objectives and constraints is composed. The renewal plan is then applied in the form of delta tables to update the condition of the sewers for the following planning period. In multi-year planning scenarios, this process is repeated for every period in the planning horizon.
Obviously, the proposed step-wise approach would not result in globally optimum solutions over the planning horizon. Formulation of the renewal planning problem to find globally optimum solutions while considering multiple objectives (e.g., condition, risk,
and cost) and a wide range of possible renewal options may be quite challenging, if at all possible, due to the enormous depth and breadth of the underlying search space. To the authors’ knowledge, such a formulation has yet to be defined. Most of the existing formulations typically considered fewer parameters (e.g., time to replace to minimize lifecycle costs). In this study, the step-wise optimization approach was adopted to simplify the formulation and implementation of the DSS, while simultaneously considering multiple objectives and various renewal options.
Asset Grouping
Forming homogeneous groups of sewers that are assumed to exhibit similar characteristics serves two purposes: reducing the data requirements and expediting the planning process. For example, the condition of a sewer that lacks inspection data can be assumed to be similar to other inspected sewers in the same group that are assumed to have similar condition and deterioration characteristics. Also, criticality can be easily assessed for a group of sewers that have similar risk characteristics, without the need to do this assessment for each individual sewer.
The purpose of a renewal planning activity generally determines the level of detail needed for asset grouping and data requirements. Network-level or long-term planning typically considers groups of homogeneous assets that are assumed to exhibit similar characteristics. It also requires data only for a “representative” set of assets in the group. Project-level or short-term planning requires more details about individual assets. To provide greater flexibility in defining sewer condition and risk parameters, the proposed
approach also allows overriding group values for specific sewers. For example, a critical sewer that may have more frequent inspections and adequate historical data to define its own deterioration model or have specific risk attributes, can be considered individually in the planning process. This flexibility would allow decision makers to define asset groups at appropriate levels of granularity to balance the data requirements and availability with the scope and purpose of the planning process.
Sewer grouping can be performed on the basis of condition and deterioration patterns (condition groups), or sewer criticality (risk groups). Condition groups are defined based on sewer age, material, and diameter. Sewer depth and type of surrounding soil may also be considered. Sewers within one condition group are assumed to deteriorate at the same rate, and thus, a deterioration model can be defined for each group. The condition data of the sewers within the group will be considered collectively to define this deterioration model. On the other hand, risk groups are defined based on a set of criticality criteria, which may include sewer type, function, diameter, depth, soil, etc.
Condition Assessment and Deterioration Modeling
CCTV and condition rating software are commonly used in many municipalities. Most software tools support standard defect classification and scoring systems and condition assessment protocols such as those defined by the Water Research center (WRc), the Pipeline Assessment and Certification Program (PACP), or the North American Association of Pipeline Inspectors (NAAPI). The proposed approach adopts the WRc system, which rates sewers on a scale from 1 (excellent) to 5 (collapsed or collapse is
imminent). A sewer condition index (or rating) is primarily used for estimating the remaining service life and the probability of failure, or to guide inspection planning (Baur and Herz 2002).
Deterioration (or predictive) models are used to predict the rate of deterioration and the condition of the sewer at any time in the future. Deterioration models are mostly defined using statistical methods (deterministic or probabilistic) based on historical condition data. The reliability of deterioration models depends largely on the quantity and quality of available historical condition data. A deterministic model assumes that sewers deteriorate at a deterministic rate, while probabilistic models express sewer deterioration in terms of likelihood to be at a given condition, thus accounting for uncertainties such as those related to the impact of environmental factors. Commonly used techniques to model sewer deterioration include regression models (Newton and Vanier 2005), Bayesian models (Fenner and Sweeting 1998), fuzzy set models (Kleiner et al 2006) and Markov chain models (Kathula et al 2000, Kleiner 2001).
Defining deterioration models requires large amounts of historical condition data, which are typically unavailable in most municipalities. The proposed approach enables the definition of deterioration models in a manner consistent with the amount of available data. A set of predefined deterioration curves, mostly reported in the literature, is used as reference models. For any particular sewer or sewer group, if adequate condition data are not available, the decision maker can evaluate the suitability and fit of these curves to the specific sewer or sewer group. If a suitable curve is found, this curve can be used or
calibrated to reasonably reflect the deterioration pattern of the sewers and their available condition data, if any. However, if adequate data are available, regression analysis can be performed to fit a new curve, which can be appended to the library for later use. As more reliable data become available, more realistic probabilistic models can be defined to replace these deterministic models. The expertise and judgment of a decision maker would balance the requirement for more condition data with the purpose and scope of the renewal plan.
Risk Assessment Model
Assessing the risk of failure is essential for prioritizing sewers for renewal (as well as for inspection scheduling and performance monitoring). The risk of failure is typically measured based on the consequences of failure (rehabilitation/remediation costs, social and environmental costs) multiplied by the probability of failure. Existing approaches, e.g., ASCE (1994) and WRc (2001), typically categorize sewers based on their criticality. However, there is no standard risk assessment or rating scheme for sewers, and the data required for quantitative assessment of the two risk components may not be readily available. As a result, risk assessment is typically performed in a subjective and heuristic manner.
The proposed approach defines a simple model to assist decision makers in evaluating the “relative” risk of failure of sewers, and in using this information to prioritize sewers for renewal. The approach defines a risk index that ranges between 5 (most critical) and 1 (least critical). A risk index of “1” would be equivalent to a risk category “C” in WEF
and ASCE (1994) and WRc (2001) manuals, while an index of “5” would be equivalent to a risk category “A.” The risk index is calculated by multiplying two components representing the consequence and likelihood of failure. Instead of using a monetary value, a “risk factor,” which is also measured on a 1-5 scale, is used to reflect the relative criticality (or consequence of failure) of a sewer. The risk factor is calculated as a weighted average of the criticality level perceived for user-defined criticality criteria. The criteria may include all or a subset of factors such as sewer type, function, diameter, depth, soil, site seismicity, land use, road classification, traffic volume, proximity to critical assets, and overall socio-economic impact. A decision maker would assign weights and ratings for these criteria for a particular sewer or a group of sewers. The likelihood of failure index, on the other hand, is calculated as the ratio between the sewer current age and its remaining service life, as predicted by the deterioration model. Equations for risk assessment can be summarized as follows:
I N I I
w
F
Factor
Risk
_
*
1∑
==
(1) rviceLife ExpectedSe CurrentAge Failure Of Likelihood_ _ = (2) Failure Of Likelihood Factor Risk Index Risk_ = _ * _ _ (3)Where: N = number of criticality criteria considered; FI = assigned rating for criterion I;
Asset Prioritization Criteria
A prioritization scheme helps identify a set of assets where renewal options need to be considered to achieve the maximum return on renewal investment in terms of improving the overall network condition and reducing the risk of failure. Asset prioritization generally uses information about asset condition and/or risk levels to rank the assets according to the urgency of intervention. Some prioritization guidelines were proposed in the literature. McDonald and Zhao (2001) defined a prioritization scheme based on asset condition and criticality. InfraGuide (2003b) proposed the use of a weighted multi-attribute system to calculate an asset priority index based on a number of factors that include condition, risk, expected level of service, and the possibility to coordinate the work with other infrastructure programs or to obtain funding assistance from higher level governments. Our approach adopts a modified version of the scheme defined in McDonald and Zhao (2001).
The proposed approach uses sewer condition and risk indices as the main criteria for determining the priority of intervention. A “priority index” is defined for each sewer to indicate the level of urgency for intervention. The priority index ranges from “5” (need immediate intervention) to “1” (no action required). Different sets of rules, similar to those proposed in McDonald and Zhao (2001), can be customized to assess the priority index for a particular sewer or group of sewers, given its condition and risk indexes. Sewers or groups having certain priority level are selected for further renewal planning and optimization.
Selection of Feasible Renewal Methods
Sewer renewal technologies are advancing rapidly and becoming more efficient and cost-effective. The use of trenchless methods has been increasing in many municipalities. Detailed discussion of conventional open-cut and trenchless methods can be found in numerous references, e.g., Najafi (2004), Montero et al (2002), WRc (2001). Different renewal methods exhibit different capabilities, limitations, costs, and benefits. The specific characteristics of the sewer (e.g., material, diameter, etc.) and site conditions (e.g., soil, water table, traffic, etc.), along with other operational, social, and environmental factors would typically determine the applicability and feasibility of different renewal methods in a particular situation. In any given scenario, some renewal methods are more suitable and cost-effective than others, and therefore, a systematic procedure for selecting feasible methods is needed.
Several procedures and guidelines for selecting appropriate renewal methods have been proposed in the literature. A comprehensive literature review was conducted to compare and harmonize these procedures to develop a more comprehensive and systematic approach for evaluating the applicability, cost, and benefit of various renewal methods in any given scenario. Due to the rapid changes in the technologies, only the literature after 2000 was considered. Six main references were studied in detail: Matthews and Allouche (2006), Baur et al (2003), InfraGuide (2003a), Plenker (2002), Diab and Morad (2001), and Shehab-Eldeen and Moselhi (2001). The proposed approach complements these earlier studies by considering a wide range of renewal methods and proposing some new criteria for selecting feasible renewal methods.
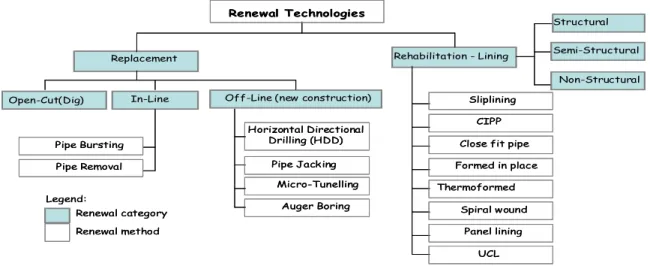
The renewal methods were grouped into four main categories: replacement (conventional open cut or trenchless methods, with same or larger diameter), and structural, semi-structural, or non-structural lining methods. Each renewal category includes a number of renewal methods. Figure 2 shows the renewal categories and methods considered in this study. Structural liners are defined to be capable of carrying hydrostatic, soil and live loads on their own. Structural liners are expected to be independent (i.e., bond with original sewer is not required), and are typically designed according to the WRc Type II design (WRc 2001) or the ASTM fully deteriorated design for gravity pipelines (Najafi 2004). Semi-structural liners are designed to withstand hydrostatic pressure, or work as a composite with the existing pipe. Semi-structural liners can be designed as interactive or independent according to WRc Type I, WRc Type II, or ASTM partially deteriorated design for gravity pipelines. Semi-structural liners are typically not used for gravity pipelines. Among the reviewed literature, only InfraGuide (2003a) discussed the use of semi-structural liners, though, there is no clear definition of their characteristics or design requirements. Non-structural liners are used mainly to improve flow, resist corrosion, or to seal minor cracks in gravity sewers (Heavens 2008).
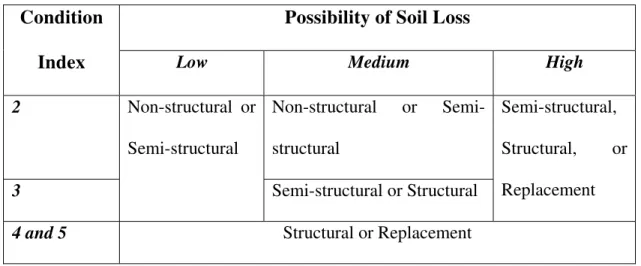
The proposed selection procedure starts by identifying applicable renewal categories based on the sewer condition index and the possibility of surrounding soil loss. The possibility of surrounding soil loss is assessed on a high, medium, low scale, according to the soil type and the ground water level (WRc 2001), as shown in Table 1. Applicable renewal categories are selected based on the criteria defined in Table 2. These criteria
were defined based on detailed analysis of possible defects, as indicated by the condition index, and the possible scenarios of soil loss. For example, a sewer with condition index “3” and “high” possibility of soil loss will need replacement or the use of a structural liner to carry loads and stabilize deformation. At a minimum, a semi-structural liner that can withstand hydrostatic pressure is required. However, an end user can override these criteria based on local expertise or best practices available.
{Insert Figure 2: Classification of the sewer renewal methods}
Ground Water Level (WL)
Soil Type WL below
sewer
WL same line with sewer
WL above sewer
Clay soil Low Medium High
Gravels and low plasticity clay soil
Low Medium High
Silt and sand soil High High High
Table 1. Possibility of soil loss based on soil type and ground water level
Once renewal categories are determined, the renewal methods that are capable of providing each category are further evaluated in terms of their “applicability.” The applicability criteria are mainly determined by the technology limitations (e.g., soil type, sewer type, existing defects, or the diameter and material of the existing or desired sewer), site characteristics (e.g., work area requirements, ground water level), or other social or environmental criteria. The applicability criteria are examined for each sewer to determine whether a renewal method is applicable.
Possibility of Soil Loss Condition
Index Low Medium High
2 Non-structural or Semi-structural 3 Non-structural or Semi-structural Semi-structural or Structural Semi-structural, Structural, or Replacement
4 and 5 Structural or Replacement
Table 2: Selection of renewal categories based on condition index and soil loss possibility The expected cost and benefit of each applicable method are estimated and used to optimize the selection of the methods with the best cost/benefit ratio. Accurate assessment of the benefits should consider the post-rehabilitation impact of a renewal method or category on various defects, and modify the defect scoring and condition rating calculations accordingly. To date, there is no established way to accurately calculate expected sewer condition improvements. Clearly, the development and validation of such a model would require significant pre- and post-rehabilitation data, which are not generally available. Abraham et al (1998) estimated the condition improvement in terms of extension of the sewer service life (e.g., shotcrete extends the service life by 20 years, while CIPP extends it by 50 years). Similarly, the proposed approach estimates benefits in terms of condition improvement (or recovery) by deducting certain values from the current condition index. Condition improvement values are estimated for each renewal category or renewal methods. Default values of 0.5, 1.0, and 2.0 are assumed for non-structural, semi-structural, and structural lining, respectively, while replacement restores the condition index to “1.0” by default. These
default values can be overridden for a particular method as it is applied to a specific sewer or group of sewers.
In assessing the costs of renewal methods, all relevant costs (direct, indirect, social, and environmental costs) need to be considered. In this study, unit costs (cost per unit diameter per unit length) for various renewal methods were estimated based on a literature review of available cost data. Six main sources for that data were studied: Ariaratnam et al (1999), USEPA (1999), Selvakumar et al. (2002), Zhao and Rajani (2002), Garcia et al (2002), and Najafi (2004). These studies reported costs using different units (mm/m and in/ft), different currency (US and Canadian Dollar), and at different years (1999-2002). Therefore, the collected data had to be adjusted to establish approximate unit costs for each renewal method. Also, costs were not available for all renewal methods and in many cases costs of different methods were aggregated under different groupings. For example, USEPA (1999) considered close fit pipe methods and thermoformed pipe methods under modified cross section lining and provided a cost range for the group. Also, Zhao and Rajani (2002) provided cost for relining without explicitly defining the relining method. These costs are assumed to include all lining methods except CIPP and sliplining, where specific costs were provided.
Also, reported costs were approximated to define method-specific cost ranges for different sewer condition states and renewal categories. For example, if the reported cost of a renewal method ranges between $0.5 and $1.5 per mm/m, we assumed that the non-structural liner for condition “2” would cost $0.5, while a non-structural liner for condition
“4” or “5” will cost $1.5. The increase of renewal costs with the deterioration of sewer condition grades has been reported in several studies (e.g., Macey 2001). Also, InfraGuide (2004) reported that the City of Winnipeg estimated that the cost to rehabilitate a condition “5” sewer is three times higher than the cost of rehabilitating a condition “3” sewer. In the same manner, the cost of a structural liner is expected to be higher than that of a semi- or non-structural liner, due to extra design, testing, and material costs. These unit costs can be used as default values, especially where accurate and specific data are not available, for performing order-of-magnitude estimates for comparative assessment of alternative technologies. The default costs could also be modified by a decision maker based on more accurate estimates, actual project experience, or specific site conditions.
Since the break down of total costs into direct and indirect cost components was not given in the reported costs, these costs were assumed to include both cost components. For more accurate cost estimates, social and environmental costs could also be estimated and added to the cost assessment of renewal options. A lifecycle cost component can also be estimated as the expected yearly maintenance cost throughout the service life of the sewer discounted to the analysis year. However, the scope and purpose of the renewal plan would determine the level of accuracy required for the cost estimates. While project-level or short-term planning would require more accurate assessment of direct, social, environmental, and lifecycle costs, network-level or long-term planning could be reasonably conducted using approximate total cost figures such as those compiled or estimated from the literature.
Genetic Algorithm-Based Multi-Objective Optimization of Renewal Options
Once the cost and benefit of feasible renewal methods are determined, the renewal trade-offs can be further evaluated and optimized. As a typical multi-objective optimization problem (Kyle et al 2002), there is no single solution (or renewal plan) that could simultaneously optimize all these conflicting objectives. Instead, a set of solutions (or a Pareto front) are obtained that trade-off the renewal costs against the improvement in sewer condition, and hence the reduction of the probability of failure and the risk of failure. These solutions are considered optimal since they are superior to (or dominate) all other possible solutions. However, only a subset of these optimal solutions would be considered “feasible,” given the budget constraints and minimum acceptable condition and risk levels in the sewer network.
A multi-objective optimization (MOO) model was formulated and solved using a genetic algorithm (GA) technique to find Pareto fronts and identify a set of feasible renewal solutions. Each solution recommends a set of sewers for renewal actions, along with the associated costs and expected benefits in terms of condition improvement and risk reduction. The preference for one solution over the others depends on the budget available and the corresponding improvement in the overall network condition and risk levels. A decision maker can evaluate the trade-offs and relationship between budget, condition, and risk levels to select the most feasible renewal plans for given scenarios.
The proposed formulation incorporates three key objectives: minimization of the average condition measure of the network, minimization of the average risk measure of the network; and minimization of total lifecycle cost. The formulation can be mathematically described as follows:
Average condition index:
∑
∑
∑
+ = = ≠= + pipes J I i i pipes I i pipes J j i j j new j i i l l CI l CI Minimize ( ) 1 1 1 (4)Average risk index:
∑
∑
∑
+ = = ≠= + pipes J I i i pipes I i pipes J j i j j new j i i l l RI l RI Minimize ( ) 1 1 1 (5)Total cost of sewer system:
∑
(6)= pipes J j j jl cleCost otalLifecy Minimize 1 T ⎩ ⎨ ⎧ = = − = t replacemen action if CI tion rehabilita action if CI rehab Cimprov CI CIjnew j j min ) , ( (7) j new j xRI RI = (8) Subject to: limit index Condition level index Condition Average ≤ (9) limit index Risk level index Risk Average ≤ (10) j limit index Condition ≤ new j CI (11) j limit index Risk ≤ new j RI (12) limit Budget cost lifecycle Total ≤ (13)
Where CI and RI are the condition index and risk index of the sewer before the renewal action; CI new, RI new are the condition index and risk index of the sewer after the renewal
action; Cimprov (rehab, CI) is the improvement factor for condition index when a specified rehabilitation method is used for the selected sewer; CImin is the improvement
when replacement is used as the renewal action; is the sewer length; I+J is the total number of sewers in the network; x is the percentage of reducing the risk (i.e., the ratio between the probability of failure index before and after the renewal action). Average
condition index level is the length-weighted-average of condition indices of the entire network (or group); Condition index limit represents the minimum acceptable average condition state; Average risk index level is the length-weighted-average of risk indices of the entire network (or group); Risk index limit represents the maximum tolerable average risk index; Condition index limitj represents the minimum acceptable condition state for
sewer j; Risk index limitj represents the maximum tolerable risk index for sewer j; Total
Lifecycle Cost is the lifecycle cost of the entire network (or group) and budget limit is the maximum budget level. Based on the criticality of a particular sewer, the user can set the acceptable minimum condition index and/or maximum risk index.
l
Given the enormous size and combinatorial nature of the solution space and the complexity of the defined objectives and constraints, GA techniques seemed to be appropriate and robust search techniques (Gen and Cheng 2000). Goldberg (1989) attributed the robustness of GA to the following: (1) they work with a coding of potential solutions, not the solutions themselves; (2) they search the solution space from a population of points and not a single point; (3) they work directly with the objective
function, requiring no additional knowledge about its derivatives or any other auxiliary information; and (4) they direct their search by probabilistic, not deterministic, rules.
Several MOO GA have been developed (Coello 2005). The first generation of these algorithms have adopted “niching” or fitness sharing. Examples include the niched Pareto genetic algorithm (NPGA) (Horn et al 1994) and the non-dominated sorting genetic algorithm, (NSGA) (Srinivas and Deb 1994). The second generation introduced the notion of “elitism” either by using an external population to retain the non-dominated individuals, as in the strength Pareto evolutionary algorithm (SPEA) (Zitzler and Thiele 1999), or by combining the best parents with the best offspring, as in the NSGA-II algorithm (Deb et al 2002). A subsequent version of the earlier NSGA algorithm, NSGA-II is used to solve MOO problems in several domains (Deb et al 2002), including applications in the design of water distribution networks (Keedwell and Khu 2003; Farmani et al 2005).
Many studies reported the use of GA-based MOO techniques to solve renewal planning problems for infrastructure systems such as pavements (Cheu et al 2004) and bridge decks (Morcous and Lounis 2005, Lee and Kim 2006). Several studies also addressed the renewal planning of water distribution networks. Examples include Halhal et al (1997), Dandy and Engelhardt (2006), Dridi (2006), and Alvisi and Franchini (2006). The criteria used in the optimization generally depended on the water network considered and have differed from one study to another. Decision variables generally included the pipes that needed renewal action and the optimal time to execute these actions. Renewal costs,
network reliability and hydraulic performance (i.e. node pressure) were the most important criteria considered in these studies.
Studies on the applications of GA-based optimization in sewer network management are scarce in the literature. Rauch and Harremoes (1999) proposed the use of GA in hydraulic modeling of sewer systems. Boomgaard et al (2002) attributed the low success rate of sewer systems optimization studies to the “lack of appropriate tools.” They proposed a GA-based stepwise approach to minimize the total direct cost required to enlarge the capacity of a sewer system (including storage, pumping, pressurized interceptor sewers, and wastewater treatment plant) subject to a maximum annual overflow volume constraint.
The GA approach proposed in the paper employs the NSGA-II algorithm (described in detail in Deb et al 2002) to solve the MOO renewal planning problem. A binary encoding was developed to represent each renewal plan (or solution) as a string of bits. A decision variable, or a gene, was defined for each sewer in the network, to define the renewal method applied to that particular sewer. The number of possible renewal methods determines the length of the gene. For example, if four renewal options are considered (e.g., do-nothing, replace, major rehabilitation, or minor rehabilitation), a gene of two bits is required to represent all four possibilities for a particular sewer (i.e., 00, 10, 01, and 11). Accordingly, the length of a bit string representing a potential renewal plan (or a chromosome) for a network of n sewers will be 2n.
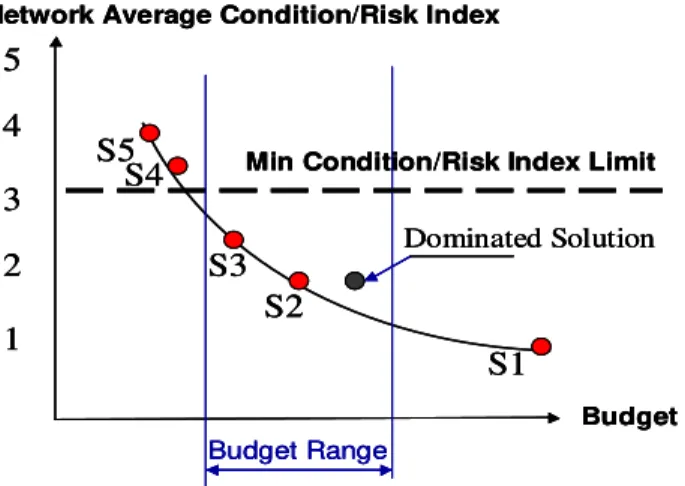
Solutions generated by the algorithm are further examined, and only those satisfying the budget, condition, and risk constraints are selected. Figure 3 shows a typical Pareto front and a set of solutions generated by the GA. In some cases where no solutions can be found, the constraints should be revised to consider more solutions on the Pareto front. However, the solutions calculated on the Pareto front should be used to guide a more detailed investigation and sensitivity analysis of the various feasible renewal plans.
{Insert Figure 3: Multi-objective optimization of renewal plans (S2 & S3 are feasible plans)}
Renewal Planning DSS Implementation
During the past two years, an integrated and modular sewer management software environment has been under development in collaboration with the City of Regina, Saskatchewan, Canada. More details about the data and process models and software architecture can be found in (Halfawy 2008). The software environment aims to support various processes conducted by different functional groups within a typical municipal sewer department. Several applications have already been developed and integrated into the environment. Examples include inventory data analysis, query, and reporting, inspection and condition assessment, and hydraulic modeling. This section describes the implementation of the sewer renewal planning application based on the proposed approach. This application has been recently integrated into the sewer management environment.
The renewal planning DSS application was implemented as set of loosely coupled modules, each addressing one stage of the renewal planning process outlined above (Figure 4). Each module was implemented as an add-on to ESRI ArcGIS software using the ArcObjects class library (ESRI 2001). The GA MOO module was implemented using the Open BEAGLE C++ class library (Open BEAGLE 2008). The modular architecture of the application will accommodate future enhancement and extension of the application, e.g. implementing more sophisticated deterioration or risk models.
{Insert Figure 4. Architecture of the renewal planning DSS}
Sewer renewal planning requires access to a multitude of data about the network inventory, condition, risk criteria, renewal methods, etc. The sheer size and complex inter-dependencies of the data pose many data management and process coordination challenges. Efficient representation, integration, management, and sharing of these data sets can be efficiently supported through the use of a centralized integrated data repository (Halfawy and Figueroa 2006c). The use of an integrated data repository can achieve the following benefits:
1. Improve data collection, organization, and availability.
2. Leverage the use of GIS data by linking various lifecycle data to it. 3. Enable data sharing and interoperability of various software applications.
4. Enable data reusability and eliminate redundancy and possible inconsistencies in collecting, validating, entering, and storing the data.
5. Streamline the renewal planning activities by enabling efficient data flows among users and software systems supporting these activities.
An object-oriented integrated data model for sanitary and storm sewers was developed (Halfawy et al 2006b, Halfawy 2008). The data model defined classes that represented spatial, inventory, inspection, condition, risk, and renewal data. The data model also defined attributes to represent the proximity and inter-dependencies with other co-located assets such as road segments and water mains. This information can be used to assess sewer criticality or to coordinate renewal actions. An integrated data model enables various activities to share common semantics and representation of the data, and hence, improves data availability and consistency across these activities (Halfawy et al 2002). The data model was defined using the Unified Modeling Language (UML) notation and was based on ESRI water utilities spatial data models (ESRI 2008). The UML data model was used to generate the database tables, fields, and data types based on ESRI geodatabase object-relational schema. The centralized integrated data repository was implemented using Oracle relational DBMS and the ArcSDE software (Halfawy and Figueroa 2006c). Accessing the data repository through a unified GIS interface significantly enhances the ability to explore, access, query, and edit data.
The DSS was designed to enable the user to control the level of asset granularity desired based on the quantity and quality of the available data and on the specific planning scenarios and requirements (e.g., long-term or short-term). For example, a particular group and all its associated deterioration and risk models, prioritization rules, and renewal methods data may span a large group of sewers or a single sewer segment. The flexibility would enable a system user to balance the data requirements and planning objectives to optimize the time and effort needed to collect and input data. For example,
in face of inadequate and/or unreliable data, the user may depend on the assumption of the homogeneity of assets within the same group and use a deterioration curve that approximates the average deterioration rate for the entire group. This assumption may be satisfactory for most long-term or network level planning scenarios. However, short-term or project-level planning will typically have more data requirements in order to consider the specific characteristics and differences between individual sewers within a group. In general, the user is always allowed to input approximate values for missing data or override values calculated or suggested by the system.
The DSS was also designed to allow customization to the specific needs and practices of a particular municipality. All data and settings that can be considered as municipality-specific (e.g., prioritization rules, criticality factors and weights, costs of renewal methods, etc.) were not hard-coded into the software and were stored in an external database. For example, information about various renewal methods is stored in a database that can be edited and customized to the specific practices and data available in a particular municipality.
Example System Use
The prototype DSS was used to develop renewal plans for a sewer network in the City of Regina. The City has an inventory of approximately 860 km (534.06 miles) of sanitary sewers and 755 km (468.86 miles) of storm sewers. The network was subdivided into a set of homogeneous groups. This section describes an example case study that was performed during 2006 to develop a renewal plan for year 2008 for one of these groups,
using actual data as recorded in the City database. The group was defined to include vitrified clay sanitary sewers, with 200 mm (8 inches) diameter, and constructed between 1950 and 1955. This group included 249 sewer segments with a total length of 19.86 km (12.33 miles). Only 39 sewers in this group were previously inspected and rated (total length 3.4 km). The condition indices as recorded in the database were found to vary significantly, 2 sewers in condition state 1 (0.1 km), 17 in condition state 2 (1.5 km), 9 in condition state 3 (0.8 km), and 11 in condition state 4 (1 km). Based on these values, an average condition index for the un-inspected sewers is assumed to be 3 at the average age of 52 years. Given that condition data were only available for a small subset of the sewers, the user may at this point decide to perform CCTV inspection of the most critical sewers in the group to verify or revise the assumption. Figure 5 shows the interface for group definition and deterioration modeling.
{Insert Figure 5: Definition of condition groups and deterioration models}
Fitting a deterioration curve to the set of the condition data points can then be performed. By analyzing data collected from several Canadian municipalities, a set of deterioration curves was developed by Newton and Vanier (2005). These curves were defined for sanitary sewers based on the condition data for approximately 3,400 km (2111.4 miles) of sewers. A database of these models was created and used to check if any previously defined curves approximately fit condition data for a particular group. If a sewer has two or more inspection records, a deterioration curve could be defined specifically for that sewer. However, in actual practice, adequate condition data to define deterioration curves for individual sewer segments are not available, and approximation and judgment are typically used to compensate for the data inadequacy. In this example, a deterioration
curve from the library was visually found to reasonably fit the data points. The equation for that selected curve is:
1 * 0203 . 0 * 001 . 0 2− + = Age Age ndex ConditionI (14)
The selected deterioration curve indicates an expected service life of 75 years. The curve also indicates that, on average, the condition index of a typical sewer in the group may reach 3 at the age of 55, which concurs with the general assumption previously made in estimating the condition index for the sewers that lacked inspection records.
Subsequently, the deterioration curve is used to estimate the condition index of the sewers in a target year (e.g., 2008). Although the deterioration curve indicates the average rate of sewer deterioration, individual sewers within the same group may exhibit different condition states at similar ages, which is evident in this particular group. For example, at age 42, some sewers were found to be in condition state 2, 3, or 4. Therefore, the prediction of future condition of a sewer segment should take into account the specific condition data of that segment, if any are available. For example, the sewer that has a condition state 2 at age 42 would approximately reach condition state 5 at age 75, while a sewer that has a condition state 4 at age 42 would reach state 5 by age 50. Once the sewers condition indices for the target year are predicted using the deterioration model, the remaining service life and probability of failure can be established. The remaining service life is estimated as the number of years until a sewer reaches condition state 5, and the likelihood of failure index is the ratio between the sewer age at the target year and its estimated service life (i.e., its age when it reaches condition state 5).
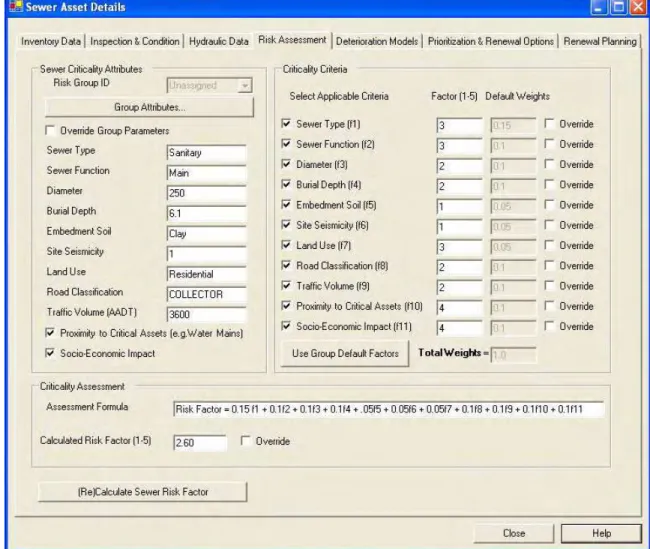
Next, the sewer risk indices are calculated. To simplify this calculation, sewers can be grouped according to their criticality criteria. Applicable criticality criteria can be selected and weights and ratings assigned. The risk factor, which indicates the “level of criticality” (or consequence of failure), can then be calculated. Risk factors can be calculated for an entire “risk group” or for individual sewers. Figure 6 shows the risk factor calculation dialog for one of the sewers. The risk indices are subsequently calculated by multiplying risk factors by the likelihood of failure indices calculated at the previous step. In this example, risk indices were found to range between 2.0 and 3.5.
{Insert Figure 6: User interface for calculating risk factors for a sewer segment} Once condition and risk indices are determined for all sewers in the group, prioritization rules are applied to establish the “priority index” for each sewer. For the 249 sewers in this group, 11 sewers were found to need immediate intervention (priority index =5), no sewers with high priority (index = 4), 8 sewers with medium priority (index = 3), 230 sewers with low priority (index = 2), and no sewers were found to need no renewal action (index = 1). Sewers with priority index of 3, 4, and 5 are then considered for possible renewal actions.
The renewal methods selection procedure starts by identifying the applicable renewal category for each sewer, and retrieving the methods within these categories from the renewal technologies database. This database stores default information about renewal methods including their limitations (diameter range, soil type, pipe material, etc.), expected condition improvement, and cost. The default cost and improvement values are
specified for each condition grade, since these values would depend on the type and severity of the defects. The user can eliminate some renewal methods or override their default values as they apply to a particular sewer or sewer group. For each sewer in the group, the system will then evaluate the applicability of various renewal methods and calculate the costs and condition improvements for each feasible method. Since the cost and benefit estimates in this example were primarily used for comparative assessment of alternative renewal methods, the use of default cost and benefit values yielded reasonable results.
The GA-based MOO module identified the Pareto fronts for the two main optimization criteria: condition-cost and risk-cost criteria. In this example, the population size and the maximum number of generations were set to 200 and 500, respectively. The algorithm used a single point cross over, with probability of 0.50. The mutation probability was set to 0.50, and the bit mutation probability was set to 0.01. The algorithm used a tournament selection scheme, with tournament size of 4. Calculation of the Pareto fronts in this example required approximately 3 hours on a dual processor Pentium 4 (3.2 GHz) computer. The optimal solutions are further evaluated against the budget constraints as well as the minimum acceptable condition and risk levels ((i.e., weighted average) for the group. In this example, a budget scenario was given ($0.1-0.5 Million), and a total of 111 possible solutions were found to meet both condition and risk constraints. Figure 7 shows the cost-condition and cost-risk Pareto fronts between the minimum and maximum budget limits. Solutions are listed in order of their budget requirements, with the weighted-average condition and risk indices. For example, one solution (highlighted)
with a total budget of about $0.484M indicated that 11 sewers (with condition index of 5) would need to be replaced (total length = 0.95 km), while one sewer (with condition index of 3) will need to be lined (0.04 km). This solution would result in improving the average condition and risk indices of the group from 3.09 and 2.55 to 2.9 and 2.4, respectively. By changing the budget, condition, and risk constraints, a decision maker can evaluate the relationship between the sewer network average condition/risk levels and funding levels, and assess how different levels of funding would affect the overall network condition. Various scenarios can be evaluated until a “satisficing” solution is found.
{Insert Figure 7: Cost-condition and cost-risk Pareto fronts and sets of valid solutions}
Conclusion and Future Directions
Integrated sewer renewal planning DSS can play a critical role in improving planning and management of sewer networks. This paper presented a novel integrated approach for systematizing the sewer renewal planning process. The approach integrated the three main criteria in the planning process: condition, risk, and cost. It also incorporated simplified models to support such processes as deterioration modeling, risk assessment, asset prioritization, selection of appropriate renewal methods and cost/benefit assessment of alternative technologies, and multi-objective optimization of renewal options. The approach can be used to support short and long term planning scenarios, as well as network-level and project-level planning.
To efficiently implement the proposed algorithm, an integrated data model was developed. The data model supported the integration and management of sewer data, and enabled data sharing and exchange between various activities and software tools. A proof-of-concept GIS-based software was also developed and demonstrated. The results obtained from the system in numerous examples were found to be consistent with expectations and decisions possibly made by a professional asset manager.
In light of this study, some directions for future research can be identified. Substantial work still needs to be done to refine and extend the approach, fully develop the software, and perform more testing and validation using other sewer network data sets. An obvious extension is the use of sewer hydraulic performance, besides structural condition, in the prioritization, selection of renewal methods, and in the assessment of pre- and post-rehabilitation performance. Future work may also investigate the use of more sophisticated models (e.g., probabilistic deterioration or risk models) in lieu of the deterministic and simplified models employed in the system.
A modified version of the proposed approach has been developed to support renewal planning for water distribution networks. Our long-term research objective is to integrate the renewal planning processes for water, sewer, and road networks to optimize the overall allocation of funds across these spatially co-located assets within roadway corridors. The prototype will need to be extended to integrate and coordinate the renewal planning processes across these asset classes. Eventually, a comprehensive and fully integrated renewal planning software based on the proposed approach can be realized.
Acknowledgements
The authors thank the City of Regina Engineering and Works staff Loretta Gette, Ken Wiens, and Andrea Weston, for providing data and guidance throughout this project. Thanks are also due to David Hubble, Yehuda Kleiner, Dana Vanier, and Osama Hunaidi for their valuable feedback. The authors are grateful to the anonymous reviewers for their valuable suggestions to improve this paper.
References
Abraham, D., Wirahadikusumah, R., Short, T.J., and Shahbahrami, S. (1998). Optimization modeling for sewer network management, Journal of Construction Engineering and Management, ASCE, 124 (5), 402-410.
Alvisi, S. and Franchini, M. (2006). Near-optimal rehabilitation scheduling of water distribution systems based on a multi-objective genetic algorithm, Journal of Civil Engineering and Environmental Systems, Taylor and Francis, 23 (3), 143-160.
Ariaratnam S.T., Lueke J.S., and Allouche E.N., 1999. Utilization of trenchless construction methods by Canadian municipalities, Journal of Construction Engineering and Management, ASCE, 125 (2), 76-86.
Ariaratnam, S.T. and MacLeod, C.W. (2002). Financial outlay modeling for a local sewer rehabilitation strategy. Journal of Construction Engineering and Management, ASCE, 128 (6), 486-495.
AQUA-WertMin (2008). Expert office for sewer rehabilitation. <http://www.sewer-rehabilitation.com> (May 1, 2008).
Baur, R. and Herz, R. (2002). Selective inspection planning with ageing forecast for sewer types. Journal of Water Science & Technology, IWA Publishing, 46(6–7), 389– 396.
Baur, R., Herz R. and Kropp I. (2003). Procedure for choosing the right sewer rehabilitation technology, Computer aided rehabilitation of sewer Networks (CARE-S), Work package 6- Multi-criteria Decision Support, report D16.
Boomgaard, M., Langeveld, J., and Clemens, F. (2002). Optimization of wastewater systems: A stepwise approach. Proceedings of the 9th International Conference on Urban Drainage, Strecker, E.W. and Huber, W. C. (Ed.), ASCE/IWA/EWRI/IAHR, Sept. 8-13, Portland, Oregon, USA.
CARE-S. (2008). Computer aided rehabilitation of sewer networks, <http://care-s.unife.it/> (May 1, 2008).
Cheu, R.L., Wang, Y., and Fwa, T. F. (2004). Genetic algorithm-simulation methodology for pavement maintenance scheduling. Computer-aided civil and infrastructure engineering, Blackwell Publishing, 19, 446-455.
Coello, C. (2005). Evolutionary multi-objective optimization: a historical view of the field. IEEE Computational Intelligence Magazine, 1(1), 28-36.
Dandy, G. C. and Engelhardt, M.O. (2006). Multi-objective trade-Offs between cost and reliability in the replacement of water mains. Journal of Water Resources Planning and Management, ASCE, 132 (2), 79-88.
Deb K., Pratap A., Agarwal S., and Meyarivan T. (2002). A Fast and elitist multiobjective genetic algorithm: NSGA–II. IEEE Transactions on Evolutionary Computation, 6(2), 182–197.
DeMonsabert, S., Ong, C., and Thornton, P. (1999). An integer program for optimizing sanitary sewer rehabilitation over a planning horizon. Journal of Water Environment Research, Water Environment Federation 71(7), 1292-1297.
Diab, Y. and Morad, D. (2001). An approach for the choice of rehabilitation techniques of urban sewers. Proceedings of Pipelines 2001 conference, ASCE, Joseph P. Castronovo, (Ed.).
Dridi, L. (2006). “Développement et validation d’une approche de remplacement des conduites pour les réseaux d’eau potable.” Ph.D. thesis, Institut National de la Recherche Scientifique, Centre Eau Terre et Environnement, Québec, Canada (in French).
ESRI. (2001). Environmental Systems Research Institute, Exploring ArcObjects, Vol. 1 & 2, Redlands, California.
ESRI. (2008). Environmental Systems Research Institute Water Utilities ArcGIS Data Models. <http://support.esri.com/index.cfm?fa=downloads.dataModels.gateway> (May 1, 2008).
Farmani R., Walters G.A. and Savic D.A. (2005). Trade-off between total cost and reliability for Anytown water distribution network. Journal of water resources planning and management, ASCE, 131 (3), 161-171.
Fenner, R.A. and Sweeting, L. (1998). A Bayesian statistical model of sewer system performance using historical event data. Proceedings of the 6th international conference on hydraulics in civil engineering, September 27-30, Adelaide, Australia. Fenner, R.A. and Sweeting, L. (1999). A decision support model for the rehabilitation of
Fenner, R. A. (2000). Approaches to sewer maintenance: a review, Urban Water, Elsevier, 2 (4), 343-356.
Garcia C., Abraham D., Gokhlae S., and Iseley T. (2002). Rehabilitation alternatives for concrete and brick sewers. Practice Periodical on Structural Design and Construction, ASCE, 7 (4), 164-173.
Gen, M., and Cheng, R. (2000). Genetic algorithms and engineering optimization, John Wiley & Sons, Inc.
Grigg, Neil S. (1999). Infrastructure: Integrated issue or tower of Babel?. Journal of Infrastructure Systems, ASCE, 5(4), 115-117.
Goldberg, D.E., (1989). Genetic Algorithms in search, optimization and machine learning. Addison Wesley Longman, 412 p.
Halfawy, M.R., Pyzoha D., Young R., Abdel-Latif M., Miller R., Windham L. and Wiegand R. (2000). GIS-based sanitary sewer evaluation survey, 20th Annual ESRI International User Conference, Jun., San Diego, CA. <gis.esri.com/library/userconf/proc00/professional/papers/PAP158/p158.htm> (May 1, 2008).
Halfawy, M.R., David Pyzoha, and Taymour El-Hosseiny, (2002). An integrated framework for GIS-Based civil infrastructure management systems, Proceedings of the Canadian Society for Civil Engineers (CSCE) Conference, Montreal, Canada. Halfawy, M.R. (2008). Integration of Municipal infrastructure management processes:
challenges and solutions,” J. Comp. in Civ. Engrg., 22 (3), 216-229.
Halfawy, M.R., Newton, L., Vanier, D. (2006a). Review of commercial municipal infrastructure asset management systems, J. ITCON, 11, 211-224.
Halfawy, M.R., Vanier, D., Froese, T. (2006b). Standard data models for interoperability of municipal infrastructure asset management systems, Canadian Journal of Civil Engineering, 33(12), 1459-1469.
Halfawy, M.R. and Figueroa, R. (2006c). Developing enterprise GIS-based data repositories for municipal infrastructure asset management, Proceedings of Joint International Conference on Computing and Decision Making in Civil and Building Engineering, ICCCBE/ASCE/DMUCE/CIB, Montreal, Canada.
Halhal, D., Walters, G.A., Ouazar, D., and Savic, D.A. (1997). Water network rehabilitation with structured messy genetic algorithm. Journal of Water Resources Planning and Management, ASCE, 123(3), 137-146.
Heavens, J. W. (2008). The trenchless renovation of potable water pipelines. Insituform technologies, Inc. <http://www.insituform.com/mm/files/trenchless_renovation.pdf> (May 1, 2008).
Homeniuk, R. and Croft, B. (2005). Implementing an automated sewer management system in Winnipeg, Canada: A systems Perspective, AWWA/WEF Information Management Technology Conference, April 18-20, Denver, Colorado, USA.
Horn J., Nafpliotis N., and Goldberg D. E. (1994). A niched Pareto genetic algorithm for multiobjective optimization. Proceedings of the 1st IEEE Conference on Evolutionary Computation, IEEE World Congress on Computational Intelligence, volume1, 82–87, Piscataway, New Jersey.
InfraGuide. (2003a). Selection of technologies for sewer rehabilitation and replacement, National Guide to Sustainable Municipal Infrastructure, Ottawa, ON, Canada.
InfraGuide. (2003b). Investment parameters for municipal infrastructure. National Guide to Sustainable Municipal Infrastructure, Ottawa, ON, Canada.
InfraGuide. (2004). Assessment and evaluation of storm and wastewater collection systems. National Guide to Sustainable Municipal Infrastructure, Ottawa, ON, Canada.
Kathula, V., McKim, R., and Nassar, R. (2000). Prediction of sewer pipe performance using Markovian methods, Proceedings of North American NO-DIG '00, North American Society for Trenchless Technology (NASTT). Anaheim, CA, 97-105.
Keedwell E.C. and Khu S.T. (2003). More choices in water system design through hybrid optimization. Proceedings of the International Conference on Computing and Control for the Water Industry, London, Uk. Maksimovic C., Butler D. and Memon F. (Ed.), 257-264.
Kleiner, Y. (2001). Scheduling inspection and renewal of large infrastructure assets. Journal of Infrastructure systems, ASCE, 7 (4), 136-143.
Kleiner, Y., Rajani, B., and Sadiq, R. (2006). Sewerage infrastructure: Fuzzy techniques to model deterioration and manage failure risk. Proceedings of the NATO advanced research workshop on water reuse-risk assessment, Decision-Making and Environmental Security, Istanbul, Turkey, October 12, 241-252.
Kyle, B., Lounis, Z., and Vanier, D. (2002). Multi-objective optimization of asset maintenance management. Proc. of the 9th international conference on computing in civil and building engineering, April 3-5, Taipei, Taiwan.