Publisher’s version / Version de l'éditeur:
Vous avez des questions? Nous pouvons vous aider. Pour communiquer directement avec un auteur, consultez la première page de la revue dans laquelle son article a été publié afin de trouver ses coordonnées. Si vous n’arrivez pas à les repérer, communiquez avec nous à [email protected].
Questions? Contact the NRC Publications Archive team at
[email protected]. If you wish to email the authors directly, please see the first page of the publication for their contact information.
https://publications-cnrc.canada.ca/fra/droits
L’accès à ce site Web et l’utilisation de son contenu sont assujettis aux conditions présentées dans le site
LISEZ CES CONDITIONS ATTENTIVEMENT AVANT D’UTILISER CE SITE WEB.
Client Report (National Research Council of Canada. Construction), 2013-12-13
READ THESE TERMS AND CONDITIONS CAREFULLY BEFORE USING THIS WEBSITE.
https://nrc-publications.canada.ca/eng/copyright
NRC Publications Archive Record / Notice des Archives des publications du CNRC : https://nrc-publications.canada.ca/eng/view/object/?id=6907c027-88ca-4652-b2dd-6d567afdfed6 https://publications-cnrc.canada.ca/fra/voir/objet/?id=6907c027-88ca-4652-b2dd-6d567afdfed6
NRC Publications Archive
Archives des publications du CNRC
For the publisher’s version, please access the DOI link below./ Pour consulter la version de l’éditeur, utilisez le lien DOI ci-dessous.
https://doi.org/10.4224/23002867
Access and use of this website and the material on it are subject to the Terms and Conditions set forth at
High performance roofing and walls technologies: task 2, high
performance curtain walls and the NECB 2011
Construction
High Performance Roofing and Walls
Technologies
Task 2
— High Performance Curtain Walls and
the NECB 2011
Client Report: A1-002844-02
Steven M. Cornick
13 December, 2013
Table of Contents
Table of Contents ...i
List of Figures ... iii
List of Tables ... v Summary ... vii Acknowledgements ...ix 1. Introduction ... 1 2. Compliance Paths ... 2 2.1 General Requirements – § 3.1 ... 2 2.2 Prescriptive Path – § 3.2 ... 4 2.3 Trade-off Paths – § 3.3 ... 5
2.3.1 Simple trade-off path – Subsection 3.3.3 ... 7
2.3.2 Detailed trade-off (Subsection 3.3.4) ... 11
2.4 Performance Path (Part 8) § 3.4 ... 11
3 Implications for Curtain Wall Designs ... 11
List of Figures
Figure 1 – Energy Code Comparisons ... 2
Figure 2 – Schematic of the different compliance path for Part 3 – Building Envelope ... 4
Figure 3 – Prescriptive compliance path for Part 3 – Building Envelope ... 4
Figure 4 – Variation of FDWR with annual degree-days below 18°C ... 5
Figure 5 – A broader based application of FDWR limits based on 1000 HDD18 increments ... 6
Figure 6 – NBC 2010 Table C-2 locations with NECB climates zones overlain ... 7
Figure 7 – Simple trade-off compliance path for Part 3 – Building Envelope ... 8
Figure 8 – Detailed trade-off compliance path for Part 3 – Building Envelope ... 13
List of Tables
Table 1 – Overall Thermal Transmittance of Above-ground Opaque Building Assemblies ... 6 Table 2 – Simple example of trading-off fenestration area and U-value for Ottawa ON. ... 9 Table 3 – Simple example of trading-off fenestration area and U-value for Vancouver BC. ... 9
Summary
In 2012 the NRC-Construction initiated a project on the “High Performance Walls and Roofing
Technologies Next Generation Technologies R&D – Building Envelopes”. Partnership and funding for the project was obtained from NRCan (Housing and Buildings /Sustainable Building and Communities CANMET / Group) under the Program of Energy Research and Development (PERD).
In commercial buildings, curtain wall systems often cover a significant part of the building envelope, and therefore their impact on the overall thermal performance of the building is important. In order to evaluate, compare and improve curtain wall designs, one needs insights in the different calculation and evaluation methods, and state-of-the-art in thermal optimization in curtain wall design.
The overall objective of this project was to improve the thermal efficiency of commercial building envelopes. This was achieved by using different approaches to improve the overall effective R-values of the curtain wall systems. The project consisted of a number of Tasks in which curtain walls were evaluated and their performance compared, and suggestions made for improvement to the thermal performance of such systems; these Tasks include:
Task 1: Literature review on Curtain Walls
Task 2: Curtain Walls and National Energy Code for Buildings 2011 Task 3: Thermal Optimization in Curtain Walls: Part I - Modelling
Task 4: Thermal Testing and Optimization in Curtain Walls: Part II - Experiment Task 5: CFD Modelling of Curtain Walls
This report focuses on Task 2: Curtain Walls and National Energy Code for Buildings 2011. A cursory survey of a number of major curtain wall manufacturers located in Canada suggested that there should be no problem for the industry to meet the prescriptive requirements of the NECB. For vision glass, the maximum overall thermal transmittances of, respectively, 1.6 W/m2K for climate zone 8, and
2.4 W/m2K for climate zone 3, are within the range of currently available high performance commercial systems. The requirement for opaque potions may require thicker opaque portions than normally used. The required U-values range from 0.315 W/m2K (R18) to 0.183 W/m2
K (R31). Required insulation thicknesses for spandrel panels would range between 76 and 131 mm for climate zones 3 and 8
respectively using current insulation products. The spandrel thicknesses may become problematic when attempting to trade-off the vision glass area with increased spandrel panel U-value.
The challenge for the curtain wall industry comes when there is an interest in exceeding the maximum allowable fenestration and door to wall ratio. Ultimately this will require:
Triple, quadruple or multiple layers through the combination of glass and/or thin films with low emissivity and spectrally selective coatings and/or vacuum evacuated glazing;
Optimization for the vision glass areas; i.e. tailoring the vision glass to the orientation of the building to minimize heat losses or gains through the use energy simulation tools;
Significantly improved thermal break systems;
Significantly improved spandrel panels, potentially incorporating vacuum insulated panels; Double skin façades.
Better building optimization where the HVAC are better suited to high performance envelopes; elimination of perimeter zones for example can offset the cost of the envelope.
Acknowledgements
NRC wishes to acknowledge the partnership and funding for the project as provided by NRCan (Housing and Buildings /Sustainable Building and Communities CANMET / Group) under the Program of Energy Research and Development (PERD). More specifically, NRC acknowledges the close collaboration with NRCan and the Sustainable Building and Communities group of CANMMET, and in particular, the support provided by Dr. Anil Parekh in completing the work delivered in this project.
High Performance Roofing and Walls Technologies
–
Task 2
– High Performance Curtain Walls and the
National Energy Code for Buildings 2011
Authored by: Steven M. Cornick
A Report for the
Natural Resources Canada (NRCan)
Housing and Buildings
Sustainable Building and Communities CANMET / Group
ATT: Mr. Anil Parekh
National Research Council Canada Ottawa ON K1A 0R6 Canada
April 30, 2015
This report may not be reproduced in whole or in part without the written consent of both the client and the National Research Council of Canada
High Performance Roofing and Walls Technologies
Task 2 – High Performance Curtain Walls and theNational Energy Code for Buildings 2011
Final Report Task 2
Steven M. Cornick
1. Introduction
In November 2011 the National Energy Code for Buildings (NECB) [1] was released providing minimum requirements for the design and construction of energy efficient buildings. The code provides specific requirements with respect to the building envelope. The NECB applies to Part 5 buildings of the National Building Code of Canada (NBC) [2] and does not apply to farm buildings, houses, and smaller buildings covered in Part 9 NBC.
This report summarizes the requirements in the NECB Part3 with an emphasis on curtain wall assemblies. The scope of Part 3 includes heat and air transfer through materials, components, assemblies, and
interfaces that comprise the building envelope1,2 in buildings equipped with space-conditioning systems or having provision for such systems with an output capacity of
10 W/m2 or more.
The chart in Figure 1 shows the energy use reduction of various energy codes used in Canada. The chart is adapted from [3] and shows the estimated reduction in building energy use compared to the 1997 Model National Energy Code for Buildings (MNECB) [4]. It is immediately apparent from the figure that the current North American standards are significantly less stringent than their European counterparts. Most North American energy standards are based upon ASHRAE/ANSI Standard 90.1 [5] first published in 1975 as Standard 90.
The format of current standards is straight forward. The building is broken down into several
components: the building envelope, lighting equipment, HVAC equipment, service hot water equipment, and electrical equipment. For each of the major components a prescriptive path is provided. A trade-off path is also provided for each component where performance can be traded-off with similar components as long as the overall performance is not less than the prescriptive approach. Finally a performance path is also provided where a proposed design is compared to a prescription “reference building.” The designer is permitted to change most aspects of the “proposed building” as long the energy used by the proposed building is equal or less than the reference prescriptive building. Compliance along the performance path is demonstrated using computer simulation tools.
1
Italicized terms are defined in the NECB
2 Building envelope – the collection of components that separate conditioned space from unconditioned space at
TASK 2—HIGH PERFORMANCE CURTAIN WALLS AND THE NATIONAL ENERGY CODE FOR BUILDINGS 2011
REPORT A1-000030.04 2
Figure 1 – Energy Code Comparisons (adapted from Construction Canada, April 2012 54:3 p. 17
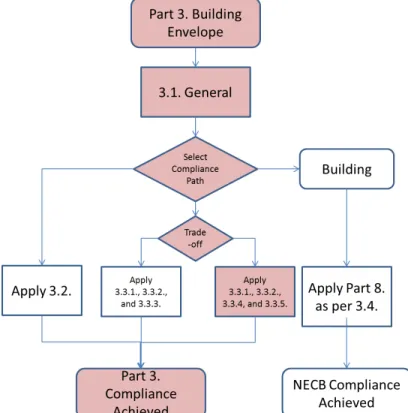
2. Compliance Paths
The NECB compliance path for building envelopes is shown Figure 2. This report will follow the compliance paths outlined in the Figure 2 starting with the prescriptive path found in Section 3.2, the simple trade-off path and detailed trade-off path described in Subsections 3.3.4 and 3.3.4 respectively, and finally the full performance path outlined in Section 3.4 of the NECB.
All paths in Part 3 must comply with the general requirements, i.e. all envelopes must comply with Section 3.1.
2.1 General Requirements – § 3.1
Regardless of the compliance path selected all envelopes must comply with Section 3.1 of the NECB. This section describes the various methods and standards that are to be used in determining the thermal characteristics of the building assemblies comprising the building envelope, specifically characteristics of materials, fenestration and doors, and assemblies other than fenestration and doors. The requirements are listed below.
For materials – use the product standards listed in NBC or ASTM C 177 or ASTM C 518, calculations and testing using the above are to be performed at 24°C ± 2°C with a T of 22°C ± 2°C
For fenestration and doors – Overall fenestration U-values to be determined from CSA
A440.2/A440.3 or NFRC 100 or ASHRAE HOF calculations or tests according to ASTM C1363 and are to be performed at 21°C ± 1°C with a temperature difference of
18°C ± 1°C
For other assemblies – By calculations or by laboratory tests according to ASTM C1363 to be performed at 24°C ± 1°C with a temperature difference of 22°C ± 1°C
The thermal performance of building assemblies can be also determined using computer simulation.
Section 3.1 also defines the Fenestration and Door to gross Wall area Ratio (FDWR) and how the ratio shall be calculated. Specifically the fenestration area shall be measured from the rough opening including frame and sash. With respect to curtain walls there is no rough opening per-se. Non-planar surfaces are to be measured along the surface of the glass. Parapets, projecting fins, ornamentation, and appendages are not included in the gross wall area. The majority of the section describes what is to be included or, conversely, not included in the gross wall and fenestration and door areas. With respect to curtain wall design Article 3.1.1.6 is the most important. This article provides details on how to calculate the fenestration and door areas as well as the gross wall area. The calculation of the overall thermal
transmittance (U-value) and how the intersections of various structural member types within the building envelope are handled is described in Article 3.1.1.7.
TASK 2—HIGH PERFORMANCE CURTAIN WALLS AND THE NATIONAL ENERGY CODE FOR BUILDINGS 2011
REPORT A1-000030.04 4
Figure 2 – Schematic of the different compliance path for Part 3 – Building Envelope
2.2 Prescriptive Path
– § 3.2
The prescriptive path is shown in Figure 3. Following this path the FDWR, skylight area, and the thermal characteristics of the building envelope assemblies are limited to maximum values. Maximum overall thermal transmittance values for the building envelope components are specified. Compliance is
achieved if the prescriptive values are met or exceeded. This path is the simplest path to implement but is the most constrained.
Figure 3 – Prescriptive compliance path for Part 3 – Building Envelope
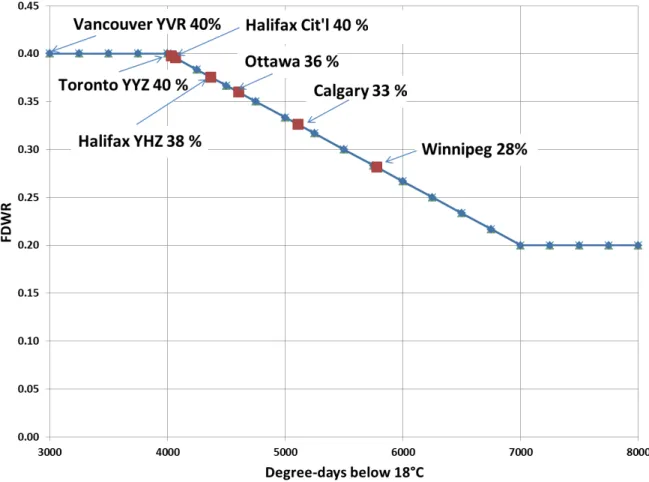
The first significant article with respect to curtain walls in this section is Article 3.2.1.4 “Allowable Fenestration and Door Area.” The FDWR is the ratio of the fenestration and door area to gross wall area as defined in § 3.1.1.6. The article states that the allowable FDWR is dependent on the annual degree-days below 18°C (HDD18). The maximum values of the FDWR, and hence the glazing or vision glass area, are:
FDWR = 0.40 for HDD18 < 4000 HDD18
FDWR ≤ (2000 – 0.2* HDD18)/3000 for 4000 ≤ HDD18 ≤ 7000 FDWR = 0.20 for HDD18 > 7000
Graphically this is shown in Figure 4 with representative cites plotted to provide points of reference of possible interest. Note that the FDWR formula produces extremely fine-grained limits for values of
FDWR. A possible remedy would be to define broader zones to simplify the design process as shown in Figure 5.
Figure 4 – Variation of FDWR with annual degree-days below 18°C
The most important articles that relate to curtain walls are Articles 3.2.2.2 and 3.2.2.3. These are summarized Table 1. The distribution of climate zones in Canada is shown in Figure 6.
2.3 Trade-off Paths – § 3.3
There are two trade-off paths in the NECB: the simple trade-off path and the detailed trade-off path. Regardless of the path considered there are general limitations that must be considered. Any benefits used for trading-off must be quantifiable, and the benefits must not depend on occupant interaction. Benefits due to construction techniques cannot be used in trade-off calculations. For example a designer cannot trade-off air leakage for U-value.
Key to the trade-off approach and performance is the definition of the “reference building.” The “reference building” is defined as a building whose building envelope is designed in accordance with Section 3.2 – Prescriptive Path. The energy consumption of the “reference building” constitutes the energy budget for the trade-off calculations.
TASK 2—HIGH PERFORMANCE CURTAIN WALLS AND THE NATIONAL ENERGY CODE FOR BUILDINGS 2011
REPORT A1-000030.04 6
Figure 5 – A broader based application of FDWR limits based on 1000 HDD18 increments
Table 1 – Overall Thermal Transmittance of Above-ground Opaque Building Assemblies Forming Part of Sentences3.2.2.2.(1) and(2) and 3.2.2.3.(1) and (2)
Walls Fenestration Overall U-value Effective RSI Overall U-value Effective RSI H DD1 8 ≥ 7000 Zone 8 0.183 5.46 1.6 0.63 ≥ 6000 Zone 7B 0.21 4.76 2.2 0.45 ≥ 5000 Zone 7A 0.21 4.76 2.2 0.45 ≥ 4000 Zone 6 0.247 4.05 2.2 0.45 ≥ 3000 Zone 5 0.278 3.6 2.2 0.45 ≥ 2000 Zone 4 0.315 3.17 2.4 0.42
40%
35% or 30%
30%
20%
Figure 6 – NBC 2010 Table C-2 locations with NECB climates zones overlain 2.3.1 Simple trade-off path – Subsection 3.3.3
The simple trade-off path is shown in Figure 7. Simple trade-offs apply only to variations in the overall U-value of above ground assemblies and to the allowable FDWR provided that the energy use of the “proposed building” is less than or equal to the energy budget of the “reference building.” An important limitation of the simple trade-off path is that like elements can only be traded-off against like elements; i.e. vertical elements for vertical and horizontal for horizontal elements. The simple trade-off calculation is done using the following equation:
∑ ������≤ ∑ ��� � �=1 � �=1 ��� Where:
n = number of above ground assemblies Uix = Overall U-value of assembly i in building x Aix = Area of assembly i in building x
x = p for proposed building or r for reference building
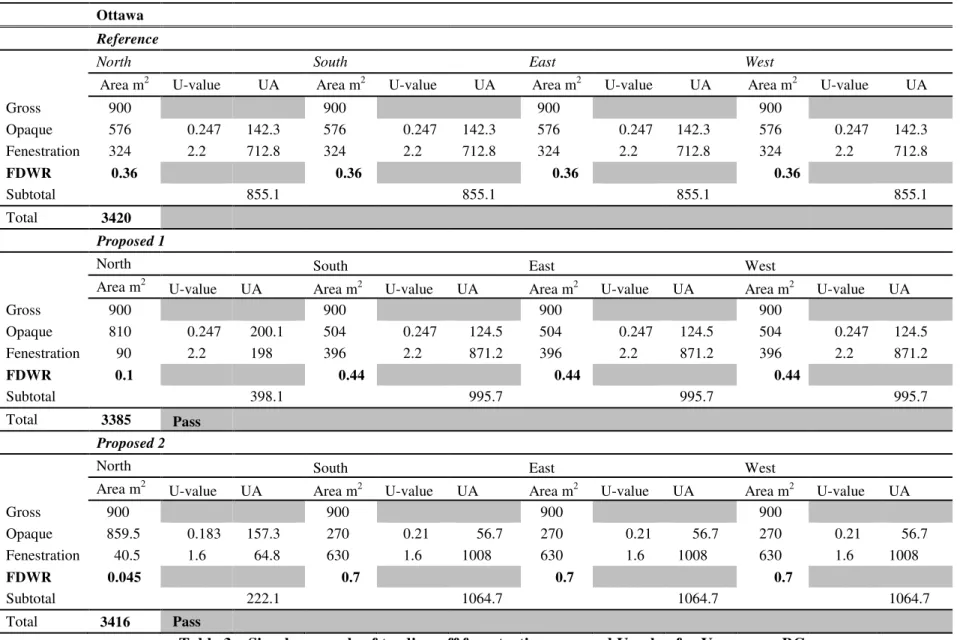
The simple trade-off procedure can be implemented using typical spread sheet applications. For example, Ottawa is in thermal zone 6. The prescribed maximum overall wall U-value is 0.247 W/(m2K), the maximum overall fenestration U-value is 2.2 W/(m2K), and the maximum allowable FDWR is 0.36. Types of possible trade-offs are shown in Table 2. The “reference building” is shown in the top portion
TASK 2—HIGH PERFORMANCE CURTAIN WALLS AND THE NATIONAL ENERGY CODE FOR BUILDINGS 2011
REPORT A1-000030.04 8
of the Table. Proposal 1 shows how the FDWR on one façade can be traded-off to increase the FDWR on other façades. Proposal 2 shows how the trade-off procedure can be used to produce façades with up to 70% fenestration and door area by varying the FDWR and overall U-value of the components on different façades.
Table 3 shows how similar trade-offs can be made in Vancouver which is in thermal Zone 3. In Vancouver the prescribed maximum overall wall U-value is 0.315 W/(m2K), the maximum overall fenestration U-value is 2.4 W/(m2K), and the maximum allowable FDWR is 0.40.
With respect to simple trade-offs several points are relevant: like must be traded-off with like, e.g. windows cannot be traded-off for increased roof insulation. Similarly, since the trade-off is expressed only in terms of the product of U-value and envelope area, UA, no credits (or penalties) accrue due to solar gains or orientation.
Table 2 – Simple example of trading-off fenestration area and U-value for Ottawa ON.
Table 3 – Simple example of trading-off fenestration area and U-value for Vancouver BC
Ottawa
Reference
North South East West
Area m2 U-value UA Area m2 U-value UA Area m2 U-value UA Area m2 U-value UA Gross 900 900 900 900 Opaque 576 0.247 142.3 576 0.247 142.3 576 0.247 142.3 576 0.247 142.3 Fenestration 324 2.2 712.8 324 2.2 712.8 324 2.2 712.8 324 2.2 712.8 FDWR 0.36 0.36 0.36 0.36 Subtotal 855.1 855.1 855.1 855.1 Total 3420 Proposed 1
North South East West Area m2 U-value UA Area m2 U-value UA Area m2 U-value UA Area m2 U-value UA Gross 900 900 900 900 Opaque 810 0.247 200.1 504 0.247 124.5 504 0.247 124.5 504 0.247 124.5 Fenestration 90 2.2 198 396 2.2 871.2 396 2.2 871.2 396 2.2 871.2 FDWR 0.1 0.44 0.44 0.44 Subtotal 398.1 995.7 995.7 995.7 Total 3385 Pass Proposed 2
North South East West Area m2 U-value UA Area m2 U-value UA Area m2 U-value UA Area m2 U-value UA Gross 900 900 900 900 Opaque 859.5 0.183 157.3 270 0.21 56.7 270 0.21 56.7 270 0.21 56.7 Fenestration 40.5 1.6 64.8 630 1.6 1008 630 1.6 1008 630 1.6 1008 FDWR 0.045 0.7 0.7 0.7 Subtotal 222.1 1064.7 1064.7 1064.7 Total 3416 Pass
TASK 2—HIGH PERFORMANCE CURTAIN WALLS AND THE NATIONAL ENERGY CODE FOR BUILDINGS 2011
Vancouver
Reference
North South East West Area m2 U-value UA Area m2 U-value UA Area m2 U-value UA Area m2 U-value UA Gross 900 900 900 900 Opaque 540 0.315 170.1 540 0.315 170.1 540 0.315 170.1 540 0.315 170.1 Fenestration 360 2.4 864 360 2.4 864 360 2.4 864 360 2.4 864 FDWR 0.4 0.4 0.4 0.4 Subtotal 1034.1 1034.1 1034.1 1034.1 Total 4136 Proposed 1
North South East West Area m2 U-value UA Area m2 U-value UA Area m2 U-value UA Area m2 U-value UA Gross 900 900 900 900 Opaque 810 0.278 225.2 450 0.278 125.1 450 0.278 125.1 450 0.278 125.1 Fenestration 90 2.4 216 450 2.4 1080 450 2.4 1080 450 2.4 1080 FDWR 0.1 0.5 0.5 0.5 Subtotal 441.2 1205.1 1205.1 1205.1 Total 4056 Pass Proposed 2
North South East West Area m2 U-value UA Area m2 U-value UA Area m2 U-value UA Area m2 U-value UA Gross 900 900 900 900 Opaque 810.9 0.183 148.4 540 0.21 113.4 270 0.21 56.7 270 0.21 56.7 Fenestration 89.1 2.2 196.0 360 2.2 792 630 2.2 1386 630 2.2 1386 FDWR 0.099 0.4 0.7 0.7 Subtotal 344.4 905.4 1442.7 1442.7 Total 4135 Pass
2.3.2 Detailed trade-off (Subsection 3.3.4)
The detailed trade-off path is shown in Figure 8. The procedure is similar to the simple trade-off in that a model “reference building” conforming to the prescriptive requirements is used to obtain a reference energy budget. The energy budget of the model of the “proposed building” is compared to the “reference building” and if the budget of the model of the “proposed building” is less than the “reference building” model, the “proposed building” complies with Part 3 of the NECB 2011. The difference between the simple and detailed path is that an energy simulation program is used to determine the energy budgets. The energy simulation program used for estimating the energy consumption must comply with
ANSI/ASHRAE 140 [6]. The FDWR is set to the maximum allowable value in the “reference building” model for this path. Lighting, plug-loads, occupancy and schedules, and mechanical equipment are not included as input parameters for both building models. All energies related to ventilation air, heating cooling, (de)-humidification, as well as fan energy energies for exhaust air are not included as part of the detailed trade-off path.
The major differences between the simple path and detailed apart from the calculation procedure are: The simulations take orientation into account; i.e. there is a credit or penalty of solar gains; Building thermal mass is accounted for;
Credit is given for skylights even if there are no skylights in the original design.
2.4 Performance Path (Part 8) § 3.4
The performance path, shown in Figure 9 is essentially the same as the detailed compliance path except that instead of ignoring the mechanical systems, lighting and internal loads, and occupancy in both building models, the “proposed building” model is fully flexible; i.e., all the components, not simply the envelope, can varied whereas the “reference building” model remains fixed. There is one important caveat from a building envelope perspective: no credit is given for improved air leakage over the reference building (8.4.4.4.(6)).
3 Implications for Curtain Wall Designs
What are the implications of the NECB for curtain wall design? A cursory survey of a few major curtain wall manufacturers indicates that there should be no problem for the industry to meet the prescriptive requirements of the NECB. The much more stringent energy codes in Europe have not been an obstacle to the curtain wall industry there and in fact these codes have stimulated much innovation in products and design.
For vision glass, the NECB requires a maximum U-value of 1.6 W/m2K for climate zone 8
(≥ 7000 DD). This is within the range of multilayer, low-emissivity, argon-filled glazing solutions for center of glass measurements. At the warmer end of the scale, climate zone 3, the requirement for 2.4 W/m2K can be met by most manufactures. It should be noted however that these requirements are for overall transmittance and hence the overall transmittance must include the window frame. Manufacturers
TASK 2—HIGH PERFORMANCE CURTAIN WALLS AND THE NATIONAL ENERGY CODE FOR BUILDINGS 2011
REPORT A1-000030.04 12
information on high performance systems indicate that overall system U-values can be as low as 1.14 W/m2K for an off the shelf triple glazed system3
.
The requirement for opaque potions may be problematic even from the prescriptive perspective. The required U-values range from 0.315 W/m2K (R18) to 0.183 W/m2
K (R31). This may lead to
significantly thicker spandrel panels. Typical insulating technologies such as spray foam or closed cell rigid polystyrene give spandrel thickness between 76 and 131 mm for climate zones 3 and 8 respectively. The spandrel thickness may become problematic when attempting to trade-off vision glass area with increased spandrel panel U-value.
The challenge for the curtain wall industry comes when it is desired to exceed the maximum allowable FDWR. Ultimately this will require:
Triple, quadruple or multiple layers through the combination of glass and thin films with low emissivity and spectrally selective coatings or vacuum evacuated glazing4 [7,8,9,10];
Optimization for the vision glass areas; i.e. tailoring the vision glass to the orientation of the building to minimize heat losses or gains through the use energy simulation tools;
Significantly improved thermal break systems [11];
Significantly improved spandrel panels, potentially incorporating vacuum insulated panels [12,13,14,15];
Double skin façades [16];
Better building optimization where the HVAC systems are better suited to high performance envelopes; for example, elimination of perimeter zones can offset the cost of the high performance envelope;
On site renewable energy, e.g. solar energy; note that no credit is given for onsite renewable in the current NECB
3
Calculated as per NFRC 100
4
Note that evacuated glazing, VG units, can significantly improve the acoustical performance of curtain wall systems
Figure 8 – Detailed trade-off compliance path for Part 3 – Building Envelope
TASK 2—HIGH PERFORMANCE CURTAIN WALLS AND THE NATIONAL ENERGY CODE FOR BUILDINGS 2011
REPORT A1-000030.04 14
4 References
[1] NRCC. National Energy Code of Canada for Buildings, National Research Council of Canada, Ottawa, ON (2011)
[2] NRCC. 2010. National Building Code of Canada, Associate Committee on the National Building Code, National Research Council of Canada, Ottawa, ON.
[3] McDonell, Geoff. “Curtain Walls and Energy Codes.” Construction Canada 54:3, April 2012, pp. 16-22
[4] NRCC. Model National Energy Code of Canada for Buildings, National Research Council of Canada, Ottawa, ON (1997
[5] ASHRAE 90. 1-2013, ASHRAE/IESNA Standard for Energy Efficient Design of New Buildings Except Low-Rise Residential, Atlanta, GA, 2013.
[6] ANSI/ASHRAE 140-2011. 2011. Standard Method of Test for the Evaluation of Building Energy Analysis Computer Programs. Atlanta, GA: American Society of Heating, Refrigerating, and Air-Conditioning Engineers.
[7] Fang, Yueping, Trevor Hyde, and Neil Hewitt. "A review of vacuum glazing and electrochromic vacuum glazing."Proceeding of Low Carbon Earth Summit (LCES2011) Dalian China(2011): 338-338.
[8] Baetens, Ruben, Bjørn Petter Jelle, and Arild Gustavsen. "Aerogel insulation for building applications: A state-of-the-art review."Energy and Buildings43.4 (2011): 761-769.
[9] Jelle, Bjørn Petter, et al. "Fenestration of today and tomorrow: A state-of-the-art review and future research opportunities."Solar Energy Materials and Solar Cells96 (2012): 1-28.
[10] Yuanqi, Wang, Wang Lei, and Li Jiding. "Improvement of Vacuum Glazing Technology and Its Potential Applications."Chinese Journal of Vacuum Science and Technology12 (2012): 020. [11] Elliott Marie. A Thermal Modelling Comparison of Typical Curtain Wall Systems,
http://www4.dowcorning.com/content/publishedlit/qb_a_thermal_modelling_comparison_of_typica l_curtain_wall_systems_1.pdf
[12] Baetens, Ruben, et al. "Vacuum insulation panels for building applications: A review and beyond."Energy and Buildings42.2 (2010): 147-172.
[13] Alam, M., H. Singh, and M. C. Limbachiya. "Vacuum insulation panels (VIPs) for building construction industry–a review of the contemporary developments and future directions."Applied energy88.11 (2011): 3592-3602.
[14] Zimmermann, Mark, and Hans Bertschinger. "High performance thermal insulation systems, Vacuum Insulated Products (VIP)." Proceedings of the International Conference and Workshop
held at EMPA Dübendorf. 2001.
[15] Carbary, Lawrence D., et al. "High Performance Curtain Wall Using Vacuum Insulated Panel (VIP) Spandrels." http://www4.dowcorning.com/content/publishedlit/63-1230.pdf