ASSESSMENT OF THORIUM BLANKETS
FOR FAST BREEDER REACTORS
by
P.J. Wood and M.J.
July,
Driscoll
1973
Department of Nuclear Engineering Massachusetts Institute of Technology
Cambridge, Massachusetts 02139
AEC Research and Development Report UC-34 Physics
Contract AT(11-1)-2250 U.S. Atomic Energy Commission
Cambridge, Massachusetts
ASSESSMENT OF THORIUM BLANKETS FOR FAST BREEDER REACTORS
by
P. J. Wood and M. J. Driscoll
July, 1973
COO-2250-2 MITNE - 148
AEC Research and Development Report
UC-34 Physics Contract AT (11-1) - 2250
DISTRIBUTION
COO-2250-2 MITNE-148
AEC Research and Development Contract
AT (11-1) - 2250 UC-34 Physics
1-3. U.S. Atomic Energy Commission, Headquarters Division of Reactor Development and Technology Reactor Physics Branch
4, 5. U.S. Atomic Energy Commission Cambridge Office
6. Dr. Paul Greebler, Manager Nuclear Energy Division Breeder Reactor Department General Electric Company
310 DeGuigne Drive
Sunnyvale, California 94086
7. Dr. Harry Morewitz, Manager
LMFBR Physics and Safety Projects Atomics International
P. O. Box 309
Canoga Park, California 91305
8. Mr. Malcolm Dyos, Manager
Nuclear Development, LMFBR Project Westinghouse Electric Corporation Advanced Reactors Division
Waltz Mill Site P.O. Box 158
Madison, Pennsylvania 15663
9. Dr. Robert Avery, Director Reactor Physics Division Argonne National Laboratory 9700 South Cass Avenue Argonne, Illinois 60439
10. Dr. Charles A. Preskitt, Jr., Manager Atomic and Nuclear Department
Gulf Radiation Technology P.O. Box 608
ABSTRACT
An assessment of the neutronic, economic, and engineering aspects of the use of thorium in the radial and axial blankets of Liquid Metal Cooled Fast Breeder Reactors (LMFBR's) has been performed. While the breeding performance of a thorium blanketed system has been shown to be slightly inferior to that of a comparable uranium blanketed system in terms of fissile production rate, its economic performance is
signifi-cantly superior, as evidenced by up to a 30% reduction in fuel cycle costs for a 1000 MWe reactor arising from the added 1. 6 million dollars in annual income. This superiority, which arises from the projected high value of the product U-233 relative to fissile Pu in thermal spec-trum reactors, is expected to persist for approximately twenty years after LMFBR commercialization, and can, therefore, significantly en-hance the incentive for rapid acceptance and introduction of the breeder
into utility power systems.
Detailed cash flow analysis was shown to reduce to particularly simple expressions for the fuel cycle contribution to the total cost of power:
U-238 Blanketed System C = 0. 02173 P49 + 0.6203
Th-232 Blanketed System C = 0.07613 P4 9 - 0.04793 P23+ 0.6648 where
C = the fuel cycle contribution to the cost of power, mills/kw-hr, P4 9 = the price of fissile Pu, $/g, and
P23 = the price of U-233, $/g.
In addition, a universal economic parameter was developed to charac-terize blanket performance under a wide range of economic
environ-ments. Both of the above developments will greatly reduce the amount of work required for future economic studies.
Experimental studies with thorium and uranium foils irradiated in the M.I. T. Blanket Test Facility, Blanket Mockup No. 4 were
performed to check the cross section data used in the remainder of the study, and to assign an uncertainty band to the fissile material
production rate predictions.
Evaluation of the relevant physics parameters has shown that the reactor kinetics and dynamics characteristics (e. g. , neutron lifetime, delayed neutron fraction, and Doppler reactivity coefficients) of the two systems are the same within calculational uncertainties, while the thorium blanketed system requires approximately 4% more core fissile material and 9% more control poison than a corresponding uranium blanketed system. Radial power gradients and blanket assembly
average temporal power variations are somewhat greater for a thorium radial blanket. In-out shuffle blanket management has been shown to be the most desirable of those studies both from the economic (by a small margin) and from the thermal-hydraulic points of view.
It is concluded that LMFBR systems can be designed to accommo-date uranium and thorium blankets on an interchangeable basis, and that the thorium blanket deserves strong consideration as the reference design concept for LMFBR systems.
ACKNOWLEDGMENTS
The work described in this report has been performed primarily
by the principal author, P. J. Wood, who has submitted substantially the same report in partial fulfillment of the requirements for the
Sc.D. degree at M.I. T.
Financial support from the U.S. Atomic Energy Commission under
Contract AT(11-1)-2250 is gratefully acknowledged. The principal
author also wishes to express gratitude for the financial support
fur-nished him by the Westinghouse Electric Corporation, Power Systems,
Advanced Reactor Division, and for the recommendation and
encourage-ment of Dr. E.A. DeZubay, his supervisor at Westinghouse. Others at
Westinghouse who have provided significant advice and guidance during
this work include S. Ramchandran, G. H. Madden, R. K. Disney, R. B. Kidman, and R. W. Hardie.
The advice and assistance of A. Supple on the experimental work as
well as the helpful suggestions of V. A. Miethe on computational
prob-lems are gratefully acknowledged.
Computer calculations were carried out at the M.I. T. Information
Processing Center, and the Laboratory for Nuclear Science. Typing of
this manuscript has been very ably handled by Mrs. Mary Bosco and
Miss Linda Wildman.
Finally, the principal author wishes to thank his wife,
Lee Woodruff Wood, whose patience and good humor have made life
TABLE OF CONTENTS Page Abstract 3 Acknowledgments 5 Table of Contents 6 List of Figures 13 List of Tables 24 Chapter 1. Introduction 29 1.1 Foreword 29 1.2 Thorium Utilization 30 1. 2. 1 Systems Considered 30 1. 2. 2 Previous Studies 37
1.3 Outline of This Work 42
1. 3. 1 Preface 42
1.3.2 Methods and Models 44
1. 3. 3 Experimental Verification of Methods 44
1.3.4 Burnup Calculations 44
1.3.5 Economic Analysis 45
1.3.6 Comparison of System Performance 46
Chapter 2. Methods and Models 47
2.1 Introduction 47
2.2 Reference Geometry 47
2.3 Cross Section Preparation 50
2.4 Preliminary Physics Analysis 51
2.4. 1 Cross Section Group Collapse 51 2.4. 2 Transport Theory vs. Diffusion Theory 56
Page 2. 5 Burnup Analysis 59 2. 5. 1 Introduction 59 2. 5. 2 Burnup Method 63 2. 5. 2. 1 Reactivity Variations 63 2. 5. 2. 2 Core Enrichment 64 2. 5. 2. 3 Poison Concentration 67 2. 5. 3 Materials Included in the Burnup 70
2. 5. 3. 1 Introduction 70
2. 5. 3. 2 Fission Products 70 2. 5. 3. 3 Fissile Isotope Buildup 70
2. 5. 3. 4 U-232 Buildup 71
2. 5. 3. 5 Poison Material 72
2.6 Economics Model 73
2.6. 1 Model Characteristics 73
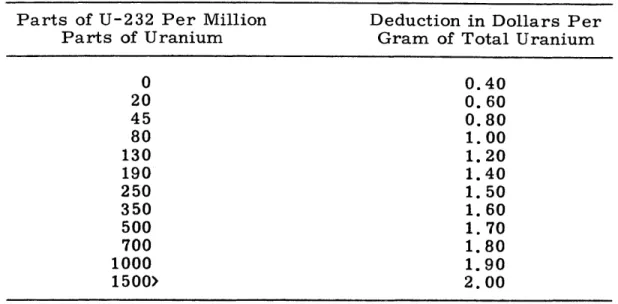
2. 6. 2 Penalty for U-232 73
2.7 Summary and Conclusions 74
Chapter 3. Experimental Evaluation 76
3. 1 Introduction 76
3.2 Description of Blanket Mockup No. 4 77
3.3 Experimental Aspects 82
3. 3. 1 Objectives 82
3. 3.2 Experimental Procedure 83
3. 3. 2. 1 Counting Technique 83
3. 3. 2. 2 Count Rate Normalization 84 3. 3. 2. 3 Sources of Experimental Error 92 3. 3. 3 Experimental Results and Numerical Predictions 96
3.3.3.1 Introduction 96
3. 3. 3. 2 Analysis of Experimental Error 97
3. 3. 3. 3 Thorium and Uranium Foil
Page
3. 3. 3. 4 Modification of Elastic
Downscatter Cross Section 105 3. 3. 3. 5 Diagnostic Experiments 117 3.4 Results of Other Experimenters 127
3. 5 Summary and Conclusions 128
Chapter 4. Burnup Calculations 133
4.1 Introduction 133
4.2 Initial Physics Analysis 134
4. 2. 1 Effect of Fissile Loading on keff 134 4.2. 2 Effect of Poison Concentration on keff 139 4. 2. 3 Initial Core and Blanket Loadings 139
4.2.4 One-Group Albedo Analysis 146
4. 2. 4. 1 Introduction 146
4. 2. 4. 2 Effect of Albedo on keff 147 4. 2.4. 3 Blanket Reflective Properties 149 4. 2. 4. 4 Blanket Reflective Performance 151 4. 3 Evaluation of Core Management 154
4.4 Blanket Batch Burnup 159
4.4.1 Introduction 159
4.4.2 Comparison of Blankets 160
4.4. 2. 1 System keff 160
4.4.2.2 Breeding Performance 162 4. 4. 2. 3 U-232 Production 177 4. 4. 2. 4 Core and Blanket Burnup 177 4. 4. 2. 5 Breeding Ratio 185 4.4. 3 Evaluation of Simplified Method 187 4. 5 Zone Scatter Blanket Management 193
4. 5. 1 Introduction 193
Page
4. 5. 2. 1 System k 195
4. 5. 2. 2 Blanket Inventories 198 4. 5. 2. 3 U-232 Buildup 208
4.5.2.4 Burnup Performance 210
4. 5. 3 Evaluation of Simplified Method 212
4.6 In-Out Shuffle Blanket Management 215
4.6. 1 Introduction 215
4.6. 2 Comparison: In-Out Shuffle vs.
Batch Management 219
4. 7 U-233/Th-232 Core and Blanket System 224
4. 7. 1 Introduction 224
4. 7. 2 Burnup Studies 226
4. 7. 2. 1 System Definition 226 4. 7. 2. 2 System Breeding Performance 230
4. 7. 2. 3 Summary 235
4.8 Summary and Conclusions 235
Chapter 5. Economic Analysis 237
5.1 Introduction 237
5.2 The Economic Environment 239
5.3 Core and Blanket Economics 244
5.3.1 Introduction 244
5. 3. 2 Effect of Core Management 244
5.3. 3 Batch Blanket Burnup 247
5. 3. 3. 1 General Considerations 247 5. 3. 3. 2 Core and Axial Blanket 249 5. 3. 3. 3 Radial Blanket Comparison 253
5. 3. 3. 4 U-232 Penalty 261
5. 3. 3. 5 Public vs. Private Utility 261 5. 3.4 Zone Scatter Blanket Management 266
5.3. 5 In-Out Shuffle Management 274 5. 3. 6 U-233/Th-232 System Economics 279
Page
5.4 Comparative Blanket Economics 281 5. 5 Correlation of Economic Optima 286
5. 5. 1 Development 286
5.5.2 Optimum Model 293
5. 5. 2. 1 Parametric Variations 293 5. 5. 2. 2 Batch Blanket Irradiation 295 5. 5. 2. 3 Managed Blankets 309 5. 5. 3 Break-Even Model 313 5.6 Effect of Uncertainties 316 5.6.1 Introduction 316 5.6.2 Physical Errors 318 5.6.3 Analytical Errors 321 5.6.4 Reprocessing Considerations 324 5.6.4.1 General Discussion 324
5.6.4.2 Reprocessing Losses and Delays 325
5.6. 5 Errors in the Analysis 327
5. 7 Summary and Conclusions 331
Chapter 6. Comparison of System Performance 334
6.1 Introduction 334
6.2 Shielding Comparison 335
6.3 Thermal Design Characteristics 337 6. 3. 1 General Thermophysical Properties 337 6. 3. 2 Blanket Heating Rate Contributions 340
6.3.2.1 Preface 340
6. 3. 2. 2 Fission and Neutron Heating 343 6. 3. 2. 3 Results of the Fission and
Neutron Heating Analysis 349 6. 3. 2.4 Gamma Heating Analysis 358 6. 3. 2. 5 Temporal Variations of Neutron
Page
6. 3. 3 Blanket Power Shape and Its Variation with Time 366
6. 3. 3. 1 Preface 366
6.3.3.2 Batch Irradiation 367
6.3.3.3 Zone Scatter Management 370
6. 3. 3.4 In-Out Shuffle Management 373
6.3. 3. 5 Comparison of Management Schemes 375
6.3.3.6 The Effect of Gamma and
Neutron Heating 381
6. 3. 4 Post-Shutdown Heating 386
6.3.4.1 General Discussion 386
6. 3.4. 2 Thorium Blanket Decay Heating 388
6. 3. 5 Sodium Activation 394
6. 4 Reactor Dynamics Comparison 395
6.4.1 Preface 395
6.4. 2 Sodium Void Reactivity 397
6. 4. 3 Doppler and Power Coefficients 397 6.4. 3. 1 Isothermal Doppler Coefficient 397
6. 4. 3. 2 Power Coefficient of Reactivity 400 6.4. 3. 3 Adiabatic Power Coefficient 402 6. 4. 3. 4 Core and Blanket Components 404 6.4.4 Neutron Lifetime and Delayed Neutron Fraction 405
6.4. 5 Control Requirements 407
6.4.6 Effect of Protactinium Decay 410
6. 5 Summary and Discussion of Blanket Interchangeability 411
Chapter 7. Summary and Conclusions 417
7.1 Introduction 417
7. 2 Physics -Depletion Analysis 419 7. 2. 1 Comparison of Blanket Breeding Performance 419
7. 3 Economic Analysis
7. 3. 1 Comparative Blanket Economics 7. 3. 2 Comparison of Management Schemes 7. 3. 3 Economic Model
7. 3. 4 Effect of Uncertainties
7.4 Engineering and Physics Comparisons 7.4. 1 Blanket Heating Characteristics 7.4. 2 Reactor Physics Characteristics 7. 4. 3 Blanket Inter changeability
7. 5 Recommendations for Future Work
Appendix A. Nomenclature Appendix B. 1 B. 2 Appendix C. 1 C. 2 C. 3 C. 4 C. 5 B. Cross Sections
Cross Sections for Burnup Analysis
Cross Sections for Gamma Heating Analysis
C. Economic Model Summary of Equations Nomenclature Input Instructions Sample Problem BRECON Listing Appendix D. References Page 431 431 437 440 443 444 444 446 448 450 453 467 467 470 491 491 497 500 506 514 538
LIST OF FIGURES
Fig. No. Page
1. 1 Marginal Value of U-233 and Fissile Plutonium 34 1. 2 U308 Price and Shadow Prices of Bred Fissile Materials 36 2. 1 Elevation Schematic View of the Upper Right Quadrant of
the Standard Reactor System 48
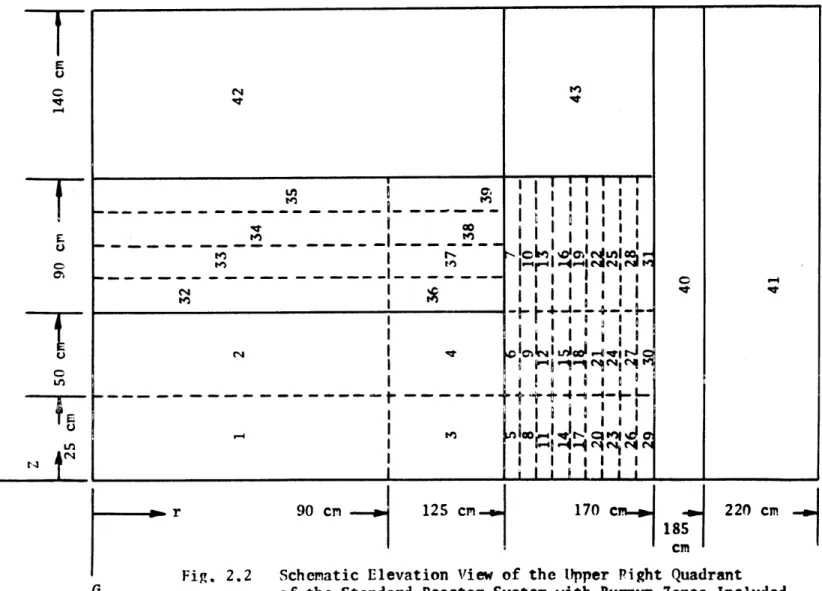
2. 2 Schematic Elevation View of the Upper Right Quadrant of
the Standard Reactor System with Burnup Zones Included 60
2. 3 Schematic Diagrams of System Reactivity Variations 65
3. 1 Schematic View of Blanket Assembly No. 4 78
3.2 Plan View of Blanket Assembly Showing the Traversing
Tube Positions 80
3. 3 Comparison of ABBN Fission Spectrum with Calculated
Spectrum in 6CH1 90
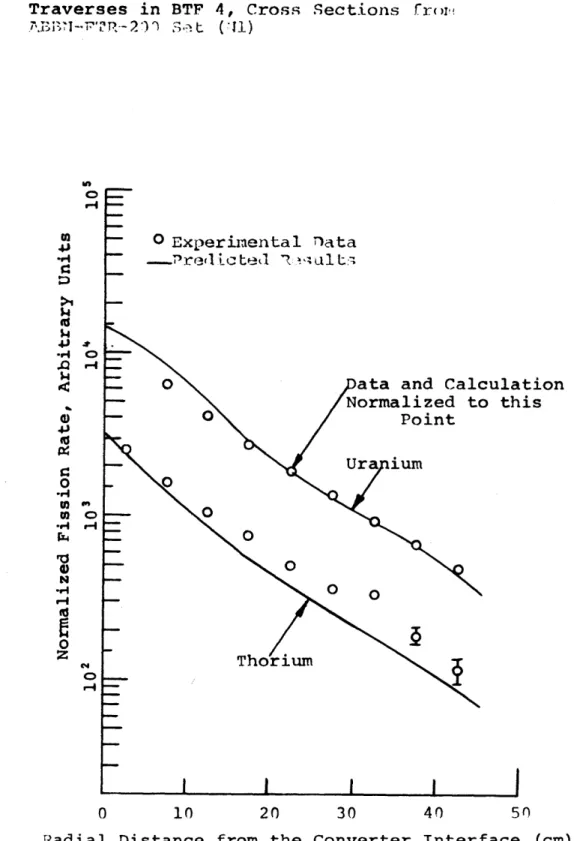
3.4 Comparison of Calculated and Experimental Fission Rates
for Thorium and Uranium Foil Traverses in BTF 4 100 3. 5 Comparison of Experimental and Predicted Fertile
Capture Rates of Thorium and Uranium Foils 101 3.6 Comparison of Calculated and Experimental Fission Rates
for Uranium Foils Irradiated Both In-Rod and Ex-Rod 103 3. 7 Comparison of Predicted and Experimental Capture Rates
for Uranium Foils Irradiated Both In-Rod and Ex-Rod 104
3.8 Integral Neutron Capture Rates for Thorium and Uranium
in Thorium and Uranium Radial Blankets 106 3.9 Comparison of Differential Capture Rates in Radial
Blankets 107
3. 10 Comparison of Experimental and Calculated Capture Rates in Thorium and Uranium, Fluxes Calculated Using Modified Elastic Downscatter Cross Sections
Generated by Assuming
4(U)
c E 1093. 11 Comparison of Calculated and Experimental Capture Rates in Thorium and Uranium Foils; Predictions Made
Fig. No. Page
3. 12 Renormalized Comparison of Experimental and Calculated Capture Rates in Thorium and Uranium Foils; Predictions
Made Using the 106-Group Modified ABBN Cross Section Set 113
3. 13 Comparison of Calculated Mid-Blanket Neutron Spectra
for Blanket Mockup No. 4 114
3. 14 Comparison of Calculated Integral Uranium Capture Rate
Distributions in Various Mid-Blanket Spectra 115 3. 15 Comparison of Calculated Integral Thorium Capture Rate
Distributions in Various Mid-Blanket Spectra 116 3. 16 Comparison of Calculated Mid-Blanket and Steel Reflector
Spectra Using the 106-Group Cross Section Set 119 3. 17 Comparison of Integral Neutron Capture Rates for Various
Foil Materials in Blanket Mockup No. 4; Fluxes from
Downscatter Corrected Cross Sections with
4(U)
oc E 122 3. 18 Comparison of Energy Group Differential Capture Rates,Fluxes from the 106-Group Cross Section Set Analysis,
Mid-Blanket 123
4. 1 The Effect of Core Fissile Loading on System Effective
Multiplication Factor, Uranium Blanket System 137 4. 2 The Effect of Core Fissile Loading on System Effective
Multiplication Factor, Thorium Blanket System 138 4. 3 The Effect of Core Poison Concentration on k eff, U-238
Blanket System 140
4.4 The Effect of Core Poison Concentration on k ,
Th-232 Blanket System 141
4. 5 The Effect of Irradiation on System Effective
Multi-plication Factor, Uranium Blanket System 142
4.6 The Effect of Irradiation on System Effective
Multipli-cation Factor, Thorium Blanket System 143
4. 7 The Effect of Reflector (Blanket) Albedo Coefficient (f) on
the System Effective Multiplication Factor (k ) 150 4.8 The Effect of Core Management Scheme on keff 156 4.9 Radial and Axial Blanket Fissile Inventories for a
Fig. No. Page
4. 10 The Effect of Core Management Scheme on Blanket
Fissile Inventories 158
4. 11 The Effect of Burnup Time on System keff (Refueling
Every 600 Days) 161
4. 12 Uranium Radial Blanket Fissile Inventories,
Batch Irradiation 163
4. 13 Thorium Radial Blanket Fissile Inventories,
Batch Irradiation 164
4. 14 Comparison of the Breeding Performance (Inventory) of Row 1 Radial Blanket Under Batch Irradiation
Conditions 165
4. 15 Comparison of the Breeding Performance of Row 1 Radial
Blanket Under Batch Irradiation Conditions 166 4. 16 Comparison of Uranium Radial and Axial Blanket Fissile
Inventories, Batch Irradiation, Cycle 1 169 4. 17 Comparison of Thorium Radial and Axial Blanket Fissile
Inventories, Batch Irradiation, Cycle 1 170 4. 18 Comparison of Axial Blanket Breeding Performance
(Inventory) Under Batch Irradiation Conditions 171 4. 19 Comparison of Axial Blanket Breeding Performance
Under Batch Irradiation Conditions 172 4. 20 Relative Breeding Performance of Uranium and Thorium
Radial Blankets, Batch Irradiation 175 4.21 Relative Breeding Performance of Uranium and Thorium
Blankets, Batch Irradiation 176
4.22 U-232 Concentration in the Thorium Radial Blanket,
Batch Irradiation 178
4. 23 U-232 Concentration in the Thorium Axial Blanket,
Batch Irradiation, Cycle 1 179
4. 24 Average Core Burnup for the Uranium Blanket System,
Batch Blanket Management 180
4.25 Average Core Burnup for the Thorium Blanket System,
Fig. No. Page
4.26 Peak Uranium Radial Blanket Burnup by Row,
Batch Irradiation 183
4.27 Peak Thorium Radial Blanket Burnup by Row,
Batch Irradiation 184
4. 28 Breeding Ratio as a Function of Irradiation Time for
Thorium and Uranium Blanketed Systems 186 4. 29 Expected One-Group Reaction Parameter in a U-238
Radial Blanket, U-238 Capture 189
4. 30 Expected One-Group Reaction Parameter in a U-238
Radial Blanket, Pu-239 absorption 190 4. 31 Expected One-Group Reaction Parameter in a Th-232
Radial Blanket, Th-232 Capture 191
4. 32 Expected One-Group Reaction Parameter in a Th-232
Radial Blanket, U-233 Absorption 192 4. 33 System Effective Multiplication Factor as a Function of
Irradiation Time, Row 1 Radial Blanket Zone-Scatter
Managed 196
4. 34 The Effect of Radial Blanket Row 1 Management on Row 2
and Row 3 Fissile Inventories, U-238 Blanket System 199 4. 35 The Effect of Radial Blanket Row 1 Management on Row 2
and Row 3 Fissile Inventories, Th-232 Blanket System 200
4. 36 The Effect of Radial Blanket Row 1 Management on Axial
Blanket Fissile Inventories, U-238 Blanket System 201
4. 37 The Effect of Radial Blanket Row 1 Management on Axial
Blanket Fissile Inventory, Th-232 Blanket System 202
4. 38 The Effect of Radial Blanket Row 1 Management on the Total Fissile Material Produced in Row 1, U-238
Blanket System 204
4. 39 The Effect of Radial Blanket Row 1 Management on the Total Fissile Material Produced in Row 1, Th-232
Blanket System 205
4.40 The Effect of Radial Blanket Row 1 Management on the Total Fissile Material Produced in the Radial Blanket,
Fig. No. Page
4.41 The Effect of Radial Blanket Row 1 Management on the Total Fissile Material Produced in the Radial Blanket,
Th-232 Blanket System 207
4.42 Comparison of the Effect of Radial Blanket Row 1 Management on the Fissile Inventory Production for
Uranium and Thorium Radial Blankets 209 4.43 The Effect of Radial Blanket Row 1 Management on
U-232 Concentration in Rows 2 and 3, Th Blanket System 211 4.44 The Effect of Radial Blanket Row 1 Management on the
Average Burnup Experienced in the 5-cm-wide Annular Region in Row 2 Nearest the Row 1 Interface, U-238
Blanket System 213
4.45 The Effect of Radial Blanket Row 1 Management on the
Average Burnup of Row 2, Thorium Blanket System 214
4.46 The Effect of Irradiation with Row 1 Radial Blanket Management on the One-Group Reaction Parameter,
Th-232 Blanket System, U-233 Absorption Reaction 216 4.47 The Effect of Irradiation on the One-Group Reaction
Parameter for a Th Blanket System with Row 1 Radial
Blanket Management, Th-232 Capture Reaction 217 4.48 Comparison of Radial Blanket Fissile Inventories by Row
for Batch Irradiated and In-Out Shuffle Managed U-238
Blankets 221
4.49 Comparison of the Total Radial Blanket Fissile Inventories for Batch Irradiation and In-Out Shuffle
Management (Equilibrium Cycle) 222
4. 50 Comparison of the Total Mass of Fissile Material Produced in the Radial Blanket for Batch and In-Out
Shuffle Management 223
4. 51 Total Radial Blanket Fissile Inventory Produced for Batch Irradiation and In-Out Shuffle Management of
a Uranium Blanket 225
4. 52 The Effect of Core Loading on System keff for a U-233
Fueled LMFBR 228
4. 53 The Effect of Poison Concentration in the Core on System
Fig. No. Page
4. 54 Comparison of System k eff for U-233 and Pu
Fueled Systems 231
4. 55 Radial and Axial Blanket Breeding Performance 232 4. 56 Average Core U-232 Concentration for a U-233
Fueled System 233
4. 57 Comparison of Average Core Burnups for U-233
and Pu Fueled Systems 234
5. 1 The Effect of Core Management on the Cost of Power
Contributed by the Radial and Axial Blankets 246 5. 2 Difference in Radial Blanket Power Cost Contribution
Between Mixed Reprocessing and Differential
Reprocessing, Thorium Blanket 248
5. 3 Power Cost Contribution for Thorium and Uranium Blanket Systems, Reference Economic Environment,
Private Utility 250
5.4 Axial Blanket Power Cost Contribution for Uranium
Blanket System, Reference Economic Environment 251 5. 5 Axial Blanket Power Cost Contribution for a Thorium
Blanket System, Reference Economic Environment 252 5.6 Comparison of the Total Power Cost Contribution from
Batch Managed Thorium and Uranium Axial Blankets 254
5. 7 Power Cost Contribution from Row 1 of a Batch Managed
U-238 Radial Blanket 256
5.8 Power Cost Contribution from Rows 1, 2, and 3 of a
Batch Managed U-238 Radial Blanket, Fissile Pu = 10.0 $/g 257 5.9 Power Cost Contribution from Rows 1, 2, and 3 of a
Batch Managed Th-232 Blanket System, U-233 = 16.7 $/g 259 5. 10 Comparison of the Total Power Cost Contribution from
Batch Managed Thorium and Uranium Radial Blankets 260 5. 11 Economic Penalty in the Thorium Axial Blanket Associated
with Production of the Contaminant U-232 262 5. 12 Economic Penalty in the Thorium Radial Blanket
Fig. No. Page
5. 13 Comparison of Core Power Cost Contribution for Typical
Private and Public Utility Environments, Pu = 10.0 $/g 264 5. 14 Comparison of the Power Cost Contribution from Rows 1
and 2 of a Uranium Blanket System for Public and Private
Utility Financial Parameters 265
5. 15 Comparison of the Power Cost Contribution for Row 2 of a Uranium Radial Blanket for Row 1 Batch Irradiated and
Zone-Scatter Managed, Fissile Pu = 10. 0 $/g 267 5. 16 Comparison of Power Cost Contributions for Row 2 of a
Thorium Radial Blanket for Row 1 Batch Irradiated and
Zone-Scatter Managed, U-233 = 16. 7 $/g 268 5. 17 Refueling Scheme for Zone Scatter and Batch Blanket
Management Schemes 271
5. 18 Fissile Inventory in a Single Batch of Radial Blanket Material for a Uranium Blanket with In-Out Shuffle
Management 275
5. 19 Irradiation and Discount Schedule for Batch Irradiation
and In-Out Shuffle Management 277
5. 20 Economic Comparison of Th and U Blanket Systems 283 5. 21 Break-Even Parity Ratio: Ratio of the Values of U-233
and Fissile Pu vs. Value of Fissile Plutonium 285 5. 22 Net Savings Associated with Using Th Blankets in a
1000 MWe LMFBR as a Function of Fissile Pu Value 287 5. 23 Linear Approximation to the Effect of Changes in
Economic Environment on the Optimum Irradiation Time for a Row 1 Uranium Radial Blanket Under
Batch Irradiation 297
5. 24 The Linear Approximation to the Effect of Changes in Economic Environment on the Enrichment in a Uranium Radial Blanket Row 1 at the Optimum Irradiation Time,
Batch Irradiation 299
5. 25 The Sensitivity of the Uranium Radial Blanket Row 1 Optimum Irradiation Time to Variations in the Power
Fig. No. Page
5.26 The Sensitivity of the Uranium Row 1 Radial Blanket Optimum Enrichment to Variations in the Power Cost
Contribution About the Optimum 301
5. 27 Comparison of Radial Blanket Row 1 Optimum Irradiation
Time for Batch Irradiated Thorium and Uranium Blankets 302 5.28 Comparison of Radial Blanket Row 1 Optimum Enrichment
for Batch Irradiated Thorium and Uranium Blankets 303 5. 29 The Effect of Economic Environment on the Optimum
Irradiation Time of Row 2 Radial Blanket 306 5. 30 The Effect of Economic Environment on the Radial
Blanket Row 2 Enrichment at the Optimum 307 5. 31 The. Effect of Radial Blanket Zone Scatter Management on
the Optimum Irradiation Time of Radial Blanket Row 2,
for a Variety of Economic Environments 310 5. 32 The Effect of Radial Blanket Zone Scatter Management on
Optimum Enrichment of Radial Blanket Row 2 for a
Variety of Economic Environments 311 5. 33 Irradiation Time at the Optimum versus Optimum
Enrich-ment for Both Managed (Zone Scatter) and Batch Irradiated
Blankets 312
5. 34 Irradiation Time at the Break-Even Point for a
U-238 Blanket 314
5. 35 Enrichment at the Break-Even Point for a U-238
Blanket System 315
5. 36 Correlation Between Optimum and Break-Even Irradiation
Times for a U-238 Blanket 317
5. 37 Estimate of the Fissile Production in the Thorium
Axial Blanket 319
5. 38 Comparison of BOL Capture Rates for a Thorium Radial Blanket Predicted Using Thorium Capture Cross Sections
1. 0 and 0.8 Times Nominal 329
6. 1 Beginning-of-Life Volumetric Fission Heating Rates in
Uranium and Thorium Radial Blankets 350 6. 2 Relative Fission Heating Rate in a Depleted (0. 2% U-235)
6. 3 Comparison of Beginning-of-Life Neutron Heating
Rate in Thorium and Uranium Radial Blankets 352 6.4 The Ratio of Neutron to Fission Heating Rate in a
Typical 1000 MWe LMFBR with a Thorium Radial
Blanket 353
6. 5 The Ratio of Neutron to Fission Heating Rate in a Typical 1000 MWe LMFBR with a Uranium Radial
Blanket 354
6.6 Neutron Heating Rates in the Reflectors of Uranium
and Thorium Blanketed Systems 357
6. 7 The Relative Fission and Gamma Heating Rates in a
Uranium Blanketed System, Beginning- of- Life 360
6. 8 Gamma Heating Rate in the Radial Blanket and
Reflector of a Uranium Blanketed System, BOL 361 6. 9 The Relative Fission and Gamma Heating Rates
in a Thorium Blanketed System, Beginning-of-Life 363 6. 10 Beginning-of-Life Gamma Heating Rate in the Radial
Blanket and Reflector of a Thorium Blanketed System 364
6. 11 Comparison of Uranium Blanket Heating Rates from Gamma and Neutron Heating at the Beginning-of-Life
and After 1200 Days of Irradiation 365 6. 12 Variation of the Peak Fission Power Density in a
Uranium Radial Blanket with Batch Irradiation Time 368 6. 13 Variation of the Peak Fission Power Density in a
Thorium Radial Blanket with Batch Irradiation Time 369 6. 14 Variation of the Peak Fission Power Density in a
Uranium Radial Blanket with Irradiation Time
(Row 1 Replaced Every 1000 Days) 371 6. 15 Variation of the Peak Fission Power Density in a
Thorium Radial Blanket with Irradiation Time
(Row 1 Replaced Every 600 Days) 372 6. 16 The Variation of Peak Fission Power Density in a
Uranium Radial Blanket Which Is In-Out Shuffle
Managed (Equilibrium Cycle) 374
6. 17 Variation in Axial Blanket Fission Power Shape in a
6. 18 Beginning-of-Life Heating Rate Contributions in a
Uranium Radial Blanket 382
6. 19 Beginning-of-Life Heating Rate Contributions in a
Thorium Radial Blanket 383
6. 20 Estimate of the Average Heating Rate in the Radial Blanket After 600 Days of Irradiation (Fission +
Gamma + Neutron) 384
6. 21 Comparison of the Actual Fission Heating Rate and the Fission Heating Rate Assumed in Evaluating Fission Product Decay Heating in a Thorium Radial Blanket
Near the Core Interface 390
6. 22 Comparison of Heating Rates from Capture Product Decay and Fission Product Decay in a Thorium Radial
Blanket Near the Core Interface 391 6.23 Core Decay Power Following Shutdown 393 6. 24 The Effect of Core Poison Concentration on System keff 409
7.1 Schematic of Reference Reactor Design, 1000 MW LMFBR 420 7. 2 Fissile Material Inventory in Batch Managed Uranium
Radial and Axial Blankets 422
7. 3 Difference in Total Fissile Product Between Thorium
and Uranium Blankets 422
7.4 Comparison of Uranium Radial Blanket Fissile Inventories
for Various Management Schemes 423
7. 5 Comparison of Thorium Radial Blanket Fissile Inventories
for Batch Management and Zone-Scatter Management 423
7.6 Comparison of Calculated and Experimental Fission Rates
for Thorium and Uranium Foil Traverses in BTF 4 425
7. 7 Comparison of Differential Capture Rates in Radial
Blanket 427
7.8 Comparison of Calculated and Experimental Capture Rates in Thorium and Uranium Foils; Predictions Made Using
the 106-Group Modified ABBN Cross Section Set 428
7.9 Power Cost Contributions from Rows 1, 2, and 3 of a Batch Managed Th-232 Blanketed System for U-233 at
Fig. No. Page
7. 10 Comparison of the Total Power Cost Contributions from Batch Managed Thorium and Uranium Radial
Blankets 432
7. 11 Comparison of the Total Power Cost Contribution from
Batch Managed Thorium and Uranium Axial Blankets 434
7. 12 Economic Comparison of Thorium and Uranium
Blankets for 1000 MW LMFBR 436
e
7. 13 Break-Even Parity Ratio: Ratio of U-233 to Fissile Pu
Values vs. Value of Fissile Plutonium 438
7. 14 Comparison of Radial Blanket Row 1 Optimum Irradiation Time for Batch Irradiated Thorium
and Uranium Blankets 442
7. 15 Comparison of Radial Blanket Row 1 Optimum Enrichment for Batch Irradiated Thorium and
Uranium Blankets 442
7. 16 Comparison of BOL Heating Rates External to the Core 445 7. 17 Comparison of Uranium and Thorium Radial Blanket
Heating Rates After 600 Days (2 Years) of Irradiation 445
LIST OF TABLES
Table No. Page
1. 1 Eta Values for Major Fissile Species in Various
Neutron Spectra 31
1. 2 Comparison of Infinitely Dilute Capture Cross Sections 33
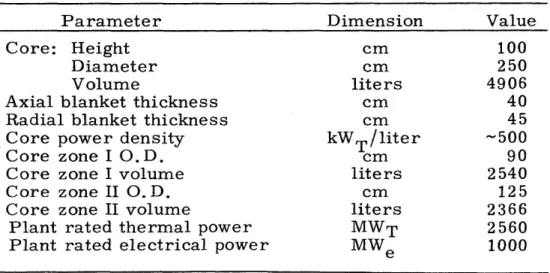
2.1 Standard Reactor Compositions 49
2. 2 Standard Reactor Physical Characteristics
and Dimensions 49
2. 3 Fuel Material Density as Percent of Theoretical 50 2.4 Comparison of Infinitely Dilute and Resonance
Self-Shielded Capture Cross Sections for U-238 52 2. 5 Comparison of Infinitely Dilute and Resonance
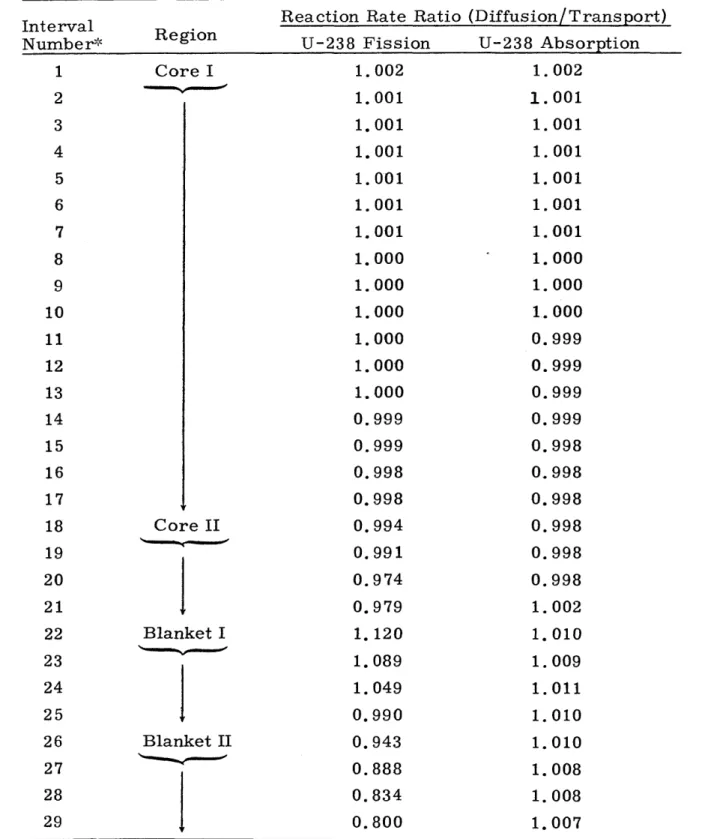
Self-Shielded Capture Cross Sections for Th-232 53 2. 6 Comparison of Collapsed Group Structures 54 2. 7 Reaction Rate Prediction Ratios, 4-Group Analysis
to 26-Group Analysis 55
2.8 Model Parameters for the Standard Spherical Reactor 56
2. 9 Comparison Between Transport and Diffusion Theory
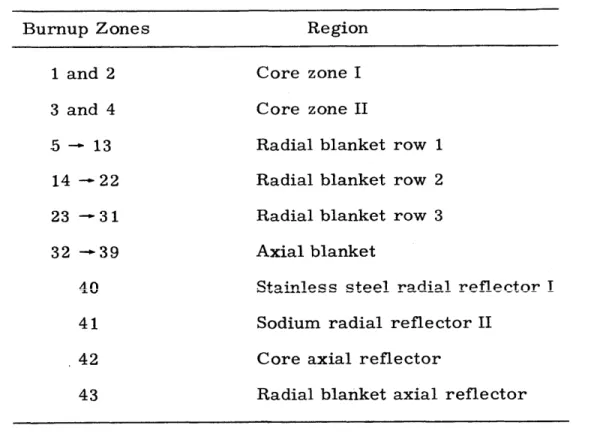
Predictions of U-238 Reaction Rates 57 2.10 Summary of Burnup Region Types 61 2. 11 Region-Collapsed Cross Sections Used in the Burnup
Analysis 62
2.12 USAEC's U-232 Penalty Factors 74
3. 1 Homogenized Atom Densities in Blanket No. 4 79 3. 2 Data Pertinent to Foil Counting 85 3. 3 Cross Sections for Data Normalization 91 3.4 Correction Factors for Epithermal Neutron Activation
in the Thermal Facility 94
Table No. Page
3.6 Comparison of Thorium and Uranium Capture Rates
in the Reflector 118
3. 7 Comparison of Mid-Blanket Foil Irradiation Data 124 3.8 Comparison of Calculated and Experimental Reaction
Rate Ratios in a Spectrum Similar to a Fission Spectrum 126 4. 1 Plutonium Isotopic Concentrations 134
4.2 Non-Fuel Number Densities 136
4.3 Blanket Material Number Densities 136 4. 4 Beginning-of-Life Fissile and Poison Concentrations,
Uranium Blanketed System 144
4.5 Beginning-of-Life Fissile and Poison Concentrations,
Thorium Blanketed System 145
4.6 Required Core Fissile Enrichments 145
4. 7 Comparison of Albedo Coefficients for Various Core
Reflectors 152
4.8 Radial Blanket Albedo Comparison 153 4. 9 Initial Fissile Enrichments and Poison Concentrations
for the Trial Core Management 155
4. 10 Comparison of Radial Blanket Region Resonance
Self-Shielded Capture Cross Sections 168 4. 11 Comparison of Axial Blanket Region Resonance
Self-Shielded Capture Cross Sections 174
4. 12 Average End-of-Life Core Burnups for the Batch
Blanket Management Case 182
4. 13 Core and Blanket Management Schemes for the Simplified
Zone Scatter Management of the Radial Blanket 194
4. 14 Comparison of System keff for Different Management
Schemes 197
4. 15 Average Core Burnups, Managed Blanket vs. Batch
Table No. Page
4. 16 Initial Characteristics for a U-233 Fueled LMFBR System 227
5.1 Reference Economic Environment 240
5. 2 Estimated Value of Fissile Isotopes 242 5. 3 U-233 to Fissile Plutonium Parity Ratio 243 5.4 Contributions to the Fuel Cycle Cost from Batch
Irradiated and Zone Scatter Managed Radial Blankets 272 5. 5 Economic Effect of Blanket Management on System
Availability and Power Costs 273
5. 6 Blanket Economic Performance with Management 276 5. 7 Economic Effect of Blanket Management on System Power
Cost: In-Out Shuffle Management 278 5.8 Economic Comparison Between U-233 and Plutonium
Fueled Systems 280
5. 9 Range of Variation of Economic Parameters 294 5.10 Optimum Irradiation Time Evaluation 296 5. 11 The Economic Effect of Core Batch Refueling Interval 322 5. 12 Effect of Blanket Management on Economic Performance 323 5. 13 The Economic Effect of Reprocessing Losses and Delays 326 6. 1 Comparison of Axial Blanket Shielding Characteristics 336 6. 2 Comparison of U0 2 and ThO2 Thermal Conductivities 338 6. 3 Comparison of UO2 and ThO2 Specific Heats 339 6.4 Neutron Heating Rate Contributions in a Thorium Blanket 356
6. 5 Ratio of Maximum to Minimum Fission Heating Rates by Row in Thorium and Uranium Blankets with Different
Management Schemes 378
6.6 Temporal Variation of Average Blanket Row Fission
Heating Rate at the Core Mid-Plane 380 6. 7 Radial Blanket Total Power Peaking Factors 385
Table No. Page
6.8 Comparison of Beginning-of-Life Sodium Activation Rates 394 6.9 Estimates of Predicted Accuracies for Dynamics
Parameters 396
6. 10 Central Core Sodium Void Reactivity Comparison 397 6. 11 Isothermal Doppler Coefficient Comparison 399 6.12 Thermal Conductivities of Fuel Oxides 401 6. 13 Comparison of Power Coefficients of Reactivity 402 6. 14 Core Contribution to Doppler and Power Coefficient
Differences 405
6. 15 Comparison of Prompt Neutron Lifetime and Effective
Delayed Neutron Fraction 406
6.16 Summary of System Dynamics Differences 414
7.1 Reference Economic Environment 433
7. 2 Comparison of Radial Blanket Power Cost Contributions
for Various Management Schemes 439
7. 3 Range of Variation of Economic Parameters 441 7.4 Effect of Methods and Assumptions on Thorium Blanket
Relative Economic Performance 443
7. 5 Summary of Differences in System Physics
Character-istics Between Uranium and Thorium Blanketed LMFBR's 447
B. 1 Cross Sections Unavailable from the ABN-FTR-200 Set 467
B. 2 Group Average (n,2n) Cross Sections for Th-232 and U-233 468
B. 3 Capture and Fission Cross Sections for Pa-233 469
B. 4 Mass Attenuation Comparison Between Thorium
and Uranium 472
B. 5 Selected Neutron Cross Sections from Kidman's 22-Group
Set 476
B. 6 Comparison of Neutron Inelastic Scatter Cross Sections
Table No. Page
B. 7 Thorium P Cross Sections for Coupled
Neutron-Gamma Analysis, 40 Groups 480
B. 8 Description of Cross Sections Presented in Table B. 7 490
C. 1 Summary of FBR Fuel Cost Analysis Equations
(Cash Flow Method) 492
C. 2 Sample Problem Input Deck 507
C. 3 Sample Problem Output Data 510
Chapter 1 INTRODUCTION
1.1 FOREWORD
The primary objective of the Liquid Metal Cooled Fast Breeder
Reactor (LMFBR) program, both in the U.S. and abroad, is to develop
an environmentally benign source of power capable of meeting the
growing demand for economical energy. The LMFBR is expected to
meet this demand, in large part, through its ability to breed nuclear
fuel. In the breeding process, fertile materials (e.g. , U-238 or
Th-232) are converted into fissile materials (e.g. , Pu-239 or U-233) by neutron-induced transmutation. The primary effort in the LMFBR
program is being directed toward developing the U-238/Pu-239
breed-ing cycle. The work presented here is concerned with the detailed
evaluation (see sec. 1. 3 for a specific prospectus) of a variation on this
cycle, in which the core is fueled with a mixture of depleted uranium
and fissile plutonium but in which the radial and axial blankets contain
the fertile material thorium. The purpose of this chapter is to discuss
why consideration should be given to thorium blankets in LMFBR's, and then to outline the work which will be presented in the remainder of the report.
1. 2 THORIUM UTILIZATION 1. 2. 1 Systems Considered
Power production in a nuclear reactor affords an opportunity to
convert non-fuel (fertile) material into fuel (fissile) material by using
extra neutrons from the energy releasing fission reaction. Two main
cycles have been proposed in which neutron capture in a fertile nuclide
leads to generation of a fissile nuclide. These are the uranium/
plutonium and the thorium/uranium cycles. The reactions involved in
these cycles are shown below.
(U/Pu): U-238(n,y)U-239 - Np-239 Pu-239 23.5 min 2.35 days
Pu-239(n,f) fission products + neutrons + energy
(Th/U): Th-232(n, y)Th-233 - Pa-233 U-233 21.1 min 27.4 days
U-233(n,f) fission products + neutrons + energy
The LMFBR program in the U.S. has as its purpose development of a
reactor system in which the U/Pu cycle is used to produce power as
well as to generate more fissile plutonium than is consumed in power
production.
Three systems in which thorium is used as a fertile material are, or until recently have been, under development in the United States:
1. The High Temperature Gas Cooled Reactor (HTGR), a converter reactor (i. e. , less than one atom of fissile
material is formed by fertile capture per fissile atom
2. The Light Water Breeder Reactor (LWBR), which likely
would be operated most economically as a converter
rather than as a breeder reactor.
3. The Molten Salt Breeder Reactor (MSBR), a system recently eliminated from the list of those being actively
pursued by the USAEC.
It should be noted that all three systems which utilize the Th/U cycle
operate with predominantly thermal neutron energy spectra. The
reason for using the Th-232/U-233 cycle in high conversion ratio
thermal spectrum reactors is that the number of fission neutrons
produced per neutron absorbed (eta, ri) is higher for U-233 than for
any other common fissile isotope in a thermal spectrum (L1, D1).
Eta values for various fissile materials are shown in Table 1. 1 (D2).
TABLE 1.1
Eta Values for Major Fissile Species in Various Neutron Spectra YJi f a9
Standard Spectra Typical Reactors Nuclide Thermal E
pi-2200 (Maxwell- thermal Fast Thermal Fast M/S ian) (1/E) (Fission) (LWR)
U-233 2.29 2.28 2.14 2.64 2.2 2.3-+ 2.4 U-235 2.07 2.05 1.63 2.46 2.0 2.0-2.2 Pu-239 2.09 1.96 1.76 3.03 1.9 2.4+ 2.7
Thus it might be expected that U-233 would be superior as a fuel
material to both U-235 and Pu-239 in thermal reactors. Unfortunately,
Consequently, if U-233 is to be used as a fuel in thermal spectrum
reactors, it must be produced by the neutron bombardment of Th-2 32.
Because thermal spectrum reactors are unable to produce more fuel
than they consume (with the possible exception of the LWBR or MSBR), an external source of U-233 must be developed to allow more efficient
operation of this type of reactor. This need leads to the logical
deduction that as long as sufficient plutonium (produced by Light Water
Reactors, LWR's) exists to fuel LMFBR's, more efficient use might be
made of LMFBR's if U-233 were produced by irradiation of thorium in
their blankets. This suggestion has been made by a number of
investi-gators (KI, L2, Fl).
Several characteristics qualify thorium for consideration as a
blanket material for LMFBR's. Two factors deserve mention at this
point. First is the relative ability of thorium to utilize neutrons which
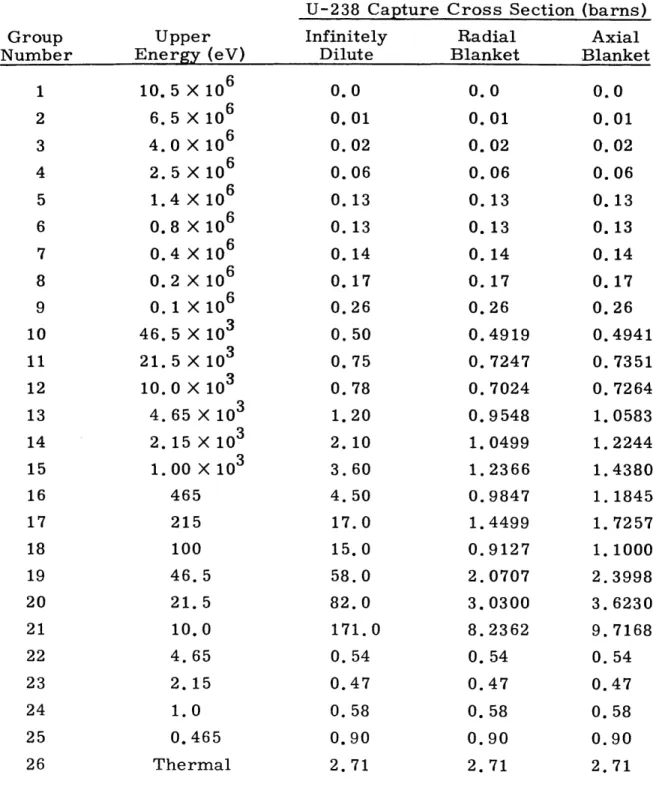
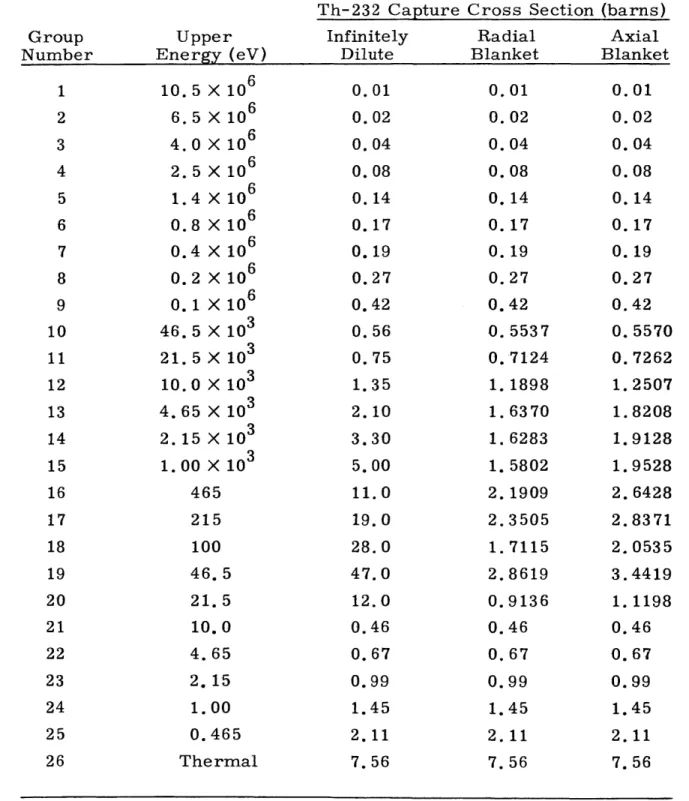
leak from the core in the fertile to fissile conversion process. Table 1.2
shows a comparison of the microscopic capture cross sections for
U-238 and Th-232. As shown, at all energies above about 50 eV, the capture cross section of thorium is greater than that of uranium. The
second factor is an economic one. In a report issued by the USAEC (D3), curves showing anticipated fissile material values are presented for a
number of mixes of fossil and nuclear power generating systems. For
the case in which the total energy cost to U.S. consumers between now
and the year 2020 was the lowest, the value of U-233 was significantly
higher than that of Pu-239 for nearly every year after 1977. Figure 1. 1 is a reproduction of the fissile isotope value history from that report.
Recent developments in the LMFBR schedule have prompted speculation
TABLE 1.2
Comparison of Infinitely Dilute Capture Cross Sections (B1, N1)
Group Upper Energy (eV) 9c (barns)
Th-232 U-238 Th-232/U-238 1 10. 5 X 10⁶ 0.01 0.00 -2 6.5 X 10⁶ 0.02 0.01 2.00 3 4. 0 X 106 0.04 0.02 2.00 4 2.5 X 10⁶ 0.08 0.06 1.33 5 1.4 X 10⁶ 0.14 0.13 1.08 6 0.8 X 10⁶ 0.17 0.13 1.31 7 0.4 X 10⁶ 0.19 0.14 1.36 8 0.2 X 10⁶ 0.27 0.17 1.59 9 0.1 X 10 6 0.42 0.26 1.62 10 46.5 X 10³ 0.56 0.50 1.12 11 21. 5 X 10³ 0.75 0.75 1.00 12 10. 0 X 103 1.35 0.78 1.73 13 4. 65 X 103 2.10 1.20 1.75 14 2. 15 X 103 3.30 2.10 1.57 15 1. 00 X 103 5.00 3.60 1.39 16 465 11.0 4.50 2.44 17 215 19.0 17.0 1.12 18 100 28.0 15.0 1.87 19 46.5 47.0 58.0 0.81 20 21.5 12.0 82.0 0.15 21 10.0 0.46 171.0 0.0027 22 4.65 0.67 0.54 1.24 23 2.15 0.99 0.47 2.11 24 1.0 1.45 0.58 2.50 25 0.465 2.11 0.90 2.34 26 Thermal 7.56 2.71 2.79
1976 1984 1992 2000 2008 2016 Year (1968 + 2020) C ii'> C--C 9-1968
in time by approximately 10 years. This shift would assure the higher
value of U-233 (relative to fissile plutonium) until after the year 2000.
Another independent system study performed at Oak Ridge National
Laboratory (K1) has shown that the expected value of U-233 is higher
than that for fissile plutonium until about the year 1996. Figure 1. 2 is
a reproduction of the estimated fissile isotope values from that report.
Both Figs. 1. 1 and 1. 2 show that fissile isotope values will continue
to rise until about the year 2000, and thereafter decline. This behavior
has been attributed to the high value of plutonium in Fast Breeder
Reactors (FBR's) coupled with the incentive to build this type of plant
(KI). The decrease in fissile values can be traced to the production of
excess plutonium in FBR's after they begin to produce a significant
fraction of the nation's energy requirements. The high relative value
of U-233 results from the economic attractiveness of High Temperature
Gas Cooled Reactors (HTGR's) and the fact that U-233 is a fuel superior
to fissile plutonium in HTGR's. It is apparent that if FBR's with
thorium blankets were constructed in significant numbers, the shape of
Figs. 1. 1 and 1. 2 would change. However, prior to about the year 2000,
the number of FBR's would be expected to be sufficiently small that the
general shape of these curves would be little affected by the use of
thorium blankets.
Another obvious feature of Figs. 1. 1 and 1. 2 is that the value of
U-233 is projected to exceed that of fissile plutonium even after the LMFBR begins to generate a significant fraction of the electric power
produced in the U. S. This would indicate that thorium blankets on at
least some of the operational LMFBR's would be economically
35 30
/
25
-\1 !3 08 Price ($/lb) 20 - -11-233 Shadow Price 15-10 -Fissile Pu Shadow Price (,$/j7) 5-0 1970 1980 1990 2000 2010 2020 YEARprojected. To evaluate the market penetration of thorium blanketed
LMFBR's, a detailed system study similar to those discussed above is
required. This study is beyond the scope of the work to be presented
here.
A more detailed review of relative fissile isotope values in various thermal spectrum reactors will be presented in section 5. 2. It is
suf-ficient here to say that in all studies in which the value of fissile
plu-tonium has been compared to that of U-233 as fuel material for thermal
spectrum reactors, U-233 always proves to be more valuable.
1. 2. 2 Previous Studies
A number of investigators have assessed the relative merits of the U-238/Pu-239 and the Th-232/U-233 breeding cycles for use in
LMFBR's (Al, Hi, L4, L5, 01, Si). In one of the earliest papers, that of Loewenstein and Okrent (L4), the conversion ratios in relatively small
spherical cores were determined to be 1. 2 to 1. 4 for the thorium cycle
compared to 1. 4 to 1. 7 for the uranium cycle. A later revision of that
study (01) using updated cross section data showed that the thorium
cycle was even less attractive from the breeding ratio point of view.
Hankel et al. (Hi) performed a scoping feasibility and economic
evaluation of the Th-232/U-233 cycle for fast breeder reactors. This
investigation concluded that the lowest doubling time and the lowest fuel
cycle costs of the systems investigated were derived using a carbide
fuel. Other important conclusions of Hankel's work derived from a
comparison of the Th-232/U-233 FBR with a comparable FBR using the
1. Higher core power densities were achieved for the U-238/Pu-239 reactor.
2. Lower system doubling times were achieved with the U-238/Pu-239 reactor.
3. Lower power generation costs were achieved with the U-238/Pu-239 reactor.
4. A negative sodium void coefficient was obtained for the Th-232/U-233 FBR while a positive coefficient was obtained for the U-238/Pu-239 system.
5. At least 50% more excess reactivity was required for a given burnup in the Th-232/U-233 system than
in the U-238/Pu-239 reactor.
Other investigators such as Loewenstein (L5) and Allen (Al) have
emphasized the safety advantages which can be attained by using
thorium in the central region of large LMFBR's. This advantage was
shown primarily to be associated with changing the sodium void
coef-ficient from positive to negative by the use of thorium within the core.
A fairly detailed discussion of the potential safety-related problems of a Th-232/U-233 fueled FBR was presented by Sofer (Si) for a
carbide fueled system. Among the problems pointed out were:
1. The increase in core reactivity following shutdown due to the decay of Pa-233 to U-233.
2. The smaller delayed neutron fraction in the U-233/Th-232 system (0. 003 vs 0. 004 for the Pu-239/U-238 system) resulting from the significantly smaller contribution to the total fission rate of the fertile Th-232.
3. More excess reactivity is required in the core because of the delay in fissile isotope formation following fertile
capture. This delay is caused by the long half life (27. 4 days) of Pa-233.
In all the studies of a pure Th-232/U-233 fuel cycle for an LMFBR, it was concluded that the increased core inventory required and the
decreased breeding ratio compared to a similar U-238/Pu-239 fueled
system made the thorium cycle economically unattractive for use in an
LMFBR. The main motivation for pursuing studies of the thorium
cycle for LMFBR's seemed to be the effect that it had in reducing a
positive sodium void coefficient or, in some cases, making that
coef-ficient negative.
A number of studies have been performed by Russian investigators analyzing the characteristics of mixed-fuel LMFBR systems (B2, L6, L7).
Leipunskii et al. (L6) performed an optimization of an LMFBR in which
thorium was the fertile material in the blanket, and a mixture of Pu-239, U-233, and U-238 was used in the core. He concluded that the con-version factor of a mixed-fuel, thorium-blanketed LMFBR could be
optimized to be close to that for a U-238/Pu-239 system. His
calcu-lations also showed that the U-233 produced in the blanket regions was
relatively free of U-232 contamination. U-232 is an undesirable con-taminant because of the severe radiation shielding problem during fuel
processing resulting from the buildup of the U-232 daughter product, Bi-212 (D1).
In an experimental study using the reactor BR-1, Batyrebekov et al.
(B2) evaluated the breeding contribution of an infinitely thick thorium
metal blanket. Multigroup calculations, which were shown to agree
quite well with experimental predictions, indicated that the breeding
ratio for a reactor with an infinitely thick thorium metal blanket would
be approximately 20%less than that for the same reactor with an
to the difference between the fission rate in a uranium and a thorium
blanket. No detailed information on absolute capture or fission rate
distributions was presented in this report.
In a more recent study, Leipunskii (L7) analyzed a number of
reactor configurations, all of which had thorium blankets. His study
dealt primarily with the effect of isotopic composition of the core on
safety, power flattening, and temporal variations in power distribution
within the core. Again his most favorable case was one in which the
core was composed of a mixture of U-238, U-233, and Pu-239.
Leipunskii showed that providing an optimal distribution of fissile
plutonium and U-233 in the core allowed achievement of a reduction in
the core radial peak to average power density from -1. 8 to ~1. 2. For
our purposes the main conclusion to be drawn from Leipunskii's work
is that a continuing interest is being shown by some factions in the
Soviet Union in the use of thorium blankets for LMFBR's.
Recently a number of studies have been made (L2, L8, L9, W1) in
which the use of crossed-progeny fuel cycle schemes was investigated.
A crossed-progeny fuel cycle is one in which two or more nuclear reactor types, operating in the same energy economy, breed fissile
material for interchange among these reactor types. A simple example
would be an energy economy in which Light Water Reactors (LWR) burn
natural uranium enriched with U-233 and convert the U-238 in natural
uranium into Pu-239 for use as fuel in LMFBR's. The LMFBR's, in
turn, use Th-232 as a blanket material to allow production of U-233 for
use as fuel in LWR's. This sytem would be equally valid if HTGR's
Lang (L2, L8, L9) has performed a crossed-progeny fuel cycle
analysis using LMFBR's and spectrum-hardened Pressurized Water
Reactors (PWR). He evaluated the use of thorium in the blanket region
of the low yield LMFBR proposed by Allis Chalmers in 1964. This
reactor had an outer radial blanket as well as a blanket region in the
center of the core. His analysis, which included the effect of blanket
shuffling to minimize U-233 in-reactor residence time, led to the
con-clusion that the early demonstration of the U-233-producing blanket
associated with an optimized LMFBR core design would tend to stay the
early economic obsolescence of LWR's. Lang also concluded (L9) that
the largest part of the economic savings associated with the use of
crossed-progeny fueling would be realized in the first generation of
oxide-fueled breeders, and that these savings could be sufficient to
bring the power costs of early breeders in line with those of LWR's.
Wenzel (W1) performed a scoping economic study of the use of a
thorium blanket in an LMFBR with a somewhat more optimally
designed core than that used in Lang's analysis. His study considered
the use of PWR's and LMFBR's in parallel. Two important
con-clusions were reached by Wenzel:
1. During various stages in the growth of the power economy, the fuel cycle costs of PWR's could be reduced by from 10% to 30% by the use of the crossed-progeny fuel cycle, while the cost of the LMFBR fuel cycle would be relatively un-affected.
2. The use of crossed-progeny fuel cycles could reduce some of the peak demand for separative work expected to occur during the 1980's.
1. 3 OUTLINE OF THIS WORK
1.3.1 Preface
As discussed above, previous studies which have assessed the use
of thorium as the fertile material in LMFBR blankets have confined
themselves to scoping nuclear and safety calculations and overall
sys-tem economic evaluation. This work is not intended to be an overall
system study. Crossed-progeny fuel cycles using two or more reactor
types will not be addressed as such. Rather this work will attempt to
define the break-even point for the use of thorium rather than uranium
as the fertile material in LMFBR blankets. In other words, given a
price for Pu-239, this study will assess the minimum price which must
be received for U-233 to make the breeding of U-233 in LMFBR
blankets economically attractive.
It should be emphasized that the use of thorium blankets for
LMFBR's is expected to be most economically attractive during the
early years following LMFBR introduction. During this period there
will be a plutonium glut and a shortage of U-233, both resulting from
the large number of thermal spectrum (LWR and HTGR) reactors in
use. In actual fact, use of thorium blankets in LMFBR's may
con-tribute significantly to insuring the early acceptance of the LMFBR by
the utility industry. The large reduction in LMFBR fuel cycle cost
which this study will show can result from the use of thorium blankets
may be sufficient to offset the higher capital costs expected for early
LMFBR's. The early acceptance of the LMFBR may be crucial if, as
some authors have suggested (R1), a huge gap between U.S. energy demand and energy sources is developing.