Demonstration of a robust magnonic spin wave interferometer
The MIT Faculty has made this article openly available.
Please share
how this access benefits you. Your story matters.
Citation
Kanazawa, Naoki et al. “Demonstration of a Robust Magnonic Spin
Wave Interferometer.” Scientific Reports 6.1 (2016): n. pag.
As Published
http://dx.doi.org/10.1038/srep30268
Publisher
Nature Publishing Group
Version
Final published version
Citable link
http://hdl.handle.net/1721.1/109328
Terms of Use
Creative Commons Attribution 4.0 International License
www.nature.com/scientificreports
Demonstration of a robust
magnonic spin wave interferometer
Naoki Kanazawa
1, Taichi Goto
1,2, Koji Sekiguchi
2,3, Alexander B. Granovsky
4,
Caroline A. Ross
5, Hiroyuki Takagi
1, Yuichi Nakamura
1& Mitsuteru Inoue
1Magnonics is an emerging field dealing with ultralow power consumption logic circuits, in which the flow of spin waves, rather than electric charges, transmits and processes information. Waves, including spin waves, excel at encoding information via their phase using interference. This enables a number of inputs to be processed in one device, which offers the promise of multi-input multi-output logic gates. To realize such an integrated device, it is essential to demonstrate spin wave interferometers using spatially isotropic spin waves with high operational stability. However, spin wave reflection at the waveguide edge has previously limited the stability of interfering waves, precluding the use of isotropic spin waves, i.e., forward volume waves. Here, a spin wave absorber is demonstrated comprising a yttrium iron garnet waveguide partially covered by gold. This device is shown experimentally to be a robust spin wave interferometer using the forward volume mode, with a large ON/OFF isolation value of 13.7 dB even in magnetic fields over 30 Oe.
A spin wave (SW) is a radio frequency (rf) collective excitation of the magnetic moments in a magnetic mate-rial, a magnetic counterpart of elastic waves. The transmission properties of SWs can be extensively modulated depending on the strength of the bias magnetic field, the waveguide material and the geometry1,2. This
ena-bles engineering of arbitrary band structures for carrier signals in the several-GHz range. These unique prop-erties have been widely used to design passive radio frequency elements, including tunable filters3 and delay
lines4. However, the most important feature of SWs is their propagation without charge transport. Thus SWs
have attracted attention because they offer a new paradigm for information processing in which Joule loss and its accompanying heat generation is expected to be extremely small. Therefore, SWs could be used to represent information in beyond-CMOS devices5. To develop logic circuits based on SWs, active control of SW flow is
required. Recently, a variety of systems showing spin dynamic effects6–12 and artificially designed structures13–18
manipulating the local magnetic moments have been investigated. These novel systems have motivated the crea-tion of magnonics as a research field that addresses transport, storage and processing informacrea-tion using SWs19,20.
A significant feature of SWs compared to other information carriers is the usefulness of their phase information, which can be easily manipulated in logic operations. Therefore a SW interferometer is an essential component for realization of logic devices21–23.
Yttrium iron garnet (YIG) is suitable for SW waveguides because of its low magnetic damping and low out-of-plane saturation magnetic field24–28. Magnons can therefore conserve their phase information over long
distances in a YIG waveguide. Yu et al. recently experimentally observed SW propagation over 600 μm using a 20 nm-thick YIG waveguide with in-plane magnetization29. Not only the attenuation length, but also the
magnet-ization configuration is crucial in determining the propagation mode of the SW. Unlike backward volume (BV) and Damon-Eshbach (DE) SWs with in-plane magnetization, forward volume (FV) SWs with out-of-plane mag-netization can propagate through waveguides in arbitrary directions30. This isotropy of the FV SWs makes them
suitable for integrated devices. However, the isotropic wave also generates extra standing waves which disrupt the control of the SW flow. In this work a SW absorber comprising a metallized YIG waveguide31 was designed and
fabricated for the FV mode based on numerical results, and a SW interferometer was demonstrated with high operational stability.
1Department of Electrical and Electronic Information Engineering, Toyohashi University of Technology, 1-1
Hibari-Ga-Oka, Tempaku, Toyohashi, Aichi 441-8580, Japan. 2JST, PRESTO, 4-1-8 Honcho, Kawaguchi, Saitama, 332-0012,
Japan. 3Department of Physics, Keio University, Yokohama 223-8522, Japan. 4Faculty of Physics, Moscow
State University, Leninskie Gory, Moscow 119992, Russia. 5Department of Materials Science and Engineering,
Massachusetts Institute of Technology, 77 Massachusetts Avenue, Cambridge, Massachusetts 02139, USA. Correspondence and requests for materials should be addressed to N.K. (email: [email protected]) or T.G. (email: [email protected])
Received: 05 January 2016 Accepted: 17 June 2016 Published: 22 July 2016
www.nature.com/scientificreports/
Results and Discussion
Concept and experimental setup.
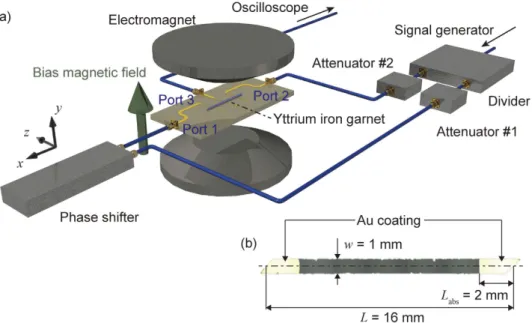
Figure 1 illustrates the setup for the two-input phase interferome-ter. Two independent SWs were injected into the waveguide and the interference was investigated via inductive coupling to an external rf circuit. In-phase inputs gave an amplified output and anti-phase inputs gave an atten-uated output, which provided two states corresponding to binary ‘1’ and ‘0’. A partially metallized 18.4 μ m thick monocrystalline YIG film was used as a SW waveguide (see ‘Methods’ for sample details). This YIG waveguide was magnetized out of plane by an electromagnet, and fixed on top of three 50 μ m width microstrip lines (MSLs). SWs were excited from ports 1 and 2, and the resulting SW was detected at port 3. The distances between ports 1, 2, and 3 were 5 mm. The MSLs were driven at a frequency of 4.0 GHz to excite a FV SW. The initial phase offset for port 1 was controlled by a mechanical phase shifter. The amplitude of the injected signal was 200 mV, controlled by attenuators. The temperature of the waveguide fixture was 40 °C ± 0.2 °C.Dispersion curve for non-magnetic metal (NM)/ferromagnetic material (FM) structure.
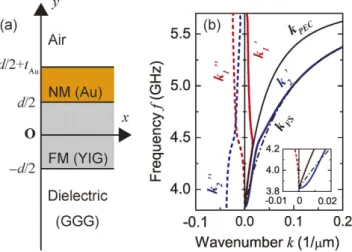
To esti-mate the optimum range of frequencies and applied bias fields at which the Au layer operates as an absorber, the dispersion curve was calculated using the two dimensional infinite slab model shown in Fig. 2a. With YIG as a FM and Au as a NM, we obtained the dispersion curve using the model for effective boundary conditions (see ‘Methods’ section for theoretical details):µ µ µ µ µ = −+ Γ +Γ + +− Γ −Γ − kd k k k k exp(2 ) 11 (( 1)1) (( 1)1) (1) m m Γ = − + − k k k k exp( 2k t ) (2) m m m Au δ = + km2 k2 j2 (3)
Here, k(ω) is the wavenumber of the FV SW in the Au/YIG structure, μ(ω) is the permeability of the YIG layer,
δ(ω) is the skin depth of the Au layer at the frequency ω, and d = 18.4 μ m and tAu = 30 nm are the thicknesses of
the YIG layer and the Au layer, respectively. Figure 2b shows the dispersion curves k(ω) calculated by equation (1) with the following set of parameters: the external magnetic field H0 = 3050 Oe, the demagnetization field
Hd = 1682 Oe, the saturation magnetization of the YIG layer 4πMS = 1760 G, Gilbert damping constant
α = 2.35 × 10⁻⁴ for the YIG layer, the conductivity of Au σ
Au = 4.1 × 10⁷ Sm−1. The solution exhibited
hybridiza-tion of SW modes labeled as = ′ + ″k1 k1 jk1 and = ′ + ″k2 k2 jk2. In Fig. 2b, at the lower frequencies, mode k1
resembles kPEC, the case of a perfect electric conductor, (i.e. σAu → ∞ ). Mode k2 resembles kFS, the case of a free
slab (i.e. σAu → 0). These results therefore show that the rf field penetrating the thin Au layer allows the existence
of k2 which behaves like kFS. Based on these results, the working frequency was fixed at 4.0 GHz at which both k1≈
kPEC and k2 ≈ kFS were present.
Figure 1. Setup for FV SW interferometer. (a) Experimental system. Port 1 and port 2 are injection ports.
Port 3 is the detection port. (b) Top view of the SW waveguide, which was cut into a parallelogram with length
L = 16 mm and width w = 1 mm. Both ends of the YIG waveguide were covered with 30 nm thick gold to absorb
www.nature.com/scientificreports/
Design of SW absorber.
To design the length and the thickness of the Au layer of the SW absorber, the behavior of the SW was calculated by a finite element method (FEM) using the model shown in Fig. 3a. Both edges of the YIG were treated as having a non-reflective boundary condition. The YIG thickness was 18.4 μ m and the Au thickness was tAu = 1, 30 or 100 nm. A SW was excited by the MSL, and its spatial decay in the continuousslab of Au/YIG was calculated (see ‘Methods’ section). Figure 3b gives the amplitude of the SW (i.e., the magnet-ization mx along the + k direction) as a function of the distance from the edge of the MSL. When tAu = 1 nm and
30 nm, the SW decayed more rapidly and the period of oscillation increased monotonically as tAu increased. (The
mechanism for this is discussed in the next section.) Simulated wave profiles can be expressed by = − ω −
mx m ex0 x L/ atte ej t jkx where mx0 is the amplitude of magnetization beneath the MSL, Latt is the attenuation
length and ω is the precession frequency. For tAu = 1, 30, and 100 nm, Latt was evaluated as 1.5 mm, 1.7 mm, and
Figure 2. Dispersion curve of Au/YIG system. (a) Two dimensional infinite slab model used in the
calculation. From the top, there is air above y = d/2 + tAu, nonmagnetic metal (NM, Au) between y = d/2 + tAu
and d/2, ferromagnet (FM, YIG) between y = d/2 and − d/2, and dielectric material (gadolinium gallium garnet, GGG) below y = − d/2. (b) Calculated dispersion curves for the Au/YIG system. Dashed black line shows the mode kFS representing the dispersion curve of a free slab without an Au layer. kPEC shown by the bold black line
is that of a slab metallized by a perfect electrical conductor. Other lines are dispersion curves calculated for a slab metallized by 30 nm thick Au. Bold lines show the real part of the wavevectors ′k1 and ′k2. Bold dotted lines show the imaginary part of the wavevectors ″k1 and ″k2.
Figure 3. Simulation of magnetization in a pseudo-infinite Au/YIG slab. (a) Simulation model for FEM
calculation. An infinite Au/YIG slab as shown in Fig. 2a was assumed along the x-direction. Edge reflection was totally cancelled by absorption boundaries colored in blue, in which a higher Gilbert damping of α = 7.0 × 10⁻³
was set. (b) Magnetization precession amplitude along the + k direction for different Au thicknesses. The spatial distribution of magnetization mx was extracted within 10 mm of the MSL edge.
www.nature.com/scientificreports/
3.4 mm, respectively. To suppress SW reflection, the length of the SW absorber Labs should be longer than Latt,
which leads to a smaller device when the Au is thinner.
Mechanism of SW absorption using Au film.
Figure 4 shows the wavelength and the attenuation length of the FV SW vs. Au thickness for SWs propagating in the Au/YIG structures. The theoretical values of the wave-length and the attenuation wave-length calculated from equation (1) are overlaid on the results of FEM calculation using the following relationships32: λ1 = 2π/Re(k1), λ2 = 2π/Re(k2), Latt1 = 1/Im(k1), Latt2 = 1/Im(k2). The results
of the FEM calculations involved contributions from both modes k1 and k2 predicted by equation (1). Hence it is
important to understand the behavior of each mode to design the SW absorber. The results of FEM calculations matched k1 when tAu > 30 nm and k2 when tAu < 5 nm, and exhibited intermediate values between these
thick-nesses, where k1 and k2 mixed to form a hybrid mode. This explains why the spatial period of the magnetization
oscillation increased with the Au thickness in Fig. 3b as the propagation mode gradually transitioned from k2 to
k1 through the hybrid state. The wavelength of SWs is usually extended in metallized waveguides33. In Fig. 4b,
the shortest attenuation length occurred around tAu ~ 6 nm where k1 and k2 were strongly hybridized, i.e. the
hybridization attenuates the SW. Outside the hybrid region, i.e. tAu < 5 nm or tAu > 30 nm, the attenuation length
increased. The Au thickness should be chosen to excite strong hybridization, leading to a choice of Au thickness below about 30 nm to get Latt below ~2 mm.
Suppression of reflected SWs at the edge.
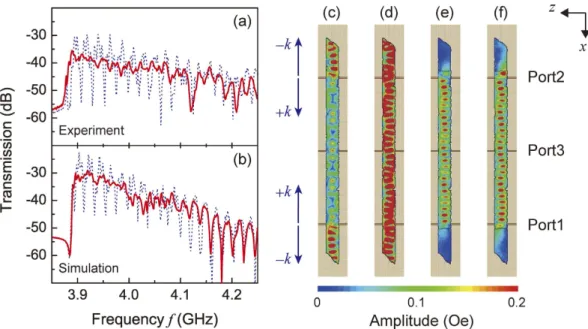
A SW waveguide was fabricated comprising a 30 nm thick, 2 mm long Au layer deposited on each end of an 18.4 μ m thick, 16 mm long YIG crystal with tapered edges, and transmission spectra between ports 1 and 3 were measured (Fig. 5a). Clearly the transmission ripples, which are due to the reflected SWs at the edge of the waveguide, were suppressed by the SW absorber compared with that of a bare YIG waveguide, in reasonable agreement with the calculated results shown in Fig. 5b. Transmission ripples observed at frequencies higher than 4.1 GHz were due to modes in the width direction, and the differences between the experimental results and simulations in this frequency range may be attributed to the inhomogeneity of the demagnetization field. The effects of the reflected SWs can be visually understood by examining the SW distribution calculated using FEM for the shape of the particular waveguide used in the experiment. Figure 5c–f show the calculated spatial amplitude distribution when the same SW was injected from Port 1 and 2, without (Fig. 5c,d) and with (Fig. 5e,f) the Au. The SW amplitude corresponds to a perturb-ing magnetic field |hx| = |− ∇ xϕ|∝ |ϕ|, derived using the magnetostatic approximation (the scalar potential ofthe SW was expressed by ϕ=ϕej t kxω −
0 ( ), where t is time). In the case of a waveguide without Au, the strong Figure 4. Calculated transmission properties of Au/YIG waveguide with different Au thicknesses.
(a) Au thickness dependence of wavelength. Red bold line λ1 and blue dot line λ2 correspond to the wavelengths
of modes k1 and k2 denoted in Fig. 2b. Open squares show the wavelengths obtained by the FEM calculation
in Fig. 3. Green broken lines λFS, λPEC show that of the free slab and the slab metallized by a perfect electric
conductor. (b) Au thickness dependence of attenuation length. Red bold line Latt 1 and blue dot line Latt 2
correspond to modes k1 and k2. Open circles are the results of the FEM calculation with error bars from the
www.nature.com/scientificreports/
reflected SWs produced a qualitatively different amplitude distribution between frequency f = 3.998 GHz (bot-tom of ripple, Fig. 5c) and f = 4.001 GHz (top of ripple, Fig. 5d). In contrast, in the presence of the Au absorber, the difference between the amplitude distributions was small (Fig. 5e,f), due to the suppression of reflected SWs.
FV SW Interference.
Figure 6 shows the experimental demonstration of a SW interferometer using FV modes at an operating frequency of 4.0 GHz. A fixed bias magnetic field of H0 = 3050 Oe was appliedperpendic-ular to the film and the SW wavelength was estimated to be about 780 μ m from the dispersion curve2. The input
voltage was 200 mV for ports 1 and 2 and the output was measured at port 3.
For the device without Au, when the phase difference ξ between the injected waves was zero, construc-tive interference of the SWs led to a high output amplitude of Vpp = 9.56 ± 0.24 mV (the error represents the
Figure 5. SW propagation in a two port interferometer. (a) Transmission properties from port 2 to
port 3 in experiment under a bias magnetic field of H0 = 3050 Oe. (b) Simulated under an effective field of
H0 − Hd = 1368 Oe. Blue dashed lines and red bold lines show transmission behavior without and with the
Au absorber, respectively. (c) Distribution of the SW amplitude without the Au absorber at a frequency
f = 3.998 GHz corresponding to a ripple bottom, and (d) at f = 4.001 GHz corresponding to a ripple top; (e) SW
amplitude at 3.998 GHz and (f) at 4.001 GHz for the Au/YIG structure. The color represents SW amplitude. Wavenumbers + k and − k are defined as inward and outward flow at port 3.
Figure 6. Phase interference properties of FV SW interferometer. Amplitude of the superposed output
wave Vpp detected at port 3 versus the phase difference ξ between two injected waves, for YIG without Au (blue
triangles) and with an Au coating (red circles). Error bars correspond to the standard deviations of five repeated measurements.
www.nature.com/scientificreports/
standard deviation of five measurements). When ξ = π, the interference was destructive and the amplitude was
Vpp = 3.04 ± 0.25 mV. Consequently the isolation ratio, defined as the ratio of these amplitudes, was 9.95 dB.
In contrast, an Au/YIG waveguide showed a higher isolation value of 13.7 dB. The output amplitude was smaller than that of the bare YIG because of the decreased amount of reflected SWs at the edges of waveguides, but this increased the robustness of the output with respect to variations in the external magnetic field. Figure 7 shows the magnetic field dependence of the output amplitude of interfering SWs in Au/YIG and YIG devices. In a practical situation, the drift of the magnetic field is likely to be less than 10 Oe, comparable with the case of using a samarium cobalt magnet to magnetize a YIG waveguide around room temperature (25–35 °C)34. In this
measurement, the bias magnetic field was swept from 3035 Oe to 3065 Oe in 1 ± 0.1 Oe steps, while the phase difference ξ was fixed at π or 0. The averaged amplitude at ξ = π was denoted as “OFF” and that at ξ = 0 was “ON”. In both Fig. 7a,b, the drift in the OFF level was small because the interfering SWs were cancelled regardless of the bias magnetic field and existence of absorbers, whereas notable periodic oscillations in the ON level were caused by the transmission ripples exhibited in Fig. 5a. The standard deviation of the output signal within the measured magnetic field range from 3035 Oe to 3065 Oe was denoted as σON and σOFF. Values of σON = 3.48 mV
and σOFF = 0.56 mV were found for the waveguide without Au coating, compared to σON = 0.50 mV and
σOFF = 0.40 mV in the presence of the Au, shown in Fig. 7b. Colored areas indicate σON and σOFF. Without Au,
the discrimination between ON and OFF levels was only 0.85 mV, whereas the Au/YIG device showed ON and OFF levels well separated by 4.14 mV, which exceeded the standard deviation of the output signal. These results indicate that a SW interferometer with an edge absorber comprising an Au/YIG structure ensured a robust and reliable operation over a magnetic field range of tens of Oe, a significant advance towards the practical implemen-tation of FV SW logic devices. For further miniaturization and integration of such a device, the contribution of electromagnetic noise may be non-negligible and further improvement of the amplitude ratio between ON and OFF states will be significant. This will be achieved by replacing MSLs with nanoscale coplanar waveguides with a meander structure, in which direct waves between antennas are diminished and FV SWs are efficiently excited.
Conclusion
We experimentally demonstrated a FV SW phase interferometer based on a low damping YIG waveguide. An Au SW absorber suppressed SW reflection from the ends of the device and increased the signal to noise ratio such that the ON and OFF output signals are well discriminated even for significant variations in the bias magnetic field. The SW propagation and interference in the waveguide was analyzed with a finite slab model and three dimensional FEM calculations, which enabled the device geometry to be designed. Excitation of a hybrid SW mode at intermediate Au thicknesses was essential for stable operation of SW interferometers. Interference of two input SWs produced a binary output with a large amplitude ratio of 13.7 dB between ON and OFF states. The SW interference was comparable with other SW interferometers using BV or DE SW modes21–23, but unlike the other
SW modes, the use of FV SWs has great benefits for the circuit integration because of the spatial isotropy of wave propagation. This study represents the first important step for building ultralow-power integrated circuits while taking advantage of both the low damping of YIG waveguides and the isotropic propagation of FV SWs.
Methods
Sample preparation and characterization.
Our SW waveguide comprised an 18.4 μ m-thick YIG, which was grown on a gadolinium gallium garnet (GGG) substrate by liquid phase epitaxy. The surface of the waveguide was polished to yield a roughness Ra = 0.4 nm so that resonant coupling with a perpendicular standing SW wasFigure 7. Robustness of operation against magnetic field disturbance. Red squares show the superposed
output amplitudes when the injected waves are in-phase (“ON”), and blue open circles show the outputs for anti-phase injected waves (“OFF”), for the device (a) without and (b) with an Au absorber. The width of the colored band represents the standard deviation. Error bars correspond to the standard deviations of five repeated measurements at one field.
www.nature.com/scientificreports/
reduced. The YIG wafer was cut into L = 16 mm by w = 1 mm with 45° tapered edges formed by dicing. Both ends of the YIG waveguide were covered by a 30 nm thick continuous Au film, with Ra = 0.4 nm, deposited by rf
magnetron sputtering (Shimazu, HSR-551). The Ra values were measured by stylus profilometer (Ryokosha Corp.,
ET4000).
The Gilbert damping factor α of the film was evaluated by a standard vector network analyzer (VNA)–ferro-magnetic resonance (FMR) setup35. The YIG specimen was cut into a 1.3 mm by 1.3 mm square and placed on a
50 Ω matched microstrip-through line with a length of 40 mm. A bias magnetic field H0 was applied
perpendicu-lar to the film plane, and scattering parameters were measured by the VNA (Anritsu 37347C). Then the permea-bility around the resonance peak was calculated and its line width Δ f was obtained. In general, the measured line width Δ f is composed of two contributions: intrinsic damping α and extrinsic damping Δ H036,
γ α
∆ = ∆f H0+2 fr, (4) where γ = 2.8 MHz/Oe is the gyromagnetic ratio and fr is the FMR frequency. Extrinsic damping is considered
as an extra contribution from, for example, inhomogeneity of the rf excitation field from the microstrip-through line. Such extrinsic contributions were eliminated by extracting the slope of Δ f vs. fr. The FMR frequency was
swept from 3 GHz to 4 GHz by changing the bias magnetic field H0 from 2760 Oe to 3140 Oe in 20 Oe steps. The
intrinsic damping of the YIG film was estimated as α = 2.35 × 10⁻⁴. This value was used in all calculations in this
study. In addition, spin pumping at the Au/YIG boundary provided another contribution to the damping. The extra damping αsp from spin pumping was estimated from the formula37
α µ π = g ↑↓ M g d 4 1 , (5) sp B S
where g = 2 is the Landé g-factor, μB = 9.274 × 10⁻²¹ erg/G is the Bohr magneton, 4πMS = 1760 G is the
satura-tion magnetizasatura-tion of YIG, g↑↓ = 1.2 × 1014 cm−2 is the spin mixing conductance at the Au/YIG boundary38 and
d = 18.4 μ m is the thickness of YIG. The estimated αsp = 6.87 × 10⁻⁷ was much smaller than the intrinsic damping
because the YIG film was thick, and the spin pumping contribution was therefore neglected.
Calculation of dispersion curve.
In the calculation of dispersion curve shown in Fig. 2, we used a state vector (hx, by) where hx is the x-component of the magnetic field perturbation and by is the y-component of themagnetic flux perturbation39. Since the slab is homogeneous along the z-direction, ∂ /∂ z = 0 for all layers. At each
boundary, the continuity of the state vector was ensured. The magnetostatic approximation ∇ × h = 0 was applied except for the NM layer1. In the other layers, the SW can be expressed in the form of a scalar potential
ϕ= ϕ +ϕ ω
+e −e− e −
( ky ky) j t kx( ) with eigenvalues ϕ
+ and ϕ−. The values of hx and by were obtained from
hx = − ∇ xϕ and by = [− μ∇ ϕ]y where μ is the permeability tensor when the mean magnetization is along the
y-direction. In the NM layer, a quasi-steady approximation was used to consider the effect of the finite
conductiv-ity σNM. The state vector in this layer was obtained by solving ∇ × h = σNME for hx and hy, where E is the electric
field. The magnetic flux by (G) is numerically equal to hy (Oe) because the layer is defined as non-magnetic.
Solving the set of equations for the eigenvector (ϕ+, ϕ−) gave a characteristic equation, a function of wavenumber
k and frequency ω, and the non-trivial solution for the eigenvector determines the dispersion curve. The
demag-netization field Hd = 1682 Oe was obtained by the fitting of the measured phase spectrum of the propagating FV
SW θ = − kLp as a function of ω and H0 under the bias magnetic field H0 = 3050 Oe with a propagation length
Lp = 10 mm. The wavenumber k in the YIG waveguide (free slab) can be calculated by substituting tAu = 0 or
δ → ∞ (meaning σAu → 0) into equation (1). This nonlinear dispersion equation was numerically solved by the
Levenberg-Marquardt method in MATLAB.
Estimation of the attenuation length.
ANSYS HFSS version 15 was used for the simulation shown in Fig. 3 and parts of Fig. 4. The simulation model was composed of a 1 mm-wide and 30 mm-long Au/YIG multi-layer with the YIG in contact with the MSL. To realize an infinite slab in the FEM calculation, edge reflection was excluded. The magnetic damping of YIG at both waveguide edges was set to a large α = 7.0 × 10⁻³ to eliminate anyreflected waves (blue colored region in Fig. 3a). This is a convenient way to investigate the pure SW transmission properties in Au/YIG multilayers. The spatial distribution of the x-axis component of the magnetization mx was
then calculated for various Au layer thicknesses. The distribution of the amplitude was extracted at the central width of the waveguide. The spatial decay of the envelope of magnetization mx along + k was fitted to exp (− x/Latt)
which yielded the attenuation length Latt. The wavenumber k was evaluated by Fourier transformation of the
spatial oscillation of mx.
References
1. Stancil, D. Theory of magnetostatic waves. (Springer New York, 1993).
2. Gurevich, A. G. & Melkov, G. A. Magnetization oscillations and waves. (CRC Press New York, 1996). 3. Sethares, J. C. Magnetostatic wave devices and applications (invited). J. Appl. Phys. 53, 2646 (1982).
4. Adam, J. D. & Collins, J. H. Microwave magnetostatic delay devices based on epitaxial yttrium iron garnet. Proc. IEEE 64, 794–800 (1976).
5. Vogel, E. Technology and metrology of new electronic materials and devices. Nat. Nanotechnol. 2, 25–32 (2007).
6. Kajiwara, Y. et al. Transmission of electrical signals by spin-wave interconversion in a magnetic insulator. Nature 464, 262–266 (2010).
7. Uchida, K. et al. Observation of the spin Seebeck effect. Nature 455, 778–781 (2008).
8. Uchida, K. et al. Generation of spin currents by surface plasmon resonance. Nat. Commun. 6, 5910 (2015). 9. Vlaminck, V. & Bailleul, M. Current-induced spin-wave Doppler shift. Science 322, 410–413 (2008).
10. Miron, I. M. et al. Current-driven spin torque induced by the Rashba effect in a ferromagnetic metal layer. Nat. Mater. 9, 230–234 (2010).
www.nature.com/scientificreports/
11. Moon, J. H. et al. Spin-wave propagation in the presence of interfacial Dzyaloshinskii-Moriya interaction. Phys. Rev. B 88, 1–6 (2013).
12. Demokritov, S. O. et al. Bose-Einstein condensation of quasi-equilibrium magnons at room temperature under pumping. Nature 443, 430–433 (2006).
13. Demidov, V. E. et al. Spin-current nano-oscillator based on nonlocal spin injection. Sci. Rep. 5, 8578 (2015). 14. Neusser, S. & Grundler, D. Magnonics: Spin waves on the nanoscale. Adv. Mater. 21, 2927–2932 (2009).
15. Tacchi, S. et al. Universal dependence of the spin wave band structure on the geometrical characteristics of two-dimensional magnonic crystals. Sci. Rep. 5, 10367 (2015).
16. Parkes, D. E. et al. Magnetostrictive thin films for microwave spintronics. Sci. Rep. 3, 2220 (2013).
17. Maruyama, T. et al. Large voltage-induced magnetic anisotropy change in a few atomic layers of iron. Nat. Nanotechnol. 4, 158–61 (2009).
18. Chumak, A. V., Serga, A. A. & Hillebrands, B. Magnon transistor for all-magnon data processing. Nat. Commun. 5, 4700 (2014). 19. Kruglyak, V. V., Demokritov, S. O. & Grundler, D. Magnonics. J. Phys. D. 43, 264001 (2010).
20. Chumak, A. V., Vasyuchka, V. I., Serga, A. A. & Hillebrands, B. Magnon spintronics. Nat. Phys. 11, 453–461 (2015).
21. Kostylev, M. P., Serga, A. A., Schneider, T., Leven, B. & Hillebrands, B. Spin-wave logical gates. Appl. Phys. Lett. 87, 153501 (2005). 22. Rousseau, O. et al. Realization of a micrometre-scale spin-wave interferometer. Sci. Rep. 5, 9873 (2015).
23. Sato, N., Sekiguchi, K. & Nozaki, Y. Electrical demonstration of spin-wave logic operation. Appl. Phys. Express 6, 063001 (2013). 24. Serga, A. A., Chumak, A. V. & Hillebrands, B. YIG magnonics. J. Phys. D. 43, 264002 (2010).
25. Onbasli, M. C. et al. Pulsed laser deposition of epitaxial yttrium iron garnet films with low Gilbert damping and bulk-like magnetization. APL Mater. 2, 106102 (2014).
26. Sun, Y. et al. Growth and ferromagnetic resonance properties of nanometer-thick yttrium iron garnet films. Appl. Phys. Lett. 101, 152405 (2012).
27. Liu, T. et al. Ferromagnetic resonance of sputtered yttrium iron garnet nanometer films. J. Appl. Phys. 115, 17A501 (2014). 28. Kahl, S. & Grishin, A. M. Pulsed laser deposition of Y3Fe5O12 and Bi3Fe5O12 films on garnet substrates. J. Appl. Phys. 93, 6945 (2003).
29. Yu, H. et al. Magnetic thin-film insulator with ultra-low spin wave damping for coherent nanomagnonics. Sci. Rep. 4, 6848 (2014). 30. Klingler, S. et al. Spin-wave logic devices based on isotropic forward volume magnetostatic waves. Appl. Phys. Lett. 106, 212406
(2015).
31. Adam, J. D. YIG film characterization for MSW devices. Circuits, Syst. Signal Process. 4, 105–113 (1985).
32. Vlaminck, V. & Bailleul, M. Spin-wave transduction at the submicrometer scale: Experiment and modeling. Phys. Rev. B 81, 014425 (2010).
33. Vysotskii, S. L., Beginin, E. N., Nikitov, S. A., Pavlov, E. S. & Filimonov, Y. A. Effect of ferrite magnonic crystal metallization on Bragg resonances of magnetostatic surface waves. Tech. Phys. Lett. 37, 1024–1026 (2011).
34. Adam, J. D. A Temperature stabilized magnetostatic wave device. In MTT-S International Microwave Symposium Digest 79, 160–161 (1979).
35. Bilzer, C. et al. Vector network analyzer ferromagnetic resonance of thin films on coplanar waveguides: Comparison of different evaluation methods. J. Appl. Phys. 101, 074505 (2007).
36. Yu, H. et al. High propagating velocity of spin waves and temperature dependent damping in a CoFeB thin film. Appl. Phys. Lett. 100, 262412 (2012).
37. Sun, Y. et al. Damping in yttrium iron garnet nanoscale films capped by platinum. Phys. Rev. Lett. 111, 106601 (2013). 38. Heinrich, B. et al. Spin pumping at the magnetic insulator (YIG)/normal metal (Au) interfaces. Phys. Rev. Lett. 107, 1–4 (2011). 39. De Wames, R. E. Characteristics of magnetostatic surface waves for a metalized ferrite slab. J. Appl. Phys. 41, 5243 (1970).
Acknowledgements
This work was partly supported by the Japan Society for the Promotion of Science (JSPS) Grants-in-Aid for Scientific Research (No. 26220902, No. 26706009, No. 26600043). T.G. acknowledges the Murata Science Foundation. K.S. acknowledges JSPS Grants-in-Aid for Scientific Research (No. 25706004, No. 16H02098, No. 16K13670). N.K. acknowledges the Grants-in-Aid for JSPS Fellows No. 15J07286.
Author Contributions
N.K., T.G., H.T., Y.N. and M.I. planned the experiment and designed the sample. N.K. and K.S. constructed the experimental setup. N.K. and T.G. conducted the experiments and analyzed the results. N.K., A.G. and C.R. developed the theoretical analysis. All authors discussed the results and wrote the manuscript.
Additional Information
Competing financial interests: The authors declare no competing financial interests.
How to cite this article: Kanazawa, N. et al. Demonstration of a robust magnonic spin wave interferometer. Sci.
Rep. 6, 30268; doi: 10.1038/srep30268 (2016).
This work is licensed under a Creative Commons Attribution 4.0 International License. The images or other third party material in this article are included in the article’s Creative Commons license, unless indicated otherwise in the credit line; if the material is not included under the Creative Commons license, users will need to obtain permission from the license holder to reproduce the material. To view a copy of this license, visit http://creativecommons.org/licenses/by/4.0/