Density Minimization at 250 Water Street: A Financial Perspective
by
Liliana M. W. Ponti
Bachelor of Architecture, University of Belgrade, 1977 Master of Architecture, University of California at Berkeley, 1995
Submitted to the Department of Architecture in Partial Fulfillment of the Requirements for the Degree
Master of Science in Real Estate Development at the
Massachusetts Institute of Technology September, 1997
C 1997 Liliana M. W. Ponti All rights reserved
The author hereby grants to MIT permission to reproduce and to distribute publicly, paper and electronic copies of this thesis document, in whole, or in part.
Signature of A uth or... ... ... Department of Architecture
August 12, 1997
Certified by...,.... ...
W. T-dMcGrath Lecturer, Department of Urban Studies and Planning
Thesis Supervisor
A ccepted by ... . . . William C. Wheaton Chairman, Interdepartmental Degree Program in Real Estate Development
',".p1
6 1997
Density Minimization at 250 Water Street: A Financial Perspective
By
Liliana M. W. Ponti
Submitted to the Department of Architecture in Partial Fulfillment of the Requirements for the Degree
Master of Science in Real Estate Development
ABSTRACT
A financial model is constructed for a proposed apartment complex within the South Street Seaport Historic District in New York City, to argue that a smaller scale development than proposed can still be profitable. This paper discusses the parameters of the proposed
development, addresses the rationale for the project, and examines the various influences that impact its financial viability.
The problem of density minimization requires a careful comparison of investment profitability at different density levels. Sensitivity analysis is required to identify the relevant
variables and threshold values that most affect profitability at different densities.
The focus of this analysis is to solve for the minimum justifiable density; that is, to identify that minimum level of density which will enable a developer to earn an appropriate risk-adjusted return for the redevelopment of the one-acre site which is currently a parking lot. This analysis indicates that a density of 400,000 square feet (as opposed to the proposed density of approximately 480,000) will enable the developer to earn an appropriate risk-adjusted return
(12.5% after taxes).
Thesis advisor: W. Tod McGrath
for my son Jonathan
Special thanks for this thesis must go to Tod Mc Grath for his patience, guidance, encouragement, and discipline. I also wish to convey my thanks and appreciation to the developers in New York City, for their help and guidance. Without them this paper would not
TABLE OF CONTENTS CHAPTER ONE... ... 5 Introduction...5 CHAPTER TWO...10 M ethodology...- - - - -- - --...10 I. Market Analysis...10
History of Lower Manhattan... 11
Residential market in Lower Manhattan...12
Supply and demand of the Manhattan apartment market... ..-13
Lower Manhattan residential competition...13
Rent Comparables in the Lower Manhattan market. ... ... 15
Political climate, public support and/or opposition to project...19
II. Financial Analysis Model...20
Capital budget...21
Proforma or set-up...24
Valuation and return measures...30
CHAPTER THREE...36
Results of Analysis...36
CHAPTER FOUR...39
Conclusion...39
Appendix A: Residential Conversion Programfor Lower Manhattan...42
CHAPTER ONE
Introduction
There are many things that motivate a developer to choose to develop existing land. Although economic benefits are the primary incentive for the development, a project's aesthetic and functional potential may offer a desirable professional reward even if a smaller scale project with minimum density is chosen. In particular, if mixed with surrounding buildings of various ages, styles, and similar scale, a project may add interest to a neighborhood and enhance the character of an area.
The nature of a development project depends upon the property and the site in question. For example, registered historic areas impose unique requirements, while non-historic
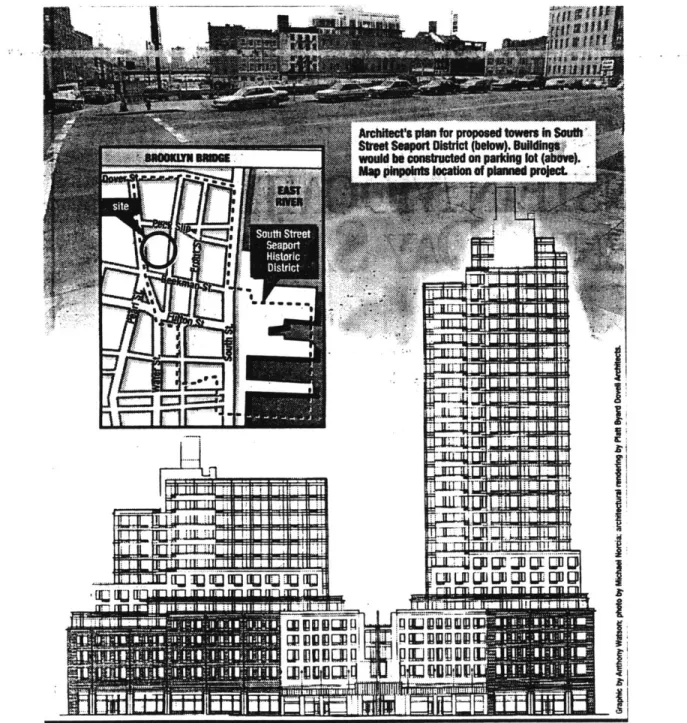
metropolitan areas tend to be more demand-responsive, depending upon physical condition and projected end uses. Blending a proposed up-scale development with existing smaller scale landmark buildings in a historic district, may change the original physiognomy of the area. This may have a major impact on area residents. In this regard, the site at 250 Water Street in New York ( Figure 1.) has been a source of discord for more than 10 years.
This 48,000-square foot tract, currently a 250-space parking lot, is the largest
undeveloped site in Lower Manhattan. A trapezoidal parcel, it lies within the periphery of the South Street Seaport Historic District. It is located between Peck Slip on the north, Water Street on the east, Beekman Street on the south and Pearl street on the west. Since 1983, 10 designs for development of this site have been rejected.
NEW Wj~
For more than a decade, the owner, Milstein Properties, has wanted to develop large commercial towers there, but all their designs have been unacceptable to the Landmarks
Preservation Commission, because they are not appropriate in a historical setting. In 1991, when the developer offered to erect an 1 1-story building instead of the original 43-story building he had proposed, the commission accepted his project. Unfortunately, at that point, the economy intervened and prevented development.
Today the Wall Street area is becoming a residential community. The developer now wants to build a modem apartment complex with a 14 and a 30-story tower ( Figure 2.). This proposal would dramatically impact the neighborhood. The area residents have been opposed to the project from the very beginning, but to no avail. Upset about this building's size, they find it hard to believe that the developer is still trying to build another incongruous high-rise building in that location.
The appointees of Mayor Giuliani, known to favor development in the area, may well approve the $90 million, 480,000-square-foot project. If they do, it will be the first unsubsidized rental housing project in Lower Manhattan in 25 years. As an alternative, the Seaport
Community Coalition, an organization of area residents, has commissioned a study of a low-rise 250,000-square-foot building to replace the developer's proposed design. This was presented to the Landmarks Commission this summer, in the hopes that the committee would agree that there are other possibilities, and that a smaller-scale development can still be profitable (Jacobs, 1997).
An economic model is required to ensure that this project's end result is attractive and functional. By analyzing the different sources of data, this thesis discusses the economics of density needed to derive a minimum density, a problem which requires a comparison of profit at different density levels. Thus, a sensitivity analysis is necessary to pinpoint the variables that
nost affect profitability at different density levels.
The second chapter demonstrates how to solve this problem through a framework of analysis. The methodology focuses on the evaluation of its economics, illustrated by market and financial feasibility analysis models, and financial rewards in relation to risk, investment, and other factors.
Chapter three discusses the results of discounted cash flow analyses and sensitivity analyses which are derived through the mechanics of all outlined steps. In creating this model, a knowledge of product and market is fundamental to sound investment analysis.
Chapter four concludes that a 400,000- square-foot development will enable the
developer to earn an appropriate risk-adjusted return of 12.5 % after taxes. It also addresses the various elements that impact the project's financial feasibility.
CHAPTER TWO
Methodology
I. Market Analysis.
The purpose of market analysis is to review all data necessary to enable a developer to make an informed investment decision on a proposed project. It is essential to identify the target market to measure its sources of demand and supply, the operating results for comparable projects, the relative attractiveness of the project, and its possible absorption given market vacancy.
The developer of this large residential project in Lower Manhattan will need to
commission a thorough market study of it in order to assess current marketability. This should take into account the aesthetic characteristics of the properties and the surrounding area, the quality of services provided to tenants, the optional type and size of units, the income and employment of the population, and other population statistics relative to the number of families and family size.
By surveying larger projects it is possible to identify what type of products are in demand, the extent of available supply, and the profiles of typical consumers. Certain area groups, including banks, the Department of City Planning, consultants, and real estate brokers in the area of Lower Manhattan, maintain a high level of information on present market conditions.
The data on the Downtown Manhattan and Lower Manhattan residential market in this study are obtained from area studies by the Alliance for Downtown New York, Hamilton, Rabinovitz & Alschuler, and Cushman &Wakefield.
The market study includes the following areas:
" History of Lower Manhattan;
* Residential market in Lower Manhattan;
* Supply and demand in the Manhattan apartment market; " The Lower Manhattan residential competition;
e Rent Comparables in the Lower Manhattan market; and
* Political climate, public support, and/or opposition to the project.
History of Lower Manhattan
Manhattan has for several centuries been a major economic center. Wall Street,
originally the location of a defensive city wall, is now world-famous as a center of finance. Prior to the Civil War, most New Yorkers lived in what is now Lower Manhattan. With the coming of the industrial revolution, the population expanded and much of the remaining land in Manhattan was developed.
Once again, new industry is coming into the city. Information technology and
multimedia companies are now as important as finance, real estate, and insurance in New York's economic life. This new industry and the Lower Manhattan Revitalization Plan, have brought
much of Lower Manhattan back to life, attracting new residents and recreating it's vibrant 24-hour environment (Giuliani's "A Vision with Spirit", 1995, p.12).
Residential market in Lower Manhattan
According to recent economic forecasts based on growing employment figures, New York City is now recovering economically, and this trend is expected to continue into the 21 century. Motivated by this recovery, city government has optimistically undertaken the revitalization of Lower Manhattan, a project which had long been anticipated by community and civic leaders alike. Officially, the project began with the signing of the Silver/Connor Bill in October, 1995, a bill which added a new section, 421-g, to the Real Property Tax Law (Appendix A).
Previously, new units had increased to a number of 3,500 per year with the economic recovery that followed the 1981 to 1982 recession. From 1982 to 1988, according to the Department of City Planning, the area of Manhattan south of 9 6* Street to Battery Park City,
from the Hudson River to the East River, saw a sharp increase in new and rehabilitated housing units. This increase was stimulated by a tax advantage for developers who, according to the terms of Section 421 -g, had been exempted from real estate taxes on newly-constructed multiple
dwellings since enactment of this law in 1971.
As can been seen from these figures, the rental market has grown stronger, absorbing all recently completed residential market-rate rental units. This near term demand for housing should support the proposed project at 250 Water Street as rental product.
Supply and demand in the Manhattan apartment market
Luxury apartments in Manhattan have been increasingly in demand over the last three years, and this trend, an indication of regional recovery, is expected to continue through 2001.
Demographic reports indicate that the number of affluent households, i.e., those with an annual income greater than $60,000 per year, will continue to grow more rapidly than the supply of luxury apartments in Manhattan, overtaking this supply by roughly 3,000-4,000 annually.
From 1989 to 1992, there were 12,295 apartments added in Manhattan, but from 1993 to
1995, only 3,825. This would suggest the combined effects of high demand and shortage of
supply as an outlook for the next few years. According to sources from Cushman & Wakefield, it is likely that the new conversion program will also increase supply, and that apartments within the Financial District will be at a premium. Meanwhile, for existing Manhattan apartment buildings with stabilized occupancy, current vacancies average only 3 percent.
Lower Manhattan residential competition
The Alliance forecasts that 7,000 converted residential units are projected in Downtown New York City by the year 2002. The number of available residential units in Lower Manhattan
should average approximately 700 units per year through 2002. Although this number is considerably lower than that of the mid-1980s, it is nonetheless 30 percent of the total proposed development in the area south of 9 6th Street to Battery Park, from the Hudson River to the East River.
A recent survey by Hamilton, Rabinovitz & Alshuler of the community within the proposed project's proximity, revealed that residential properties are presenting a competitive
choice of luxury apartments. Such properties include locations at 130 Water Street, Mandarin Plaza, Tribeca Tower, 3 Hanover Square, and Reade House (build as residential property),
Liberty Towers and 11 Maiden Lane (buildings converted to residential use), and the Battery Park complex. This is a recently developed mixed-use complex that provides necessary neighborhood services and is within easy access of most Manhattan employment centers.
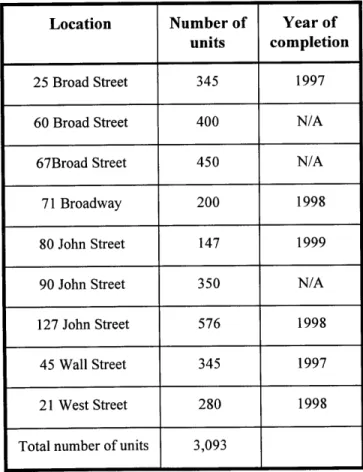
Presently, there are nine additional Lower Manhattan office buildings which are
candidates for conversion to residential use. These properties, if converted, could provide more than 3,000 new rental units within the next five years ( Table A.).
Location Number of Year of
units completion
25 Broad Street 345 1997
60 Broad Street 400 N/A
67Broad Street 450 N/A
71 Broadway 200 1998
80 John Street 147 1999
90 John Street 350 N/A
127 John Street 576 1998
45 Wall Street 345 1997
21 West Street 280 1998 Total number of units 3,093
At the moment, the buildings most likely to be converted are 25 Broad Street, 80 John Street, 127 John Street, 45 Wall Street, and 21 West Street. There is, however, continued
resistance from some commercial tenants; Furthermore, the owners of the buildings have not yet formally agreed to a conversion program. The projected conversion is, therefore, speculative for the time being.
Rent Comparables in the Lower Manhattan market
For the Lower Manhattan sub-market area, the rental market continues to be strong, having recently demonstrated a slightly increased rental rate growth. Based on the figures from periodic rental reports prepared by the Feathered Nest, an index commonly used to follow
residential leasing activity, the Lower Manhattan sub-market generated average rent increases of
15.7% from 1994 to 1995. Non-regulated rents, however, were as much as 17.2% higher than
those of the previous year.
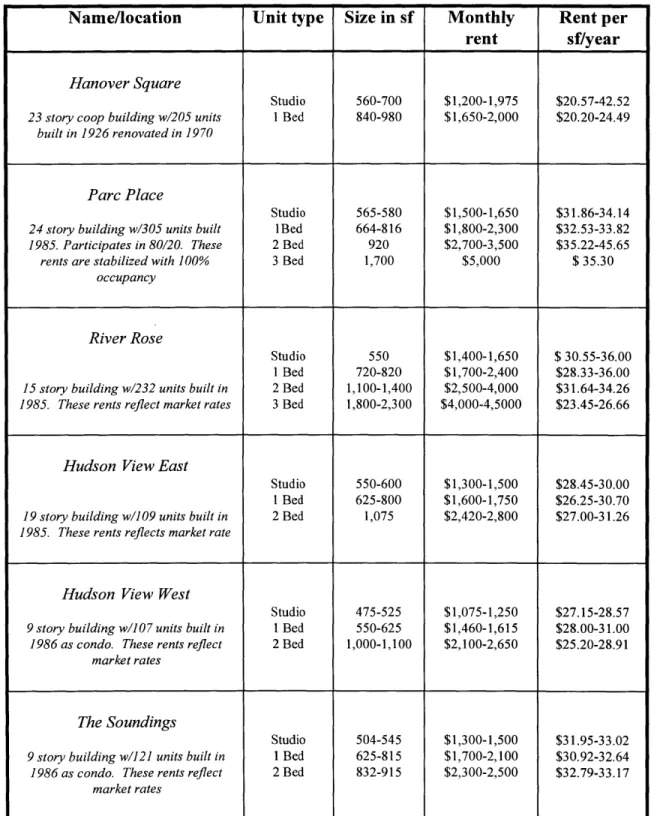
The results of a survey of comparable market rents for the Lower Manhattan apartment sub-market, at the end of 1996, are presented on pages numbers 16 and 17 (Table B & C). Of particular interest are the two rental projects nearest the proposed project at 250 Water Street and the five rental projects located in Battery City Park. The list of comparable rents is
comprised of market-oriented rents for multi-family properties within the Lower Manhattan sub-market ranging from $975 per month for a studio to $5,500 per month for a three bedroom unit. The range of annual average rents is $17.00 to $40.00 per square foot, the majority falling in the high $20 to the mid $30 per square foot range. The assumed rental rate for the proposed project
16
at 250 Water Street is $38 per square foot, based on comparables within a five block radius of the project.
Name/location Unit type Size in sf Monthly Rent per
rent sf/year
Hanover Square
Studio 560-700 $1,200-1,975 $20.57-42.52
23 story coop building w/205 units 1 Bed 840-980 $1,650-2,000 $20.20-24.49
built in 1926 renovated in 1970
Parc Place
Studio 565-580 $1,500-1,650 $31.86-34.14
24 story building w/305 units built IBed 664-816 $1,800-2,300 $32.53-33.82
1985. Participates in 80/20. These 2 Bed 920 $2,700-3,500 $35.22-45.65
rents are stabilized with 100% 3 Bed 1,700 $5,000 $ 35.30
occupancy
River Rose
Studio 550 $1,400-1,650 $ 30.55-36.00 1 Bed 720-820 $1,700-2,400 $28.33-36.00
15 story building w/232 units built in 2 Bed 1,100-1,400 $2,500-4,000 $31.64-34.26
1985. These rents reflect market rates 3 Bed 1,800-2,300 $4,000-4,5000 $23.45-26.66
Hudson View East
Studio 550-600 $1,300-1,500 $28.45-30.00 1 Bed 625-800 $1,600-1,750 $26.25-30.70
19 story building w/109 units built in 2 Bed 1,075 $2,420-2,800 $27.00-3 1.26
1985. These rents reflects market rate
Hudson View West
Studio 475-525 $1,075-1,250 $27.15-28.57
9 story building w/107 units built in I Bed 550-625 $1,460-1,615 $28.00-31.00
1986 as condo. These rents reflect 2 Bed 1,000-1,100 $2,100-2,650 $25.20-28.91
market rates
The Soundings
Studio 504-545 $1,300-1,500 $31.95-33.02
9 story building w/121 units built in I Bed 625-815 $1,700-2,100 $30.92-32.64
1986 as condo. These rents reflect 2 Bed 832-915 $2,300-2,500 $32.79-33.17
market rates
Italic = Considered significant residential rental properties
Name/location Unit type Size in sf Monthly Rent per
rent sf/year
Reade House
Studio n/a n/a n/a
1 Istory building w/80 units built 1988 1 Bed 407-696 $1,000-1,7000 $17.24-32.43 as condo. These rents reflect market 2 Bed n/a n/a n/a
rate
Mandarin Plaza
Studio 574-740 $975-1,325 $20.78-21.56 25 story building w/164 units built in 1 Bed 733 $1,200-1,350 $19.64-22.10 1990 as condo. These rents reflect 2 Bed 1,000-1,010 $1,510-1,900 $19.98-22.80
market rates
11 MaidenLane
Studio 500 $1,025 $24.60
15 story building w/65 units built in 1Bed 750 $1,450 $23.20 1900s and converted from office 2 Bed 900 $1,725 $23.00
building. Market rates
Liberty Tower
30 story Gothic Revival skyscraper 1 Bed 1,200 $1,700-2,500 $17.00-25.00 converted in 1981 to 89 coop apartment. 2 Bed 1,500 $2,800-4,000 $22.40-31.60
Rent reflect sublet sublets of owner 3 Bed 1,800-2,000 $3,700-5,500 $24.70-33.00 units
130 Water Street
15 story renovated condo building. Studio 500 $900-1,100 $21.60-26.40
Market rents reflect sublets of owner 1 Bed 700-900 $1,150-1,550 $19.70-20.67
units. 2 Bed have 2 baths 2 Bed 1,200 $2,5000 $25.00
Ranges Studio 422-739 $900-1,975 $20.57-42.52
1 Bed 407-860 $1,000-2,700 $17.00-37.67 2 Bed 832-1,400 $1,510-3,950 $18.96-45.65 3 Bed 1,800 $3,700-5,500 $24.67-35.30
Italic = Considered significant residential rental properties
Political climate, public support and/or opposition to the project
Landmarks Preservation Commissions are often created, or strongly influenced, by community organization boards. In the case of 250 Water Street, there has been significant opposition from residents of the South Street Seaport historic district who have opposed several successive designs for towering apartment complex in their quaint, low- rise neighborhood. At present, they are trying to gather support for a competing low-rise design put forth by the Seaport Community Coalition, an organization of area residents. Community Board 1 has recently endorsed that proposal.
A serious concern by area residents over the proposed development's potential impact on the quality of the physical, social, and political environment of the community has been
increasingly apparent. Community support could facilitate a development project by allowing the developer to secure zoning changes if necessary, expedite plan approvals, or access sources of local funding. Opposition, on the other hand, could kill it, as so often been the case in the past.
At the present time, a decision from the Landmarks Commission is pending. The project may not be approved in the fall. Yet, in view of the fact that City Hall favors it, approval is still possible.
II. Financial Analysis Model.
This financial analysis utilizes data collected in the market study to evaluate the potential profitability of investing in the proposed residential development. The financial model portrays a development with two towers. This includes a 10-story building and a 7-story building with 250,000 square-feet of total building area and 49,500 square feet of parking area. The model includes a static financial analysis and a discounted cash flow analysis considering financial projections over time, as well as sensitivity analyses.
The 10-year discounted cash flow analysis (DCF method) is the principal analytic tool for determining this project's economic feasibility in terms of expected returns in relation to required
capital. In this method, both risk and the time value of money are incorporated in the discount rate.
Sensitivity analysis, on the other hand, is a technique that enables investors to determine variations and risks of investment property in relation to changes in assumed value for different variables. Different values of key variables are tested to see how investment results are affected by a possible change in the assumptions.
The discounted cash flow model has been created to include key parameters presented and listed in the project variable assumptions. These variables can be modified to test the impact of such changes on project financial results. The discounted cash flow analysis includes the following major sections:
* Capital budget calculated to give the developer an estimate of total development cost for a
particular size project.
" Pro forma or set-up for first stabilized year an essential real estate financial statement created
to determine the net operating income of such a project.
" Valuation and return measures computed for the purpose of examining the value of real
property and scaling the benefits of the development project.
Capital budget
The purpose of the capital budget is to determine the estimated total required investment. A capital budget is created at the beginning of a project and is refined during its life. Major components of the capital budget are land costs, building construction "hard" costs, and indirect "soft" costs.
Land and Acquisition Costs
Land cost is a significant component in the capital budget. All costs associated with land development must be included in the capital budget in addition to its initial cost; e.g., site
development, landscaping, interest, and property taxes. In addition, costs such as legal fees, brokerage commissions, inspection and loan costs, and title insurance, are also part of the land cost.
In the capital budget, land should be incorporated at market value. Land value for this site is not given since it is owned by the developer. However, the total assessed value of the land $6,615,900 was obtained from the City of New York, Department of Finance for 1996/97.
A market value can be calculated by dividing assessed land value by the valuation market rate of 45% which in this case amounts to $14,702,000. For the purpose of this analysis, market value is the land acquisition value which is assumed to be $14,702,000.
Building Construction "Hard" Costs
Based on the scope of the project, a preliminary cost estimate has been prepared. Generally, this estimate is done on a square-foot basis. These preliminary costs are not precise and are used as early indications of feasibility. A better estimate is later made on a line-by-line basis.
For this project, an estimate for building construction costs was prepared by Scharf-Godfrey Inc, construction cost consultants from Chevy Chase, Maryland. It includes the major categories of construction presented in a CSI format and listed by CSI Division Number. The cost estimate was prepared from conceptual sketches made by architect Barbara Marks, and represents construction costs for an apartment project that features both a ten- story tower and a
seven-story tower with an underground garage.
The cost estimate has been calculated per gross square foot of building, on a quantity and unit cost basis that takes into account the desired quality of construction. Total development costs include: the site development at $693,100; 49,500 square feet of parking construction at
$2,083,200; and 250,000 square feet of building construction at$32,396,000. Prices in this cost estimate are current and are assumed constant for six months from the date of estimate.
A contingency by Scharf-Godfrey Inc, at a rate of 20% is included to cover uncertainties within the defined scope of the project design. This includes costs for undefined construction and procedures as well as quantity and detail of available engineering data. The projected construction period for the proposed development is two years.
Indirect "Soft" Costs
Indirect development costs, also called "soft" costs, are all costs not related to land and construction. Primarily, these costs are calculated as a "rule of thumb" percentage of hard costs and assumed related costs. Soft costs include: professional services, financing fees, carrying costs, general and administrative costs, and development fees and or profits.
Soft costs include:
9 Professional Services. These include the fees and expenses of architects, space planners,
engineers, lawyers, real estate brokers, accountants, and appraisers if needed. These are assumed at 5% of total hard costs.
e Financing Fees. These incorporate fees to lenders, investors and brokers in connection with
the interim and permanent financing of the project. Financing fees are assumed to be 4.5% of total hard cost. These include a 1.5% brokerage fee, 2.75% mortgage recording tax, and also title and miscellaneous costs of 0.25%. Legal and closing costs have been assumed at $350,000.
*Carrving Costs. These relate to the operating and financing costs of the property accumulated
during the development period. Operating expenses include real estate taxes, insurance, utilities, and security during the construction period. Insurance is assumed to be at 1.5% of total hard costs. Real estate taxes during construction are assumed to be the assessed value of the land times a rate of 10% times 2 (number of years of construction). Foremost among these costs is
interest on project financing. Over the two year construction period, construction interest is applied to the average cost. The assumed construction interest rate is 9.5% (prime rate of 8.5% plus 1%) for the same two year period. The construction interest costs are assumed to be 9.5%
of total hard costs times 2years times 0.5 (average outstanding cost).
e General and Administrative Costs. These overhead costs of developers are frequently
included by the developer although some investors and lenders believe that these costs should not be part of the project budget.
e Development Fees/Profits. Whether or not to incorporate profit in a capital budget is subject
to debate. In any case, the capital budget of any project must either project a profit or create substantial income for the developer in order to attract the necessary funds for development. Development fees are assumed at 3.5% of total hard costs.
Pro Forma or Setup
The Pro-Forma Statement for the first stabilized year includes key parameters such as income and expenses. This pro-forma, or "Setup" is a combination of income statement with
cash flow adjustments created to determine the net cash flow from the completed project as well as related income tax effects.
Gross Potential Income
The income setup analysis normally starts with rentals. Initially, rental income can be projected on a per-square-foot basis. Rent levels depend on such factors as property type, location, and quality of finishes.
In order to determine projected economic feasibility, the developer must determine current market rents. The use of local sources may locate information about competition for the proposed development and comparables within a market area. Comparables are rents generated by properties with similar features and locations. Daily newspapers, real estate brokers, and consultants are primary sources of data for such comparables.
In addition to rental income, other sources of income should also be considered, such as parking revenues, income from laundry and vending machines in residential development, and, in some cases, income from other building amenities when not included in the rent. For this project, a monthly rent of $220 for parking was obtained from architect Barbara Marks.
Comparable apartment rental rates were obtained from a real estate broker in Lower Manhattan. For this project an average rent of $38 per square foot is used because that is the expected future (i.e., year 2000) comparable rent generated by properties with similar features within a five-block radius of the project.
Vacancy Allowance
The developer must also allow for vacancy. A reasonable vacancy allowance of 5% is presently used by developers in New York City. This reflects the experience of comparable properties in the area and projected trends in the marketplace. It is expressed as a percentage of gross potential income for the proposed project.
The rate of vacancy varies and is related to the property's age and type, and also to the rent level. Gross potential rental income reduced by an estimated vacancy allowance equals Effective Gross Income (EGI).
Operating expenses
Operating expenses are directly related to the operation and maintenance of the completed property. In general, operating expenses include management fees, repairs and maintenance, utilities, security, payroll, marketing expenses, replacement reserves, insurance, and real estate taxes. Real estate taxes are the largest line item of annual operating expenses, and are usually based on the property value, which is determined by the local government (Blew,
1989, p.27).
Initially these expenses are lumped together either as a percentage of effective gross income, or on a per-square-foot or per-unit basis. Developers in New York City use a general "rule of thumb" when they apply a certain percentage of these costs to EGI. As the project planning develops these costs are recalculated on a line-by-line basis.
Again, operating expenses depend on property type, age, comparables and market trends. Older properties require higher maintenance costs which ultimately increase operating expenses. Both income and operating expenses, however, may be increased by inflation.
The remaining cash flow after deducting the operating expenses of a property from effective gross income is called net operating income (NOI).
Debt service
Debt service relating to mortgage indebtedness is the first deduction from net operating income. Debt service is usually constant and consists of a payment for annual interest on the outstanding loan plus an amount toward annual principal payments or amortization.
The borrower pays a fixed amount each year with equal payments at the end of each month. As each payment is made, the loan balance is reduced and the interest portion of the payment is determined by that reduced balance. During the life of the loan, interest payments decrease while the amortization of principal payment increases. Most mortgage loans require payments on a monthly basis.
When debt service payments are subtracted from net operating income the result is cash flow after financing (CFAF), which is available to the developer on a pre-tax basis.
Mortgages
The mortgage loan is the prevalent method of real estate financing. The borrower gives to the lender a claim against the property as security for the borrowed funds. Mortgage loans can be recourse or non-recourse loans. With recourse loans, the borrower personally guarantees
repayment of all money borrowed; with non-recourse loans, the lender can affect a claim only on the mortgaged property.
The principal balance of a loan is the present value of an ordinary annuity. Equal
installments amortize the loan, providing the lender with its required return. Amortizing the loan results in a lower amount of interest paid, because part of the principal is paid off during the life of the loan.
For the purpose of this analysis, a fully amortizing loan for 25 years with a fixed interest rate of 8.5% and constant monthly payments is assumed. Such a loan is common for a project like this at this time. With a fixed-rate mortgage, the payments remain the same for the term of the loan.
Interest rate
The interest rate is the rate of return on a mortgage loan, usually expressed annually. It may be variable or fixed. In general, it will be proportionate to the length of the loan term and the risk to the lender. The higher the risk, the higher the interest rate. The assumed interest rate of 8.5% used for this project is approximately 2.25% in excess of the rate on 10-year U.S. Treasury Bonds.
Given a pro-forma debt service coverage ratio of 1.2, the author believes this rate is appropriate for the purposes of this analysis.
Debt service constant
The debt service constant is the percentage of the loan needed to pay interest on the outstanding loan and amortize it during its term. For this analysis, a $47,814,000 loan for 25 years at 8.5% requires payments of $4,672,000, per year for 25 years. The debt service constant is a rate which converts the annual payment to a percentage of the loan amount and equals 9.77%.
Debt coverage ratio
The debt coverage ratio (DCR) is a ratio of net operating income to the annual debt service on the mortgage loan. For example, if net operating income is $5,606,000 and annual debt service is $4,672,000, the debt coverage ratio is 1.2. With this debt coverage ratio, $1.20 of net operating income is required for every $1.00 of debt service.
The maximum loan amount is calculated when the required debt coverage ratio and the maximum annual debt service constant are established. This project assumes a 25 year loan at 8.5% interest, requiring a constant annual debt service of 9.7%. The permissible loan amount is determined by taking the annual debt service and dividing it by a constant of 9.7%.
Depreciation
In order to calculate income taxes payable, depreciation must be calculated. Depreciation is treated as a deduction from income, since the tax code permits it to be considered as an
Under the tax law of 1986, residential properties are depreciated over a period of 27.5 years, and commercial properties over a period of 39 years, using the straight line method. The straight line depreciation method assesses depreciation expense by dividing the cost of the asset (excluding land) by its useful life.
Taxable income or loss equals the sum of cash flow after debt service, plus replacement reserves and mortgage amortization, less depreciation.
Taxes are computed by multiplying the effective tax rate by taxable income. An investor's marginal tax rate will reflect income earned from other sources as well as taxable income or loss from the property. The present highest marginal tax rate is 39.6%.
Finally, the tax payable amount is deducted from cash flow after financing. This results in the cash flow after tax(CFAT) for the investment project. Should the property create a taxable loss, the effect will vary depending on the status of the investor. Losses can generally be offset against other real estate investments, but not against other forms of income.
Valuation and Return Measures
Measures of valuation and return are used to evaluate the feasibility of the project.
Capitalized Value
There are several ways of determining valuations of income-producing property. A market value approach is considered when sales are based on comparable properties. A
and size. The approach used in this project is based on a determination of value from capitalized income.
Capitalization is an estimation of the value of income-producing property derived from the projected flow of annual net operating income by applying an appropriate capitalization rate to it. This process converts future income into present value. Normally, value refers to the anticipated worth of the investment. It represents the future flow of income which the investor expects from the property. Value is determined by taking the net operating income and dividing it by the capitalization rate.
Capitalization rate
Capitalization rate, also called cap rate, is the percentage by which expected net operating income is converted into present value. That rate, when applied to the earnings of the
investment, determines its market value. Cap rates vary according to investments, but usually in a range of 6 to 20 percent. For a project generating secure net operating income, the
capitalization rate is lower. When net operating income is risky or inflation is anticipated, it is higher and lowers the value of the property. Capitalization rates are based on the following
factors: type of property, location, lease maturities, quality of tenancies, age, financing, and market rents. For the purpose of this analysis, the cap rate upon sale is assumed to be 9%.
Return on Total Assets (ROTA)
The most fundamental measure of return is the return on total assets (ROTA). Basically, this measure of return can be defined as follows: net operating income (NOI) divided by the asset
cost (total development cost). Since the determination of return is for the proposed development, in this case the denominator is simply the total development cost in the project capital budget.
The developer uses return on total assets as a benchmark for evaluating the rate of benefits of the proposed project. Thus, the sense of overall return relative to other proposed
development investments is found using this measure.
Return on Equity (ROE)
So far, most valuations and returns discussed are unleveraged returns which do not involve the financing of a project. Return on equity, however, does involve financing. It is defined as cash flow after financing, before income tax adjustments, divided by net equity investment. In this project, equity is defined as the total project cost less permanent financing proceeds. This measure is also called the cash-on-cash return.
Net Cash Proceeds from Sale
To calculate the future sales price of an income producing property, the capitalization of income method is generally used. Assumptions of future net operating incomes are required. Also, a growth assumption by 3.5% per year, compounded annually is applied to income and expenses, over a holding period of 10 years.
The sales price of the project is assumed to take place at the end of the tenth year. Therefore, by dividing the net operating income in year 11 by the cap rate upon sale of 9%, the
sales price at the end of year 10 is calculated. The net selling price is established by assuming a commission of 2% on the gross sales price.
Taxable gain on sale is the difference between the net selling price and the net book value. The net book value for tax purposes is the initial cost less the accumulated
depreciation. The resulting tax liability is the gain on sale multiplied by 28%, the current capital gains tax rate. Once sales price, commissions, tax liability, and outstanding loan balance in year 10 have been determined, the net cash proceeds from sale can be calculated. The total tax liability and outstanding loan balance are then subtracted from the net sales price (after the cost of commission) to obtain the net cash from sale. Since this amount will not be received until the end of the holding period, it must be discounted to determine its present value.
Present Value
The present value (PV) of the proposed development is the sum of all present values of after-tax cash flows and the present value of net cash from sale. When present value exceeds the equity invested, then the net present value is positive. In this case a developer will decide to invest in a project.
Net Present Value
The comparison of the initial investment with the present value of the future cash flows is the net present value (NPV). Net present value is a common way of estimating the return on a
real estate investment over a projected holding period.
The net present value for a real estate development is the sum of a stream of cash flows discounted back at an appropriate discount rate, less the equity invested. If the net present value is positive, the investment should be accepted. Net present value calculation considers all
components of return available to the developer, as well as the appropriate return premium based on the uncertainty (risk) of the projected cash flows.
The Discount Rate
The discount rate is the investor's minimum required rate of return. Therefore, the selection of an appropriate discount rate of return is of vital importance. The discount rate for each investment alternative will depend on how much risk is assumed and how much liquidity there is in the investment. Therefore, it is easier for the individual confronted with the choice of investment to choose the discount rate. In the case of a development company faced with capital budgeting constraints, the appropriate discount rate may not be as apparent.
Sometimes the firm may express an unwillingness to invest in a project unless it will generate at least a given percentage of return after taxes. There are also situations when the capital for the project is accessible only from outside equity or loans. Thus, the developer sets a hurdle rate based on the return needed to attract equity or to obtain the loan; this is referred to as "cost of capital". The "hurdle rate" is another name for the developer's minimum required rate of return.
An investment decision is made based on expected returns. If the expected rate of return is equal to, or greater than, the hurdle rate, the rule is to invest. On the other hand, no investment will be made if the expected rate is less than the hurdle rate Because investors believe that other available investment opportunities may produce a favorable rate, they establish a hurdle rate which then corresponds to an opportunity rate. The required rate of return is used as a discount rate, to discount expected future cash flows to a present value. For the purpose of this analysis,
the discount rate of 12.5% is based on the assumption that the developer is looking for minimum required return between 15% and 20% before taxes. If we select an average of 17.5%, once the
17.5% is taxed by a 28% marginal tax rate, it is equivalent to an after-tax discount rate of 12.5%.
Internal Rate of Return
An equally important measure applied in real estate financing is the internal rate of return ((IRR) or investment yield. The internal rate of return on an initial investment is that discount rate which makes the net present value equal to zero.
In calculating an IRR, the developer does not start with a pre-established investment return. Once he knows the amount of investment required, he can project future cash inflows and outflows, to establish the annual return on investment by finding the discount factor that will make the net present value of cash inflows equal to that of cash outflows.
The internal rate of return is a way of measuring return over the whole investment period. This is expressed as a compound rate of interest which the developer can use to measure the relative attractiveness of different projects. Note that the IRR only addresses investment returns; it in no way speaks to investment risk.
250 Water Street Residential Project Table 1: Assumptions Project Size Building Assumptions Contigency cost A&E Financing fee
Mortgage recording tax Brokeraqe fee Title and miscellaneous Total Financing Fees Development Fee
Insurance during constr. Construction interest rate Contingency
Total bldg. const. Hard Cost Const. cost parking Hard cost Marketing Expenses Land Acquisition Value Assessed Land Value
R.E. Taxes on ass. land during constr. Income
Gross SF of building area Net rentable SF of building area Annual Rent
Annual Rent Efficiency/Loss Factor Vacancy after year one Vacancy for year one Monthly Rent from Parking Gross SF per car Number of parking spaces Income and expense growth Expenses
Management fee
Annual Utilities and Maintenance Real Estate Taxes
Insurance Doorman
Handyman & Porters Superintendent Replacement reserve
Mortgage amortization schedule Annual interest rate Tax rate
Capital Gains Tax Debt Coverage Ratio Amortization period Tax depreciation period Net cash from sale
Brokers commision, legal fees After-tax discount rate Sales Price Calculation
Cap rate upon sale
20% of sub total hard costs 5.0% of total hard costs 2.75% 1 50% 0.25% 4.50% 3% 1.5% 9.5% 5% $ 130 $ 42 $ 1.20 $ 14,702,000 $ 6,615,900 10%
of total hard costs of total hard costs of total hard costs on total hard costs
of sub total soft costs per SF per SF per SF 250,000 212,500 $38 pernetSF $32 per gross SF 85% 5% of gross rent 30% of gross rent $ 1.10 per SF 200 per car 20% of gross SF 3.5% per year 3% of EGI $2.15 per gross SF $5.00 per gross SF $1.50 per gross SF $42,000 $42,000 $ 94,000 $ 0.16 per gross SF 8.50% 39.60% 28.00% 1.2 25 years 27.5 years 2% 12.5% 9.0% 250,000 SF
250 Water Street Residential Project
Table 2:
Capital Budget (rounded to the nearest '000) 250,000
Gross SF of building area
Building Construction ("HARD") costs: Site Development
Parking Construction Building Construction Sub-total
Contingency @ 20% of Sub-total Total HARD Costs
Indirect ("SOFT") Costs:
A & E @ 5.0% of Total Hard Costs Const. Interest Cost during const. period Financing Fees 4.5% of total hard costs Real Estate Taxes during const. period
2 x 10% of $ 6,615,900 (assessed value)
Insurance 1.5% of total hard costs Legal Fees
Marketing Expenses #### p.s.f. Development Fees @ 3% of hard costs Sub-total
Contingency @ 5% of subtotal Total SOFT Costs
Total Construction Cost: Land Acquisition Value Total Development Cost:
$ 693,000 $ 2,100,000 $ 32,500,000 $ 35,293,000 $ 7,059,000 $ 42,352,000 2,118,000 4,023,000 1,906,000 1,323,000 $ 635,000 $ 350,000 $ 300,000 $ 1,271,000 $ 10,355,000 $ 518,000 $ 10,873,000 $ 53,225,000 $ 14,702,000 $ 67,927,000
Cost per Gross SF
$ 2.77 $ 8.40 $ 130.00 $ 141.17 $ 28.24 $ 169.41 8.47 16.09 7.62 5.29 $ 2.54 $ 1.40 $ 1.20 $ 5.08 $ 41.42 $ 2.07 $ 43.49 Cost per rentable area 3F $ 326 $ 938 $ 152 J4 $ 166)8 $ 33,22 $ 199 30 9 7 18.)3 8.97 6.23 $ 2.99 $ 1 35 $ 1.41 $ 5 98 $ 48,73 $ 244 $ 51.17 $ 212.90 $ 250.47 $ 58.81 $ 69 9 $ 271.71 $ 319 -6
250 Water Street Residential Project Table 3:
Pro Forma for First Stabilized Year (Year 2) (rounded to the nearest'000) Gross SF of building area
Income: Annual Rent
Annual Rent from Parking Vacancies @ 5% Effective Gross Income Expenses:
Management Fee @ 3.0% of EGI Annual Utilities and Maintenance Real Estate Taxes
Insurance Doorman (4) Handyman & Porter Superintendent
Replacement Reserves @ Total Operating Expenses Net Operating Income (NOI)
250,000 8,358,000 683,000 n r% A4 AA'M 452,000 8,589,000 258,000 556,000 1,294,000 388,000 174,000 174,000 97,000 41,000 2,982,000 $0.16 p.s.f. $ 5,606,000 Debt service $ (4,672,000)
Cash flow after financing (CFAF) $ 934,000
Tax payable (see below) $ (119,000)
Cash flow after taxes (CFAT) $ 1,053,000
Return on total assets (ROTA) 8.3%
Return on equity (ROE) 4.6%
Mortgage amotrization schedule Sources of funds
Annual debt servicing $ 4,672,000
Permissible loan size $ 47,814,000
DCR 120%
Equity (tot.dev.costs-mortg.amt)) $ 20,113,000
Mortgage amount (outstanding loan balance) $ 47,814,000 Debt service (mortgage) payment breakdown
Constant or annual mortgage payment $ (4,672,000)
Annual interest $ 4,013,000
Annual amortization of principal $ 659,000
Calculation of tax payable
Cash flow after financing (add) $ 934,000
Replacement reserves (add) $ 41,000
Mortgage amotrization (add) $ 659,000
Less tax depreciation $ 1,935,000
Taxable income $ (300,000)
Tax rate 39.6%
CHAPTER THREE
Results of Analysis
The purpose of the discounted cash flow analysis is to incorporate all the components which affect the return from a proposed smaller scale real estate investment with minimum density. All potential cash flows include cash inflows, such as rents, and proceeds from sale, and cash outflows such as operating expenses, taxes, debt service, and equity invested. The cash flows which are used in the discounted cash flow model are calculated from data obtained from existing market conditions.
The fundamental objective of this analysis is to evaluate the relative attractiveness of the project with different values for density and other variables, and to test the impact of such
changes on project performance. Through further sensitivity analysis we can attempt to establish that the developer does not need maximum density in order to earn a reasonable return.
The process involves changing one or a few of the key variables to determine the sensitivity of financial performance to the changes. Commonly examined variables in such a sensitivity analysis are: market rental rates, vacancy rate, operating expenses, land value and the anticipated sale price of the property.
To perform a sensitivity analysis, a base case is first created, with a list of all variables which are relevant references for the sensitivity analysis. Once the list of major assumptions and their most likely values (the base case) is created, cash flows before and after taxes are projected.
Then, present values, net present values and internal rates of return are calculated. These last two measures of the project's performance form the basis for a decision.
Results will be affected of course, by changes in the values of these variables. When one variable is changed at a time, the effect of that particular variable can be isolated and evaluated
(Brueggeman,1993, p.332). In the course of this analysis, at a density of 250,000 square feet, the calculated internal rate of return is 7.9%, under the particular group of variables taken as the base case(Table 5.2: Sensitivity Analysis).
How does one use this analytic technique to derive a minimum density? Density minimization implies that the NPV is zero and the IRR equals the developer's discount rate. Based on current findings (base case), the minimum density appears to be 400,000 square feet (Table 5.2: Sensitivity Analysis). Let's observe the obtained results. The model is based on a
250,000 square foot development. For the purpose of sensitivity analysis, 21 additional scenarios
were examined to test variations in performance of the proposed development project at different density levels and with different variables for rent at rates per square foot. In each case, density is increased incrementally by 20,000 square feet, starting from a minimum of 100,000 square feet
and increasing to a maximum of 500,000 square feet.
These scenarios generally illustrate that if square footage of the building is increased, NPV and IRR will increase if land value is held constant. By assuming constant development
cost and revenue functions with respect to scale (density), this result is intuitively acceptable. Projected rental rates are a critical assumption; if the average rent variable is changed, this change immediately impacts investment results. However, one may argue that the same rent can not apply for different scales of development. While this is often true (considering all other factors such as location, size of development, height, etc.), this analysis assumes constant cost
41
and revenue functions. According to the model, greater density increases both profit and investment value.
It must be noted however, that this model should be used with care. Further predictions based on today's rental markets are difficult because a major project can take 2-3 years and during that time markets can change significantly. Forecasting the market and making a 10-year projection is not easy because real estate markets are volatile and reflect the interplay of supply
* gRgg &&ig! j s ER*ggg gggjg
I
gwggg R*gggg ggggg I ggggj I gggg ggggggRgg &gaMMa11 gwgggwggg (RIiiRlRggggogge IMMRw4we MUM&neg
MIMI&.8 99Masane 1
-I
~j.i
ji
I
I * waai 1144-ati -gill" Rig'"!fir
Iw
a
I(!!
gidI
Ij;wj
g g (RI' .. (g.I. seI g. I I I I99 1 IER 1191. §1111 Rggg wwIti RegaIMI
"1 f
111
1
"I
11c
u
1.1i1
250 Water Street Residential Project Table 4.2:
Net Cash from Sale, DCF's, NPV and IR
NO (Year 2)
Property Value (tot. dev. cost)
initial cash yied (Cap Rate)
NOI (year 11)
Cap Rate Upon Sale
Sale Price in year 10
Net Book Value
Property Vake (ot. dev. cost) at tme 0r
less accumated depreciatopm
Net Book Valae
Capital Gains tax Sales Price
Commisson o 2%
Not Seng Price
Net Book Valtea
Gaein on Sale
Tax Uiablity at 28%
Net Cash from Sale
Sales Price
Commissions Tax iability
Outstanding Loan Balance
Net Cash krom Sale
Present Value Calculation
Required Equity
CFAT Rom operations
CF from rersieon Total CF PV@ 125% NPV @ 125% IRR Calculation 794% Gross SF 28,tlem
(rounded In the nearest '00)
Year YearCt Year C2 Yeas 1
5 (20,113.000) -5 (320,000) S - S - $_ - S -$ (20.113000) s (320,000) $12,970,000 5 (7,143000) s 5.606,000 5 67.927,000 8.25% 5 7.41,000 9.0% S84,900,000 5 67,927,000 $ (19.350,000) S 48,577,000 $ 84,900,000 S (1,696,000) S 83,202.000 $ (46,577,00) s 34.625,000 $ 9,695,000 S 84,900,000 S (1,696,000) $ (9,R95000) 5 (40,064,000) 9 33,443,000
Year 2 Year 3 Year 4 Year Year I Year Year Yea 9 Year 10
S r,053,000 S 1,149,000 5 1,247.000 3 1.347,000 $ 1,450,000 5 1.554.000 5 1,661.000 S 1,770.000 S 1,860,000
3 - $ . 5 . 5 - $ - 3 . - S S 33,443,000
250 Water Street Residential Project Table 5.1:
Sensitivity Analysis
Rent Value Gross Building Area
100,000 120,000 140,000 160,000 180,000 200,000 220,000 240,000 250,000 260,000 280,000 300,000 320,000 340,000 360,000 380,000 400,000 420,000 440,000 460,000 480,000 500,000 35 psf Land Value $ 14,702,000 $ 14,702,000 $ 14,702,000 $ 14,702,000 $ 14,702,000 $ 14,702,000 $ 14,702,000 $ 14,702,000 $ 14,702,000 $ 14,702,000 $ 14,702,000 $ 14,702,000 $ 14,702,000 $ 14,702,000 $ 14,702,000 $ 14,702,000 $ 14,702,000 $ 14,702,000 $ 14,702,000 $ 14,702,000 $ 14,702,000 $ 14,702,000
Total Devlopment Cost Stabilized NOI 37,652,000 41,689,000 45,726,000 49,762,000 53,799,000 57,835,000 61,872,000 65,908,000 67,927,000 69,945,000 73,982,000 78,018,000 82,055,000 86,091,000 90,128,000 94,165,000 98,201,000 102,238,000 106,274,000 110,311,000 114,347,000 118,384,000 $ 1,837,000 $ 2,258,000 $ 2,680,000 $ 3,101,000 $ 3,523,000 $ 3,944,000 $ 4,366,000 $ 4,788,000 $ 4,998,000 $ 5,209,000 $ 5,631,000 $ 6,052,000 $ 6,474,000 $ 6,895,000 $ 7,317,000 $ 7,739,000 $ 8,160,000 $ 8,582,000 $ 9,003,000 $ 9,425,000 $ 9,846,000 $ 10,268,000