HAL Id: hal-00300951
https://hal.archives-ouvertes.fr/hal-00300951
Submitted on 18 Jan 2006HAL is a multi-disciplinary open access
archive for the deposit and dissemination of sci-entific research documents, whether they are pub-lished or not. The documents may come from teaching and research institutions in France or abroad, or from public or private research centers.
L’archive ouverte pluridisciplinaire HAL, est destinée au dépôt et à la diffusion de documents scientifiques de niveau recherche, publiés ou non, émanant des établissements d’enseignement et de recherche français ou étrangers, des laboratoires publics ou privés.
In-situ comparison of the NOy instruments flown in
MOZAIC and SPURT
H.-W. Pätz, A. Volz-Thomas, M. I. Hegglin, D. Brunner, H. Fischer, U.
Schmidt
To cite this version:
H.-W. Pätz, A. Volz-Thomas, M. I. Hegglin, D. Brunner, H. Fischer, et al.. In-situ comparison of the NOy instruments flown in MOZAIC and SPURT. Atmospheric Chemistry and Physics Discussions, European Geosciences Union, 2006, 6 (1), pp.649-671. �hal-00300951�
ACPD
6, 649–671, 2006 NOy instrument comparison H.-W. P ¨atz et al. Title Page Abstract Introduction Conclusions References Tables Figures J I J I Back Close Full Screen / EscPrint Version Interactive Discussion
EGU
Atmos. Chem. Phys. Discuss., 6, 649–671, 2006 www.atmos-chem-phys.org/acpd/6/649/
SRef-ID: 1680-7375/acpd/2006-6-649 European Geosciences Union
Atmospheric Chemistry and Physics Discussions
In-situ comparison of the NO
y
instruments flown in MOZAIC and SPURT
H.-W. P ¨atz1, A. Volz-Thomas1, M. I. Hegglin2, D. Brunner2, H. Fischer3, and U. Schmidt4
1
Institut f ¨ur Chemie und Dynamik der Geosph ¨are II: Troposph ¨are, Forschungszentrum J ¨ulich, Germany
2
Institute for Atmospheric and Climate Science, ETH-Z ¨urich, Switzerland
3
Max Planck Institute for Chemistry, Mainz, Germany
4
Institut f ¨ur Atmosph ¨are und Umwelt, Johann Wolfgang Goethe-Universit ¨at, Frankfurt, Germany
Received: 31 October 2005 – Accepted: 11 December 2005 – Published: 18 January 2006 Correspondence to: A. Volz-Thomas (a.volz-thomas@fz-juelich.de)
ACPD
6, 649–671, 2006 NOy instrument comparison H.-W. P ¨atz et al. Title Page Abstract Introduction Conclusions References Tables Figures J I J I Back Close Full Screen / EscPrint Version Interactive Discussion
EGU
Abstract
Two aircraft instruments for the measurement of total odd nitrogen (NOy) were com-pared side by side aboard a Learjet A35 in April 2003 during a campaign of the AFO2000 project SPURT (Spurengastransport in der Tropopausenregion). The instru-ments albeit employing the same measurement principle (gold converter and chemilu-5
minescence) had different inlet configurations. The ECO-Physics instrument operated by ETH-Z ¨urich in SPURT had the gold converter mounted outside the aircraft, whereas the instrument operated by FZ-J ¨ulich in the European project MOZAIC III (Measure-ments of ozone, water vapour, carbon monoxide and nitrogen oxides aboard Airbus A340 in-service aircraft) employed a Rosemount probe with 80 cm of FEP-tubing con-10
necting the inlet to the gold converter. The NOyconcentrations during the flight ranged between 0.3 and 3 ppb. The two data sets were compared in a blind fashion and each team followed its normal operating procedures. On average, the measurements agreed within 6%, i.e. within the combined uncertainty of the two instruments. This puts an up-per limit on potential losses of HNO3in the Rosemount inlet of the MOZAIC instrument. 15
Larger transient deviations were observed during periods after calibrations and when the aircraft entered the stratosphere. The time lag of the MOZAIC instrument observed in these instances is in accordance with the time constant of the MOZAIC inlet line determined in the laboratory for HNO3.
1. Introduction
20
Airborne measurements are the only means of obtaining highly resolved information on the distribution of reactive nitrogen compounds in the upper troposphere and lower stratosphere. NO and NO2 are key in controlling the concentration of the OH radical and ozone formation (Crutzen, 1979), whereas measurements of total odd-nitrogen (NOy, i.e., the sum of NO and its atmospheric oxidation products) have proven useful 25
ACPD
6, 649–671, 2006 NOy instrument comparison H.-W. P ¨atz et al. Title Page Abstract Introduction Conclusions References Tables Figures J I J I Back Close Full Screen / EscPrint Version Interactive Discussion
EGU
stratosphere (Keim et al., 1997, and references therein). The measurement technique for NOy (i.e., catalytic reduction to NO on a hot gold surface followed by chemilumi-nescence detection of the NO) was pioneered by Bollinger et al. (1983) and Fahey et al. (1985). Since then, a large number of ground-based and airborne data sets have been collected. In the course of the interpretation of such measurements, the qual-5
ity of NOy measurements using different kinds of catalytic converters operated under different conditions was called into question (c.f. Crosley, 1996; Brough et al., 2003, and references therein). Potential problems were found with interferences by non-NOy compounds, e.g. HCN and CH3CN, and with the inlet configuration in terms of time re-sponse or memory, the sampling efficiency for aerosol, and the transmission of HNO3 10
(cf. Ryerson et al., 1999), which constitutes the major fraction of NOy in the lower stratosphere (Neuman et al., 2001). Regular instrument comparisons are therefore indispensable for assessing the data quality.
Such comparisons are even more important for the NOy-instrument deployed in MOZAIC aboard an in-service aircraft of Deutsche Lufthansa in autonomous operation 15
since 2001 (Volz-Thomas et al., 2005). Meanwhile, this instrument has been deployed on more than 2000 long-haul flights collecting more than 15 000 h of NOydata. In order to assess the data quality of the MOZAIC instrument and to identify potential problems with the inlet configuration, which is sub-optimal because of the certification require-ments on passenger aircraft, a blind comparison was conducted between the MOZAIC 20
instrument and a research instrument operated by ETH-Z ¨urich (ETHZ) aboard a re-search aircraft during the last six of eight measurements campaigns in the framework of the German SPURT project (Engel et al., 2005). The previous version of the ETH-instrument, which was used during the first two missions, is described in Hegglin et al. (2004). The improved sensitivity and the optimal inlet configuration of the new in-25
strument deployed during SPURT allow for a critical evaluation of the performance of the MOZAIC instrument, including potential losses of HNO3in the inlet.
ACPD
6, 649–671, 2006 NOy instrument comparison H.-W. P ¨atz et al. Title Page Abstract Introduction Conclusions References Tables Figures J I J I Back Close Full Screen / EscPrint Version Interactive Discussion
EGU
2. The instruments
2.1. The MOZAIC NOy-instrument of FZJ
The MOZAIC NOy-instrument is described in detail by Volz-Thomas et al. (2005). Briefly, the measurement principle is chemiluminescence of NO with O3 and catalytic reduction of the different NOy compounds to NO with H2(0.1 sccm) on a hot gold sur-5
face (300◦C). Because of the limitations in gas supply, in particular of H2, for long-term operation (4–7 weeks), the instrument employs a very low sample flow (90 ml/sccm) and thus has a comparably low sensitivity of 0.4–0.7 cps/ppt. The gold converter has a conversion efficiency of >95% for NO2 and HNO3 at all altitudes encountered. In-terferences by N2O, NH3, CH3CN are negligible, whereas HCN is converted at almost 10
100% efficiency (Volz-Thomas et al., 2005). The converter is mounted inside the in-strument and is connected via 80 cm FEP tubing (1/800 OD) to a Rosemount Probe, which provides positive ram pressure and serves as a virtual impactor for separation of atmospheric particles. The inlet line is kept above 20◦C by a heating wire.
2.1.1. Calibration 15
The instrument was calibrated before and after the flight by diluting the FZJ master calibration standard (10 ppm NO in high purity N2, Air Liquide) with NOy-free zero air (Linde). The flow rates were measured volumetrically with an automatic soap film flow meter (Gillibrator, Gillian USA). The sensitivity for NO remained constant at 460±18 cps/ppb and the conversion efficiency for NO2, as determined by gas phase 20
titration of the NO by O3remained at 92±4% (2 sigma). Other than for the ETHZ instru-ment (see below), the conversion efficiency of the MOZAIC instrument is independent of pressure. The overall inaccuracy of the calibration from errors in the flow mea-surements (3%) and the uncertainty of the conversion efficiency was ±6% (2 sigma). The conversion efficiency for HNO3was determined before and after the campaign to 25
ACPD
6, 649–671, 2006 NOy instrument comparison H.-W. P ¨atz et al. Title Page Abstract Introduction Conclusions References Tables Figures J I J I Back Close Full Screen / EscPrint Version Interactive Discussion
EGU
inlet with an excess O2-flow, in the same way as during MOZAIC operation. NO and NO2calibrations were not made during the flight in order to save time for the compari-son.
2.1.2. Data treatment and uncertainty assessment
The data were analysed in the same way as during routine operation in MOZAIC by 5
interpolation of the automatic zeros of the NO detector. In addition, the average back-ground signal for NOy determined from the zero air measurements (fake NOy) was subtracted. The latter was 150±30 ppt (2 sigma) before the flight. The background determinations during the flight suffered from memory effects of the gold converter due to the long tail of the memory curve for HNO3 (Volz-Thomas et al., 2005). The 10
memory manifested itself by the fact that the zero signals were still decreasing at the end of the zeroing intervals and that the remaining signals (370 to 620 ppt) were cor-related with the ambient NOy concentration measured before the zero was initiated. After the flight, the background was 200±35 ppt. The memory for HNO3 leads to a potential overestimation of the instrument’s real background unless the zero air is ap-15
plied for much longer than the 5 min employed during the comparison flight. Therefore, the background value of 150 ppt as determined before the flight was used in the data reduction.
The statistical (2 sigma) precision of an individual 1 s data point was 50 ppt at the detection limit and 3% for the highest NOy concentrations observed. The overall (2 20
sigma) uncertainty of an individual 1s NOy-measurement was estimated by including the uncertainties in the calibration (±6%, 2 sigma) and the instrumental background (±100 ppt, 2 sigma) to
DNOy=sqrt((0.03 × NOy)2+ (0.06 × NOy)2+ 502+ 1002) ppt
with NOy in ppt (cf., Volz-Thomas et al., 2005). The largest contribution to the overall 25
uncertainty usually comes from the uncertainty in the background. Potential errors of 2% in the absolute value of the master NO standard were neglected for the instrument
ACPD
6, 649–671, 2006 NOy instrument comparison H.-W. P ¨atz et al. Title Page Abstract Introduction Conclusions References Tables Figures J I J I Back Close Full Screen / EscPrint Version Interactive Discussion
EGU
comparison because of the excellent agreement with the master standard of ETHZ (<0.5%). We like to note that the performance of the instrument in terms of sensitivity, background signal and conversion efficiency was comparable to that achieved during routine operation in MOZAIC.
2.2. NOy-, NO-, and O3-measurements by ETH Zurich 5
2.2.1. The ECO instrument
A commercial 3-channel chemiluminescence detector (790 SR, ECO Physics, Switzer-land) for the measurements of total reactive nitrogen (NOy), nitrogen monoxide (NO), and ozone (O3) was implemented by ETHZ aboard the Learjet 35A aircraft for the SPURT project. A detailed description of the experimental setup can be found in Heg-10
glin (2004). The measurement principle is based on chemiluminescence between NO and O3. Prior to detection, the NOy-species are reduced to NO using a heated gold-converter with CO (5 sccm, 99.997%, PanGas, Switzerland) as reduction agent (Fahey et al., 1985). The converter is externally mounted on a window blank (Lange et al., 2002). This set-up ensures that the sampled air directly enters the heated gold tube in 15
order to avoid losses of NOy components in the inlet or other potential sampling arte-facts. The NOy inlet is facing backwards. NO and O3are sampled through a forward facing inlet with a diameter of 6 mm mounted below the converter on the same window blank.
2.2.2. Quality assurance 20
Instrument sensitivities were determined before and after the flight by mixing known amounts of NO (5 sccm of 10 ppm NO in N2) with synthetic air (1400 sccm, purity 5.0, Sauerstoffwerk Lenzburg, Switzerland). In order to maximize the overall measurement time available for comparing the two instruments, no additional in-flight calibrations were carried out. This seemed appropriate since previous SPURT campaigns showed 25
ACPD
6, 649–671, 2006 NOy instrument comparison H.-W. P ¨atz et al. Title Page Abstract Introduction Conclusions References Tables Figures J I J I Back Close Full Screen / EscPrint Version Interactive Discussion
EGU
that the sensitivity changed only by 1–3% during single flights. Nevertheless, the deter-mination of the sensitivity added a major uncertainty to the ETHZ NOy-measurements. The NO calibration gas used during the campaigns as working standard showed an uncertainty of ±3.7% (2 sigma) to the master standard used in the laboratory. This uncertainty originated from the applied calibration procedure. The NO calibration gas 5
was added upstream of the converter and, therefore, NOy-species potentially present in the working standard were also measured and contributed to the derived sensitiv-ity. The additional signal produced by these NOy-species, however, was detected and quantified only after the campaign leading to the high uncertainty in the concentration of the used working standard.
10
The efficiency of the NOy-converter was determined by gas phase titration of NO with O3 before and after the campaign. The conversion efficiency did not change sig-nificantly over a time of 7 days and was about 98% at ambient pressures of 960 hPa. The reduction of the efficiency at low pressures during flight is described in the next section.
15
The O3-channel was calibrated against a commercial ozone calibrator (Advanced Pollution Instrumentation (API) UV photometric ozone calibrator) at the beginning and end of the campaign.
2.2.3. Data treatment and uncertainty assessment
The data were processed by linearly interpolating the values of the sensitivities and 20
conversion efficiencies obtained by the calibrations of the instrument before and after the flight to each measurement point. The mean sensitivities of the NOy-, NO-, and O3-channel were 24.0±0.12 cps ppt−1, 22.4±0.2 cps ppt−1, and 580±10 cps ppb−1, re-spectively. Beside the instrument’s background signal determined for all channels, an additional value of about 105 ppt was subtracted from the ambient NOymeasurement 25
to account for a “fake NOy signal” most probably produced by impurities in the CO reduction agent (Fahey et al., 1985).
ACPD
6, 649–671, 2006 NOy instrument comparison H.-W. P ¨atz et al. Title Page Abstract Introduction Conclusions References Tables Figures J I J I Back Close Full Screen / EscPrint Version Interactive Discussion
EGU
The converter exhibits a slight dependence of the conversion efficiency on ambient pressure as reported by Lange et al. (2002). We have repeated these experiments by varying the inlet pressure in the laboratory between about 1000 and 100 hPa. As shown in Fig. 1, the conversion efficiency decreases from about 98% at sea level to 92% at a pressure of 170 hPa, in agreement with the results by Lange et al. (2002) 5
obtained from in-flight-calibrations. The results were used to determine a pressure dependent correction factor fc for the conversion efficiency ε(p)=fc(p)×ε0, where
fc(p)=1/(0.983+15.323/p−91.0481/p2) as obtained from a second order polynomial fit of the inverse pressure to the inverse efficiency shown in the figure, ε0is the conversion efficiency at 1000 hPa, and p is the pressure inside the converter. At cruise speed this 10
pressure is about 15 hPa lower than the static air pressure due to reverse sampling. As discussed in more detail below, the first data set submitted to the referee (see Sect. 3) was calculated with an erroneous pressure dependence of the conversion efficiency leading to an overestimation of the NOydata by roughly 30% at the highest altitudes.
Interferences for HCN, CH3CN, and NH3were analyzed by Lange et al. (2002) for the 15
same type of converter and inlet configuration. Interferences from these species were found to be no larger than 5% resulting in an artifact of probably less than 10 ppt in the background troposphere and the lowermost stratosphere. The conversion efficiency for HNO3 was determined in laboratory experiments to be approximately the same as for NO2. Unfortunately the reproducibility of these experiments was much lower 20
than for NO2 which therefore represents the largest source of uncertainty in the NOy measurements. Interferences to N2O are expected to be negligible at a converter temperature of 300◦C.
The precision of the NOy-, NO- and O3-channels is 11, 9, and 149 ppt s−1, respec-tively (2-sigma). The accuracy for the NO channel is determined by uncertainties in 25
the NO calibration gas (4%), and the mass flows of the calibration gas and the syn-thetic air used for dilution (2%). The accuracy of the NOy-channel contains addi-tional uncertainties in the used calibration gas introduced by addiaddi-tionally converted NOy species (3.7%, see explanation above), in the conversion efficiency for different
ACPD
6, 649–671, 2006 NOy instrument comparison H.-W. P ¨atz et al. Title Page Abstract Introduction Conclusions References Tables Figures J I J I Back Close Full Screen / EscPrint Version Interactive Discussion
EGU
species (in particular for HNO3, 10%), the reproducibility of the conversion efficiency experiments (3%) and the pressure correction (4%). The overall 2-sigma accuracy of the three channels was estimated to ±(0.126×[NOy]+11 ppt), ±(0.045×[NO]+9 ppt), and ±(0.05×[O3]+149 ppt).
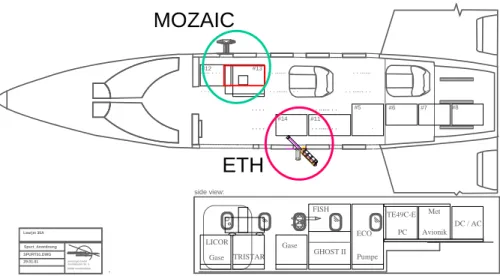
2.3. Installation 5
The instrument comparison was conducted aboard a Learjet 35A operated by GFD for the German AFO2000 project SPURT. Figure 2 gives a schematic view of the in-struments inside the aircraft. The ETHZ instrument was installed at the port side of the Learjet with the NOy-converter mounted outside the fuselage of the aircraft. The inlet for the NO and O3 measurements was mounted below the gold converter. The 10
MOZAIC instrument was installed in the front part of the cabin at the starboard side of the aircraft. The Rosemount probe was mounted on a window blank. The configuration of the instrument was exactly the same as in MOZAIC, including the inlet line.
3. Procedures
The comparison was organised in a blind fashion with U. Schmidt acting as an in-15
dependent referee. Both groups followed their normal data calibration and evaluation procedures, i.e. those applied by FZJ for MOZAIC operation (Volz-Thomas et al., 2005) and by ETHZ during the SPURT project (Hegglin et al., 2005). The primary NO cal-ibration standards of ETHZ and FZJ had been compared before the campaign and disagreed by less than 0.5%. No further exchange of standards took place during the 20
campaign.
The analysed NOy-data were submitted to the referee before information was ex-changed between the two groups. For the first delivery of the data to the referee, the ETHZ NOy-measurements had been calculated with a preliminary pressure depen-dence of the conversion efficiency, which led to an overcorrection of about 30% at the 25
ACPD
6, 649–671, 2006 NOy instrument comparison H.-W. P ¨atz et al. Title Page Abstract Introduction Conclusions References Tables Figures J I J I Back Close Full Screen / EscPrint Version Interactive Discussion
EGU
highest altitudes as compared to the correct pressure dependence (in Fig. 1) deter-mined by the subsequent laboratory tests. In addition, the sensitivity of the ETH-CLD was corrected by −3.7%, based on the final evaluation of the working standards used during the campaign against the ETH master standard that had been compared with that of FZJ. These changes were accompanied by written statements explaining the 5
reasons and the implications for the data. For transparency, the originally submitted data are first presented in the following section before the final data are discussed.
4. Results
The comparison flight took place on 29 April 2003 at the end of the 7th SPURT cam-paign. As shown in Fig. 3, the aircraft flew from Hohn-Airbase near Rendsburg in 10
Northern Germany towards Kiruna in Northern Sweden reaching 66◦N, where it turned around at about 3:00 p.m. and flew back to Hohn. The flight profile is shown in Fig. 4 overlaid on a vertical cross section of potential vorticity (PV) calculated from ECMWF data and temporally and spatially interpolated along the flight path. Judging from PV levels, the aircraft entered the stratosphere during the first level flight. Thereafter, it 15
descended into the troposphere for 20 min and entered the stratosphere again where it remained until the final descent to Hohn.
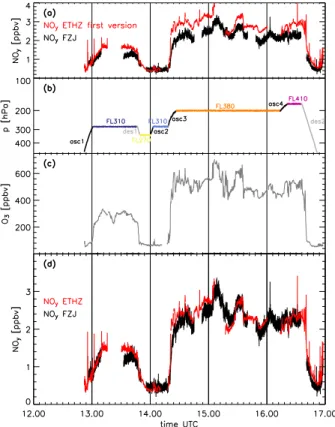
Figure 5 shows the NOymixing ratios measured by the two instruments together with pressure and the mixing ratios of O3measured by ETHZ. The colour coding identifies flight segments that should contain comparable data in terms of level flights or vertical 20
profiles. This colour coding is used in the following figures to identify data ensembles. At first sight, both NOy-instruments track quite well, both for the large changes dur-ing transitions between troposphere and stratosphere and for smaller structures. The noise of the MOZAIC instrument is about 5 times larger than that of the ECO Physics instrument, which is in line with the different sensitivities. Also seen is the good corre-25
lation between NOy and O3in the lower stratosphere as observed in other campaigns (cf., Murphy et al., 1993).
ACPD
6, 649–671, 2006 NOy instrument comparison H.-W. P ¨atz et al. Title Page Abstract Introduction Conclusions References Tables Figures J I J I Back Close Full Screen / EscPrint Version Interactive Discussion
EGU
As noted above, the corrected data (see Fig. 5c), which include the measured pres-sure dependence of the ETHZ converter, show less disagreement than the data orig-inally submitted to the referee (Fig. 5a). In particular, much smaller deviations are observed in the lower stratosphere. In the following, only the corrected data will be shown.
5
Figure 6 shows a scatter diagram of the simultaneous NOymeasurements made by the two instruments. The colour coding refers to the different flight sections indicated in Fig. 5. A linear fit to all data and considering errors in both axis gives a slope (FZJ/ETHZ) of (0.940±0.001), an intercept of (17±2 ppt), and a correlation coefficient of R=0.969. Considering only level flights improves the correlation (R=0.983). The 10
slope becomes slightly lower (0.935±0.001) and the intercept vanishes (4±3 ppt). The scatter is dominated by the random noise of the MOZAIC instrument. Exceptions from the good correlation are three ensembles also not included in the linear fit where the ETHZ data (indicated by the red square) or the MOZAIC data (indicated by the blue squares) are somewhat below the average correlation, respectively.
15
The average deviation of 6% is consistent with the combined 1 sigma inaccuracy of the two instruments (±6.8%). Larger deviations are observed after zero measurements in either instrument and particularly during the third ascent when the aircraft enters the stratosphere. Here, the MOZAIC instrument lags the ECO instrument significantly, a fact which manifests itself in the black data points in Fig. 6, identified by the large blue 20
square. This behaviour is highlighted in Fig. 7. While the memory is clearly depicted in the lower right panel, a comparison in form of vertical profiles as shown in the left panel would have suggested very large deviations between the two instruments. The time lag of approximately 120 s is due to a memory of the MOZAIC inlet line for HNO3 and corresponds almost exactly to what had been determined in laboratory tests (Volz-25
Thomas, 2005). It is also noted, however, that the correspondence between the two instruments is much better for the subsequent changes in NOy. It may thus be argued that the memory is stronger for the first increase in HNO3 from very low tropospheric levels to a few ppb than for changes in HNO3occurring on a higher background. This
ACPD
6, 649–671, 2006 NOy instrument comparison H.-W. P ¨atz et al. Title Page Abstract Introduction Conclusions References Tables Figures J I J I Back Close Full Screen / EscPrint Version Interactive Discussion
EGU
hypothesis will be tested in future laboratory tests.
5. Discussion and conclusions
We presented a comparison between the MOZAIC and the SPURT NOy instruments, during which different air masses of tropospheric and stratospheric origin were probed covering a broad range of NOymixing ratios for the testing of both instruments’ dynam-5
ical range. In general, there is good agreement between the two instruments within the stated inaccuracies. The average systematic difference of 6% (ETHZ-MOZ) could be indicative of small losses of HNO3 in the Rosemount inlet of the MOZAIC instrument. On the other hand, residual uncertainties in the ratio between the calibrations of the two instruments could explain at least half of the difference.
10
As discussed by Hegglin (2004) the temperature of the reaction chamber of the ETHZ instrument is actively controlled whereas the photomultipliers (PMT) are always cooled with maximum power. A comparison with a second ozone instrument oper-ated by FZJ (Engel et al., 2005; Hegglin, 2004) suggests that the response of the O3-channel is sensitive to PMT temperature (about −2.2%/K). However, the PMT tem-15
perature was nearly constant during the intercomparison flight with a decrease of 2◦C within the first flight hour only resulting in a maximum variation in the sensitivity of the O3-channel of 4.4%. The expected change in sensitivity for the NO and NOy channel is calculated to be somewhat smaller, i.e., 2.3% or less. Temperature fluctuations may therefore indeed have contributed to the observed differences between the first and 20
second half of the comparison flight. In the MOZAIC instrument, PMT and reaction chamber are temperature controlled.
Both instruments seem to exhibit reduced conversion efficiencies after periods of zero air addition to the inlet. A possible cause for this behavior is switching between warmer zero air and cooler ambient air which changes the thermal environment for the 25
conversion reactions. Another possibility might be the change in humidity.
ACPD
6, 649–671, 2006 NOy instrument comparison H.-W. P ¨atz et al. Title Page Abstract Introduction Conclusions References Tables Figures J I J I Back Close Full Screen / EscPrint Version Interactive Discussion
EGU
changing from air with high NOy (HNO3) to air with low NOy (HNO3). During the two descents of the aircraft, the ETHZ NOydecreases much slower than the MOZAIC NOy and also the O3measurements show a much sharper decrease in mixing ratios.
Interferences by HCN, CH3CN and NH3 have been found to be negligible (<5%) for the SPURT converter (Lange et al., 2002). In the MOZAIC converter, NH3 and 5
CH3CN are not converted either (<2%), whereas HCN is quantitatively converted (Volz-Thomas et al., 2005). Singh et al. (2003) found HCN mixing ratios in background air on the order of 100 ppt. Therefore, the different response to HCN of the two instru-ments could actually explain the small offset found in the correlation between the two datasets (see Fig. 6). Aerosol nitrate should not be detected by either instrument as 10
both sampling inlets act as virtual impactors. The ETHZ inlet designed by MPI Mainz discriminates particles with diameters >1 µm (Lange et al., 2002).
Interference by atmospheric N2O was found to be less than 3 ppt for the MOZAIC instrument. Although not explicitly investigated for the SPURT converter, it can be con-cluded from the comparison that N2O is unlikely to constitute a significant interference 15
at the converter temperature of 300◦C. Because of its nearly constant mixing ratio, N2O would rather produce a constant offset than the observed relative deviation.
The deviation is most significant in the lower stratosphere (LS), where 90% of the NOyis expected to be in the form of HNO3(Neuman et al., 2001). Therefore, the most likely explanation for the difference between the two instruments is a small (<10%) 20
loss of HNO3 in the inlet of the MOZAIC instrument or a long-term memory for both instruments. The latter could also explain the fact that the two instruments reach slightly better agreement during the second part of the flight, after the aircraft had spent more than 2 h in the LS.
The comparison between the two NOy instruments led to helpful insight in possible 25
artefacts of the applied measurement systems, which have to be explored in future lab-oratory studies. The generally good agreement between the two instruments, however, shows that the data obtained with both measurement systems provide representative information about atmospheric composition.
ACPD
6, 649–671, 2006 NOy instrument comparison H.-W. P ¨atz et al. Title Page Abstract Introduction Conclusions References Tables Figures J I J I Back Close Full Screen / EscPrint Version Interactive Discussion
EGU
Acknowledgements. We greatfully acknowledge funding for MOZAIC by the European
Com-mission, DG Research and for SPURT by the German Ministry for Education and Research (BMBF) as part of the AFO2000 programme. The ETH contribution to SPURT was funded by a research grant of ETH-Z ¨urich and by the Swiss National Science Foundation (SNF). We also
kindly acknowledge the expert assistance of the staff of enviscope and GFD during
integra-5
tion of the instruments and flight operation. Last not least, thanks are due to U. Weers und U. Parchatka for their invaluable technical support during the design and operation of the ETH NOy-instrument.
References
Bollinger, M. J., Sievers, R. E., Fahey, D. W., and Fehsenfeld, F. C.: Conversion of Nitrogen
10
Dioxide, Nitric Acid, and n-Propyl Nitrate to Nitric Oxide by Gold-Catalyzed Reduction with Carbon Monoxide, Analytical Chemistry, 55, 1980–1986, 1983.
Brough, N., Reeves, C. E., Penkett, S. A., Dewey, K., Kent, J., Barjat, H., Monks, P. S., Ziereis, H., Stock, P., Huntrieser, H., and Schlager, H.: Intercomparison of aircraft instruments on board the C-130 and Falcon 20 over southern Germany during EXPORT 2000, Atmos.
15
Chem. Phys., 3, 2127–2138, 2003,
SRef-ID: 1680-7324/acp/2003-3-2127.
Crosley, D. R.: NOy Blue Ribbon Panel, J. Geophys. Res., 101, 2049–2052, 1996.
Crutzen, P. J.: The Role of NO and NO2in the Chemistry of the Troposphere and Stratosphere,
Ann. Rev. Earth and Planetary Sci., 7, 443–472, 1979.
20
Engel, A., B ¨onisch, H., Brunner, D., Fischer, H., Franke, H., G ¨unther, G., Gurk, C., Hegglin, M. I., Hoor, P., K ¨onigstedt, R., Krebsbach, M., Maser, R., Parchatka, U., Peter, T., Schell, D., Schiller, C., Schmidt, U., Spelten, N., Szabo, T., Weers, U., Wernli, H., Wetter, T., and Wirth, V.: Highly resolved observations of trace gases in the lowermost stratosphere and upper troposphere from the Spurt project: an overview, Atmos. Chem. Phys. Discuss., 5,
25
5081–5126, 2005,
SRef-ID: 1680-7375/acpd/2005-5-5081.
Fahey, D. W., Eubank, C. S., H ¨ubler, G., and Fehsenfeld, F. C.: Evaluation of a Catalytic Reduc-tion Technique for the Measurement of Total Reactive Odd-Nitrogen NOy in the Atmosphere, J. Atmos. Chem., 3, 435–468, 1985.
ACPD
6, 649–671, 2006 NOy instrument comparison H.-W. P ¨atz et al. Title Page Abstract Introduction Conclusions References Tables Figures J I J I Back Close Full Screen / EscPrint Version Interactive Discussion
EGU
Hegglin, M. I.: Airborne NOy-, NO- and O3-measurements during SPURT: Implications for
atmospheric transport, ETH Zurich, Ph.D.-Thesis, 2004.
Hegglin, M. I., Brunner, D., Wernli, H., Schwierz, C., Martius, O., Hoor, P., Fischer, H., Par-chatka, U., Spelten, N., Schiller, C., Krebsbach, M., Weers, U., Staehelin, J., and Peter, T.: Tracing troposphere-to-stratosphere transport above a mid-latitude deep convective system,
5
Atmos. Chem. Phys., 4, 741–756, 2004,
SRef-ID: 1680-7324/acp/2004-4-741.
Hegglin, M. I., Brunner, D., Peter, T., et al.: Measurements of NO, NOy, N2O, and O3
dur-ing SPURT: Implications for transport and chemistry in the lowermost stratosphere, Atmos. Chem. Phys. Discuss., 5, 8649–8688, 2005,
10
SRef-ID: 1680-7375/acpd/2005-5-8649.
Keim, E. R., Loewenstein, M., Podolske, J. R., Fahey, D. W., Gao, R. S., Woodbridge, E. L., Wamsley, R. C., Donnelly, S. G., Delnegro, L. A., Nevison, C. D., Solomon, S., Rosenlof, K. H., Scott, C. J., Ko, M. K. W., Weisenstein, D., and Chan, K. R.: Measurements of the NOy–
N2O correlation in the lower stratosphere: Latitudinal and seasonal changes and model
15
comparisons, J. Geophys. Res., 102, 13 193–13 212, 1997.
Lange, L., Fischer, H., Parchatka, U., Gurk, C., and Zenker, T.: Characterization and application of an externally mounted catalytic converter for aircraft measurements of NOy, Rev. Sci. Inst., 73, 3051–3057, 2002.
Murphy, D. M., Fahey, D. H., Proffitt, M. H., Liu, S. C., Chan, K. R., Eubank, C. S., Kawa, S. R.,
20
and Kelly, K. K.: Reactive Nitrogen and its Correlation With Ozone in the Lower Stratosphere and Upper Troposhere, J. Geophys. Res., 98, 8751–8773, 1993.
Neuman, J. A., Gao, R. S., Fahey, D. W., Holecek, J. C., Ridley, B. A., Walega, J. G., Grahek, F. E., Richard, E. C., McElroy, C. T., Thompson, T. L., Elkins, J. W., Moore, F. L., and Ray,
E. A.: In situ measurements of HNO3, NOy, NO, and O3in the lower stratosphere and upper
25
troposphere, Atmos. Environ., 35, 5789–5797, 2001.
Ryerson, T. B., Huey, L. G., Knapp, K., Neuman, J. A., Parrish, D. D., Sueper, D. T., and Fehsen-feld, F. C.: Design and initial characterization of an inlet for gas-phase NOy measurements from aircraft, J. Geophys. Res., 104, 5483–5492, 1999.
Singh, H. B., Salas, L., Herlth, D., Kolyer, R., Czech, E., Viezee, W., Li, Q., Jacob, D. J., Blake,
30
D., Sachse, G., Harward, C. N., Fuelberg, H., Kiley, C. M., Zhao, Y., and Kondo, Y.: In situ
measurements of HCN and CH3CN over the Pacific Ocean: Sources, sinks, and budgets, J.
ACPD
6, 649–671, 2006 NOy instrument comparison H.-W. P ¨atz et al. Title Page Abstract Introduction Conclusions References Tables Figures J I J I Back Close Full Screen / EscPrint Version Interactive Discussion
EGU Volz-Thomas, A., Berg, M., Heil, T., Houben, N., Lerner, A., Petrick, W., Raak, D., and P ¨atz,
H.-W.: Measurements of total odd nitrogen (NOy) aboard MOZAIC in-service aircraft: instru-ment design, operation and performance, Atmos. Chem. Phys., 5, 583–595, 2005,
ACPD
6, 649–671, 2006 NOy instrument comparison H.-W. P ¨atz et al. Title Page Abstract Introduction Conclusions References Tables Figures J I J I Back Close Full Screen / EscPrint Version Interactive Discussion
EGU Lab calibrations July and August 2003
Lab calibration January 2004
Fit applied to all SPURT data
pressure at converter exit (hPa)
Conver sion effi ci enc y
ACPD
6, 649–671, 2006 NOy instrument comparison H.-W. P ¨atz et al. Title Page Abstract Introduction Conclusions References Tables Figures J I J I Back Close Full Screen / EscPrint Version Interactive Discussion EGU side view: Learjet 35A Spurt_Anordnung SPURT01.DWG 29.01.01 enviscope GmbH Arnoldshainer Str. 5 60489 Frankfurt/Main #7 #6 #8 #5 FISH GHOST II ECO TE49C-E Gase LICOR Gase TRISTAR PC Met Avionik DC / AC Pumpe #11 #14 #13 #12
MOZAIC
ETH
side view: Learjet 35A Spurt_Anordnung SPURT01.DWG 29.01.01 enviscope GmbH Arnoldshainer Str. 5 60489 Frankfurt/Main #7 #6 #8 #5 FISH GHOST II ECO TE49C-E Gase LICOR Gase TRISTAR PC Met Avionik DC / AC Pumpe #11 #14 #13 #12MOZAIC
ETH
Fig. 2. Installation of the instruments aboard the Learjet during the intercomparison flight within SPURT.
ACPD
6, 649–671, 2006 NOy instrument comparison H.-W. P ¨atz et al. Title Page Abstract Introduction Conclusions References Tables Figures J I J I Back Close Full Screen / EscPrint Version Interactive Discussion
EGU Fig. 3. Flight track of the Learjet itinerary and potential vorticity (PV) on the 220 hPa surface.
ACPD
6, 649–671, 2006 NOy instrument comparison H.-W. P ¨atz et al. Title Page Abstract Introduction Conclusions References Tables Figures J I J I Back Close Full Screen / EscPrint Version Interactive Discussion
EGU Fig. 4. Height profile of the flight and vertical PV-field interpolated in space and time along the
ACPD
6, 649–671, 2006 NOy instrument comparison H.-W. P ¨atz et al. Title Page Abstract Introduction Conclusions References Tables Figures J I J I Back Close Full Screen / EscPrint Version Interactive Discussion
EGU
17 Figure 5. NOy mixing ratios measured by ETHZ (SPURT, red) and by FZJ (MOZAIC, black)
during the intercomparison flight. Panel (a) shows the original NOy data as reported
immediately after the flight to the referee. Panel (d) displays the data after implementing a corrected pressure dependence of the ETHZ-SPURT converter as explained in the text. Panel (c) shows the ozone mixing ratios measured by ETHZ and panel (b) the pressure during the
Fig. 5. NOymixing ratios measured by ETHZ (SPURT, red) and by FZJ (MOZAIC, black) during the intercomparison flight. Panel(a) shows the original NOydata as reported immediately after
the flight to the referee. Panel(d) displays the data after implementing a corrected pressure
dependence of the ETHZ-SPURT converter as explained in the text. Panel(c) shows the ozone
mixing ratios measured by ETHZ and panel(b) the pressure during the flight. The different
ACPD
6, 649–671, 2006 NOy instrument comparison H.-W. P ¨atz et al. Title Page Abstract Introduction Conclusions References Tables Figures J I J I Back Close Full Screen / EscPrint Version Interactive Discussion
EGU Fig. 6. Correlation between the NOy-data by ETHZ and FZJ (1 s averages). The colour coding
corresponds to the flight segments highlighted in Fig. 5. The boxes denote data collected after calibrations of the instruments. The blue dashed line indicates the one to one correspondence. A linear fit to the data including errors in x and y (red line) yields:
FZJ-NOy=(0.940±0.001) ETHZ-NOy+(17±2) ppt; R=0.969
The fit for levels only and excluding the first 5 minutes after calibrations yields:
ACPD
6, 649–671, 2006 NOy instrument comparison H.-W. P ¨atz et al. Title Page Abstract Introduction Conclusions References Tables Figures J I J I Back Close Full Screen / EscPrint Version Interactive Discussion EGU 280 260 240 220 200 0 1 2 3 0 51600 51800 52000 52200 52400 1 2 3 0.0 0.1 0.2 0.3 0.4 0.5 0.6 0.7 48000 52000 56000 60000 0 1 2 3 Ozone/200 ETH NOy FZJ NOy ETH NO Mixing ratio [ppb] p [h Pa] Ozone/200 ETH NOy FZJ NOy End of as c ent Mi x ing r a ti o [ ppb]
Time of day [s UT]
ETH NO N O [p p b ] N O y [ppb ]
Fig. 7. Blow up of the ascent into the lower stratosphere from flight level 380 to 270 (right panel)
highlighting the memory of the FZJ-Instrument (red: ETHZ-NOy, green: FZJ-NOy). Ozone
(black) and NO (blue) are shown for comparison. The left panel shows the data as vertical profiles.