HAL Id: hal-00296546
https://hal.archives-ouvertes.fr/hal-00296546
Submitted on 15 May 2008
HAL is a multi-disciplinary open access
archive for the deposit and dissemination of
sci-entific research documents, whether they are
pub-lished or not. The documents may come from
teaching and research institutions in France or
abroad, or from public or private research centers.
L’archive ouverte pluridisciplinaire HAL, est
destinée au dépôt et à la diffusion de documents
scientifiques de niveau recherche, publiés ou non,
émanant des établissements d’enseignement et de
recherche français ou étrangers, des laboratoires
publics ou privés.
of tropospheric aerosols
F. Yu, Z. Wang, G. Luo, R. Turco
To cite this version:
F. Yu, Z. Wang, G. Luo, R. Turco. Ion-mediated nucleation as an important global source of
tro-pospheric aerosols. Atmospheric Chemistry and Physics, European Geosciences Union, 2008, 8 (9),
pp.2537-2554. �hal-00296546�
www.atmos-chem-phys.net/8/2537/2008/ © Author(s) 2008. This work is distributed under the Creative Commons Attribution 3.0 License.
Chemistry
and Physics
Ion-mediated nucleation as an important global source of
tropospheric aerosols
F. Yu1, Z. Wang2, G. Luo1,2, and R. Turco3
1Atmospheric Sciences Research Center, State University of New York, 251 Fuller Road, Albany, New York 12203, USA 2NZC/LAPC, Institute of Atmospheric Physics, Chinese Academy of Sciences, Beijing 100029, China
3Dept. of Atmospheric and Oceanic Sciences, Univ. of California, 405 Hilgard Ave, Los Angeles, California 90095, USA
Received: 17 August 2007 – Published in Atmos. Chem. Phys. Discuss.: 17 September 2007 Revised: 4 January 2008 – Accepted: 12 April 2008 – Published: 15 May 2008
Abstract. Aerosol nucleation events have been observed at a variety of locations worldwide, and may have signifi-cant climatic and health implications. While ions have long been suggested as favorable nucleation embryos, their sig-nificance as a global source of particles has remained uncer-tain. Here, an ion-mediated nucleation (IMN) mechanism, which incorporates new thermodynamic data and physical algorithms, has been integrated into a global chemical trans-port model (GEOS-Chem) to study ion-mediated particle for-mation in the global troposphere. The simulated annual mean results have been compared to a comprehensive set of data relevant to particle nucleation around the globe. We show that predicted annual spatial patterns of particle formation agree reasonably well with land-, ship-, and aircraft-based observations. Our simulations show that, globally, IMN in the boundary layer is largely confined to two broad latitude belts: one in the northern hemisphere (∼20◦N–70◦N), and one in the southern hemisphere (∼30◦S–90◦S). In the mid-dle latitude boundary layer over continents, the annual mean IMN rates are generally above 104cm−3day−1, with some
hot spots reaching 105cm−3day−1. The zonally-averaged
vertical distribution of IMN rates indicates that IMN is sig-nificant in the tropical upper troposphere, the entire middle latitude troposphere, and over Antarctica. Comparing the rel-ative strengths of particle sources due to IMN and due to pri-mary particle emissions demonstrates that IMN is significant on a global scale. Further research is needed to reduce mod-eling uncertainties and to understand the ultimate contribu-tion of freshly nucleated particles to the abundance of cloud condensation nuclei.
Correspondence to: F. Yu (yfq@asrc.cestm.albany.edu)
1 Introduction
Atmospheric particles perturb the Earth’s energy budget di-rectly by scattering and absorbing radiation and indidi-rectly by acting as cloud condensation nuclei (CCN) and thus changing cloud properties and influencing precipitation. The aerosol indirect radiative forcing is largely determined by the number abundance of particles that can act as cloud conden-sation nuclei (CCN) (e.g., Twomey, 1977; Albrecht 1989; Charlson et al., 1992). The magnitude of the aerosol indi-rect radiative forcing is poorly constrained in climate mod-els, and this represents the dominant uncertainty in assessing climate change (NRC, 2005; IPCC, 2007). To reduce the un-certainty in the calculation of aerosol radiative forcing and to improve our prognostic capability of Earth’s climate, the key processes controlling the number size distributions of at-mospheric aerosols have to be understood and properly in-corporated in the large scale models. New particle formation frequently observed throughout the troposphere is an impor-tant source of atmospheric CCN and is one of key processes that need to be accurately represented in future generations of climate models (Ghan and Schwartz, 2007).
Over the past several years, a growing number of stud-ies have focused on new particle formation in the global atmosphere. Spracklen et al. (2006) employed an empir-ical nucleation rate formulation (J =2×10⁻⁶s−1 [H
2SO4],
where [H2SO4] is the sulfuric acid vapor concentration in
cm−3) to study the contribution of boundary layer
nucle-ation events to total particle concentrnucle-ations on regional and global scales. Taking a different approach, Kazil et al. (2006) used monthly-mean SO2concentrations, a parameterized OH
diurnal cycle, and daily mean temperatures and relative hu-midities to calculate the formation rates of sulfate aerosol in the marine troposphere (over oceans only), considering neu-tral and charged nucleation processes involving H2SO4and
H2O, by applying the box model of Lovejoy et al. (2004) on
grids embedded into 4 isobaric surfaces of the troposphere (925, 700, 550, and 300 hPa). Lucas and Akimoto (2006), on the other hand, used a 3-D global chemical transport model to evaluate models of binary (Vehkam¨aki et al., 2002), ternary (Napari et al., 2002), and ion-induced (Lovejoy et al., 2004; Modgil et al., 2005) nucleation.
Lucas and Akimoto (2006) found that the binary nucle-ation model of Vehkam¨aki et al. (2002) and ion-induced nu-cleation model of Lovejoy et al. (2004) predict new parti-cle formation only in the colder upper troposphere. Their simulations also showed that binary nucleation rates based on Vehkam¨aki et al. (2002) are generally several orders of magnitude higher than the ion-induced nucleation rates based on the parameterization of Lovejoy et al. (2004)’s model. However, recent studies indicate that the BHN model of Vehkam¨aki et al. (2002) may have overestimated the BHN rates by around three orders of magnitude (Hanson and Love-joy, 2006; Yu, 2007) and ion-induced nucleation model of Lovejoy et al. (2004) may have underestimated the ion in-duced nucleation rates by more than two to four orders of magnitude (Yu and Turco, 2008). Given these substantial conflicts in current nucleation model predictions, it appears there is a serious weakness in our ability to determine ac-curately the relative and absolute contributions of competing nucleation mechanisms to new particle production in the tro-posphere.
Yu (2006a) utilized a kinetically consistent ion-mediated nucleation model (IMN) to demonstrate that ions can lead to significant particle formation not only in the upper tropo-sphere but also in the lower tropotropo-sphere (including bound-ary layer). The role of ions in many boundbound-ary layer nu-cleation events has been recently confirmed by observations of evolving charged cluster distributions exhibiting signifi-cant overcharging in the nanometer size range during nucle-ation events (Vana et al., 2006; Hirsikko et al., 2007; Laakso et al., 2007). Nevertheless, the relative importance of ion-mediated nucleation versus neutral nucleation under vary-ing atmospheric conditions remains unresolved (Vana et al., 2006; Iida et al., 2006; Hirsikko et al., 2007; Laakso et al., 2007; Kulmala et al., 2007; Yu and Turco, 2007, 2008). It appears that new nanometer-sized particles are overcharged during more than 90% of nucleation events sampled during spring 2005 in Hyyti¨al¨a, Finland, during the BACCI/QUEST IV field campaign (Laakso et al., 2007). Laakso et al. (2007) followed through with an analytical analysis indicating a rel-atively small contribution due to ion nucleation. More re-cently, Kulmala et al. (2007) analyzed multiple-instrument measurements of neutral and charged nanometer-sized clus-ter concentrations taken in Hyyti¨al¨a, Finland in Spring 2006 and concluded that neutral nucleation dominated over ion-induced nucleation under boreal forest conditions. Yu and Turco (2008) extended earlier IMN analyses (Yu and Turco, 2007) to include detailed case studies of six representa-tive nucleation events observed in Hyyti¨al¨a. These specific
replications showed that, under the general conditions corre-sponding to most of nucleation event days, the IMN model reasonably reproduces a range of observational parameters, including critical nuclei sizes, size-dependent overcharging ratios, the concentrations of sub-3 nm stable clusters and 3– 6 nm particles, and the diurnal variations of these particles. The new results thus appear to provide strong support for the IMN mechanism.
The objective of the present paper is to study the signifi-cance of the IMN mechanism as a global source of new par-ticles, and to determine the spatial patterns of Earth’s nu-cleation zones. To achieve the objective, the IMN mecha-nism was integrated into a global chemical transport model (GEOS-Chem). For validation purposes, the simulated re-sults were compared with land-, ship-, and aircraft-based measurements related to particle formation. The model and data used in this study are briefly described in Sects. 2 and 3, respectively. Section 4 presents modeling results and com-parisons with measurements. A summary and discussion is given in Sect. 5.
2 GEOS-Chem model
To study particle nucleation in the global atmosphere, we in-clude our IMN mechanism in the GEOS–Chem model which is a global 3-D model of atmospheric composition driven by assimilated meteorological observations from the Goddard Earth Observing System (GEOS) of the NASA Global Mod-eling Assimilation Office (GMAO). Meteorological fields in-clude surface properties, humidity, temperature, winds, cloud properties, heat flux and precipitation. The GEOS-3 data, in-cluding cloud fields, have 6-h temporal resolution (3-hour resolution for surface fields and mixing depths), 1◦×1◦ hor-izontal resolution, and 48 vertical sigma levels extending from the surface to approximately 0.01 hPa. The horizon-tal resolution can be degraded and vertical layers merged for computational efficiency. For the results presented in this pa-per, the GEOS-3 grid with 2◦
×2.5◦horizontal resolution and 30 vertical levels was used. The first 15 levels in the model are centered at approximately 10, 50, 100, 200, 330, 530, 760, 1100, 1600, 2100, 2800, 3600, 4500, 5500, and 6500 m above surface.
The GEOS-Chem model includes a detailed simulation of tropospheric ozone-NOx-hydrocarbon chemistry as well as
of aerosols and their precursors (Park et al., 2004). In addi-tion to sulfate and nitrate aerosols, the model also considers organic and elemental carbon aerosols (Park et al., 2003), dust (Fairlie et al., 2004), and sea salt aerosol (Alexander et al., 2005). Aerosol and gas-phase simulations are coupled through sulfate and nitrate formation, heterogeneous chem-istry (Evans and Jacob, 2005), aerosol effects on photolysis rates (Martin et al., 2003), and secondary organic aerosol formation. The ISORROPIA thermodynamic equilibrium model (Nenes et al., 1998) is used to calculate partitioning
of total ammonia and nitric acid between the gas and aerosol phases. A detailed description of the model (including the treatment of various emission sources, chemistry and aerosol schemes) can be found in the model webpage (http://www. as.harvard.edu/chemistry/trop/geos/index.html).
The sulfur emission in GEOS-CHEM (Park et al., 2004) includes: 1) the fossil fuel and industrial emission (Benkovitz et al., 1996; Bey et al., 2001), 2) the gridded monthly aircraft and shipping emissions (Chin et al., 2000), 3) the biofuel emission based on the global biofuel CO emis-sion from Yevich and Logan (2003), 4) the biomass burn-ing emissions from Duncan et al. (2003), 5) the oceanic DMS emission calculated with an empirical formula from Liss and Merlivat (1986), and 6) the volcano emission from the database of Andres and Kasgnoc (1998). In the original version of GEOS-CHEM (v7-03-06), the fossil fuel and in-dustrial emission is obtained by scaling the gridded, season-ally resolved inventory from the Global Emissions Inventory Activity (GEIA) for 1985 (Benkovitz et al., 1996) with up-dated national emission inventories and fuel use data (Bey et al., 2001). In this study, the SO2database from EDGAR 3.2,
which fully considered the productions of energy, fossil fuel, biofuel, industrial processes, agriculture and waste handling (Olivier, 2001), is used to update the GEOS-CHEM anthro-pogenic sulfur emission data to year 2002. The global grid-ded scaling factor is derived according to the historical trend from 1990 to 2000. Due to the uncertainty of the emissions from sporadically erupting volcanoes, we only consider the continuously active volcanoes emission in this study.
3 Data relevant to atmospheric particle formation
3.1 Land based measurements
New particle formation has been observed extensively at many locations around the globe. Kulmala et al. (2004) pro-vides a comprehensive review of measurements relevant to the formation of particles in ambient atmosphere. All of the cases with defined particle formation rates as listed in Kulmala et al. (2004) are used in this study for comparison. Table 1 gives additional sets of particle formation data pub-lished since 2004, which are also considered for comparison in this study.
3.2 Ship based measurements
In a number of field campaigns, total concentrations of densation nuclei (CN, diameter >∼12 nm) and ultrafine con-densation nuclei (UCN, diameter >∼3 nm) in the surface layer of the ocean were continuously measured with CN counters during ship cruises. The average particle formation rates at a given day can be estimated based on the change (increase) rates in the UCN and CN concentration difference (i.e., CUCN–CCN)typically during the morning hours.
Table A1 in Appendix A gives the ship-based particle formation rates we have derived from the measurements obtained during the following field campaigns: RITS94, INDOEX99, ACE-Asia, ACE-2, ACE-1, NAURU99, NEAQS02, and NEAQS04. The original data were ob-tained from NOAA PMEL Atmospheric Chemistry Data Server (http://saga.pmel.noaa.gov/data/) where more infor-mation about the field campaigns can be found. In Table A1 we also include two additional sets of particle formation rates estimated from two published papers (Davison et al., 1996; Koponen et al., 2002).
3.3 Aircraft based measurements
Clarke and Kapustin (2002) published a survey of exten-sive aerosol data collected around the Pacific Basin during a number of field campaigns: Global Backscatter Experi-ment (GLOBE), First Aerosol Characterization ExperiExperi-ment (ACE-1), and Pacific Exploratory Mission (PEM)-Tropics A and B. The ultrafine condensation nuclei (UCN) counter was used to detect all particles larger than ∼3–4 nm. The aircraft-based measurements considered in this study include the total UCN concentrations measured during GLOBE, ACE-1, and PEM-Tropics A and B (data obtained from Kapustin – about 146 600 10-second-average data points), as well as data from two more recent field missions: TRAnsport and Chemical Evolution over the Pacific (TRACE-P), and the Interconti-nental Chemical Transport Experiment-Phase A (INTEX-A). TRACE-P and INTEX-A (about 100 000 10-second-average data points) significantly increased the number of observa-tions for the Northern Hemisphere. TRACE-P and INTEX-A measurements were obtained from NINTEX-ASINTEX-A’s Global Tropo-spheric Experiment (GTE) database website.
4 Simulations and comparisons with observations
The nucleation module used in this study is composed of look-up tables of pseudo-steady state nucleation rates un-der various conditions that are un-derived by running the de-tailed IMN model (Yu, 2006a). The current version of the IMN model only considers the binary H2SO4-H2O system.
The tabulated ion-mediated nucleation rates (JIMN)depend
on the following variables: sulfuric acid vapor concentra-tion, [H2SO4] (cm−3); relative humidity, RH; temperature,
T (K); ionization rate, Q (ion-pairs cm−3s−1); and the local
surface area density of pre-existing particles, S0(µm2cm−3).
Thus, JIMN=f ([H2SO4], RH, T , Q, S0). In the look-up
ta-bles, T ranges from 190 K to 300 K with a resolution of 2 K and RH ranges from 1% to 99% with a resolution of 2%. In the sub-table for relatively high T range (T ≥250), [H2SO4] ranges from 5×10⁵–5×108cm−3with a resolution
of 10 values per decade (geometric), Q ranges from 1.5– 30 ion-pairs cm−3s−1 with a resolution of 10 values per
Table 1. Measurements of particle formation events in addition to those listed in the review paper by Kulmala et al. (2004). J3 and J10 refer
to the “apparent” formation rates of 3 nm and 10 nm particles during the nucleation periods, respectively (in cm−3s−1)(refer to Turco et al., 1998, for a discussion of apparent nucleation rates).
Location Time period # of events J3 J10 Growth rates (nm/hr) references
Rochester, USA 12/2001–12/2003 307 3 5-12 Jeong et al., 2004, 2006 (43◦
10′
N, 77◦
36′
W) Hopke and Utell, 2005
V¨arri¨o, Finland (67◦ 46′ N, 29◦ 35′ E) 1998-2002 147 0.1 0.5–10 Vehkam¨aki et al., 2004 Sumas Mountain (49◦ 03′ N, 122◦15′W) 8/13/2001–9/01/2001 5 5 5–10 Mozurkewich et al., 2004 Antarctica (70◦45′S, 11◦44′E)
1/10/1997–2/24/1997 14 0.1–0.8 Deshpande and Kamra, 2004 Pittsburgh, USA (40◦ 26′ N, 79◦ 59′ W) 07/2001–06/2002 107 1–10 Stanier et al., 2004 Po Valley, Italy 03/24/2002–08/24/2004 304 ∼7 0.3–22.2 Laaksonen et al., 2005 (44◦39′N, 11◦37′E) Hamed et al., 2007
New Deli, Indian (28◦35′N,
77◦12′E)
10/26/2002–11/09/2002 8 ∼7.3 11.6–18.1 M¨onkk¨onen et al., 2005 Santa Ana, Mexico (19◦
11′ N, 98◦ 59′ W) 4/10/2003–4/20/2003 2 ∼10 4.7 Dunn et al., 2004 CENICA, Mexico (19◦ 21′ N, 99◦ 04′ W) 5/2/2003–5/11/2003 3 ∼4 Dunn et al., 2004 Tumbarumba, Australia (35◦40′S, 148◦15′E) 2005 ∼100 0.15 1–6.5 Suni et al., 2006 Mukteswar, Himalaya Mt. (29◦ 31′ N, 79◦ 39′ E) 3/23/2006–7/7/2006 23 0.4 Lihavainen et al., 2006 Anmyeon, S. Korea (36◦ 22′ N, 126◦ 19′ E) 01/2005–12/2005 24 1.5 Lee et al., 2006 Beijing, China 03/2004–02/2005 ∼170 ∼1.5 0.1–13.5 Wehner et al., 2006; (39◦55′N, 116◦25′E) Wu et al., 2007 Gosan, S. Korea (33◦17′N, 126◦10′E) 03/11/2005–04/08/2005 ∼6 ∼1.5 Yum et al., 2006 Houston, USA (29◦ 54′ N, 95◦ 20′ W) 8/22/2004–8/29/2004 ∼8 ∼2 Fan et al., 2006 Marseille, France (43◦ 19′ N, 5◦42′E) 7/1/2002–7/19/2002 4 3–5.3 2-8 Pet¨aj¨a et al., 2007 Athens, Greece (38◦9′N, 23◦45′E) 6/11/2003–6/26/2003 7 1.3–6.5 1.2–9.9 Pet¨aj¨a et al., 2007 St. Louis, USA (38◦ 36′ N, 90◦ 09′ W) 4/1/2001–5/31/2003 155 8–14 4.7 Qian et al., 2007 Pear River Delta, China
(22◦ 36′ N, 113◦ 36′ E) 10/3/2004–11/5/2004 4 4–6 6.8–13.8 Gong et al., 2008
a resolution of 5 values per decade (geometric) plus one point at S0=1 µm2cm−3. In the sub-table for relatively
low T range (T <250 K), [H2SO4] ranges from 5×10⁵–
5×107cm−3with a resolution of 10 values per decade
(ge-ometric), Q ranges from 5–50 ion-pairs cm−3s−1with a
res-olution of 10 values per decade (geometric), S0ranges from
10–100 µm2cm−3 with a resolution of 5 values per decade
(geometric) plus one point at S0=1 µm2cm−3. At given
val-ues of [H2SO4], T , RH, Q, and S0, JIMN can be decided
using the look-up tables with an efficient multiple-variable interpolation scheme similar to the one given in Yu (2006b) except that the number of variables increases from 3 to 5. The differences between the interpolated values of JIMNand
those corresponding values calculated with full IMN model are generally within a few percentages.
In the current version of GEOS-Chem (v7-03-06), H2SO4
vapor concentration ([H2SO4]) is not explicitly resolved (all
H2SO4gas produced is moved to particulate phase
instanta-neously). We have modified the code and now [H2SO4] is a
prognostic variable. The change of [H2SO4] is determined
by d[H2SO4]/dt=P–CS×[H2SO4], where P is the production
rate of [H2SO4] from gas phase chemistry (mainly OH+SO2)
and CS is the condensation sink for H2SO4 gas associated
with the condensation of H2SO4vapor on pre-existing
par-ticles. The ability of the GEOS-Chem model to predict the global OH concentration field has been evaluated indepen-dently by Bey et al. (2001). CS and S0are calculated from
the particle mass predicted in the GEOS-Chem and assumed particle sizes. The transport and deposition of H2SO4
va-por are also taken into account in the model. The global ionization rates due to cosmic rays are calculated based on the schemes given in Usoskin and Kovaltsov (2006) and the contribution of radioactive materials from soil to ionization rates is parameterized based on the profiles given in Reiter (1992). We run the GEOS-Chem coupled with nucleation module for one year from 07/01/2001 to 06/30/2002. The
time step for transport is 15 min and for chemistry (and nu-cleation) is 30 min. Figure 1 presents the simulated hori-zontal (averaged in seven lowest model layers representing the boundary layer) and vertical (zonal-averaged) spatial dis-tributions of annual mean SO2 concentration, condensation
sink, and [H2SO4]. The calculations of CS, [H2SO4], and
hence nucleation rates are only limited to grid boxes within GEOS-Chem’s annual mean tropopause.
Figures 1a and 1b shows that the high SO2concentration
zones are generally confined to source regions. The annual mean SO2surface layer concentrations in large areas of
east-ern United States, Europe, easteast-ern China, Indian, Mexico, and Chile are above 1 ppb with some hot spots above 3 ppb. Vertically, high SO2concentration (zonal average >0.1 ppb,
note the difference in the scale of Fig. 1a and b) zone can reach up to around 700 hpa (σ =∼0.7) with the highest con-centration limited to below 800 hpa in the northern hemi-sphere. The relatively low SO2concentration in middle and
upper tropical (∼20◦S–30◦N) troposphere is probably due to relatively weak SO2sources and high scavenging rate
as-sociated with convection and precipitation. The relatively high SO2concentration over Antarctica is mainly associated
with DMS emission near the Antarctic coast. The extension of high SO2 zone from surface up to 300 hpa around
lati-tude of 30◦S is associated with mountain uplifting of anthro-pogenic SO2 emission in Chile and direct injection of SO2
into middle troposphere from the continuously active vol-cano Lascar in Chile (2400 Mg-SO2/day, 23.32◦S, 67.44◦W,
elevation 5.6 km).
It is clear from Fig. 1c and d that large areas of eastern and southern Asia, western Europe, eastern United States, south-ern America, and Africa have high CS associated with an-thropogenic emission, biomass burning, and dust emission. Vertically, the high CS zone centered around 30◦N extends to ∼600–700 hpa. In contrast to Artic region which is in-fluenced by regional transport of particle pollutants, the CS around Antarctica is very low. In addition to sea salt emis-sion, the CSs over oceans adjacent to continents are signif-icantly affected by transported particles. The concentration of H2SO4vapor (Fig. 1e, f) is determined by its production
rate (mainly controlled by SO2 and OH concentration) and
loss rate (condensation sink). The highest [H2SO4] regions
are confined to areas of high SO2 concentration, high
an-nual irradiance flux, and low CS. In regions of higher SO2
as well as higher CS, it appears that the increased produc-tion dominates and thus [H2SO4] is generally higher.
Verti-cally, [H2SO4] generally decreases with altitude due to the
more rapidly decrease of SO2 with altitude. The relatively
high [H2SO4] in tropical upper troposphere is due to the very
lower CS calculated in the model. It should be noted that many factors (including sub-grid processes) may influence the accuracy of [H2SO4] simulated in global models such as
GEOS-Chem. Further research is needed to reduce the uncer-tainties in [H2SO4] calculations by comparing the modeled
values with observed ones at selected locations and time
pe-riods where and when data are available. Figure 2 shows the predicted annual mean nucleation rates averaged within the seven lowest model layers (∼0–930 m) representing the at-mospheric boundary layer. Also given for comparison are av-erage particle formation rates derived from various surface-based measurements (refer to Sect. 3 for details). Observed nucleation events typically last for ∼3 h a day (e.g., Birmili et al., 2003; Laakso et al., 2004; Stanier et al., 2004; Qian et al., 2007), and thus an observed average nucleation rate of 1 particle cm−3s−1is equivalent to roughly 104 particles
cm−3day−1. We have used this equivalence to cross-calibrate
the color bars in the figure.
Our simulations show that, globally, nucleation in the boundary layer is largely confined to two broad latitude belts: one in the northern hemisphere (∼20◦N–70◦N), and one in the southern hemisphere (∼30◦S–90◦S). In the boundary layer, nucleation rates over continents are generally much higher than those over oceans. In the middle latitude bound-ary layer over continents, the annual mean new particle pro-duction rates are generally above 104cm−3day−1, with some
hot spots reaching 105cm−3day−1. Over middle latitude
oceanic boundary layer, the annual mean new particle pro-duction rates are generally below 2500 cm−3day−1. As can
be seen from the high nucleation rates in the vicinity of an-thropogenic sources and spatial patterns of SO2
concentra-tions, most boundary layer nucleation events in the northern hemisphere (except over remote ocean areas, and Greenland) are associated with anthropogenic SO2 emissions; in the
southern hemisphere, nucleation is triggered both by oceanic DMS and anthropogenic SO2. It should be noted that the
relative contributions of anthropogenic and natural SO2 to
nucleation farther away from anthropogenic source regions are not addressed here.
Owing to higher temperatures, nucleation rates in the boundary layer at tropical latitudes (30◦S–30◦N, except some regions with high SO2 source) are negligible even
though H2SO4gas concentrations are at medium level (see
Fig. 1c). Particle formation over the Antarctica occurs mainly during the austral summer season. The simulations also indicate that nucleation induced by anthropogenic SO2
emission contributes to particle abundances in the southern hemisphere. The high nucleation zone along the Chile coast in South American appears to be a significant source of new particle in the southern hemisphere. The relatively higher nu-cleation rate over Antarctica is due to lower CS, colder tem-peratures, and higher ionization rates. By contrast, annual mean nucleation rates in the Arctic region (∼70◦N–90◦N) are much lower due to relatively high concentrations of pre-existing particles associated with regional pollution (Arctic haze).
0.006 0.01 0.03 0.06 0.1 0.3 0.6 1 3 6 10 30 (ppb) 0.005 0.01 0.02 0.035 0.05 0.1 0.2 0.35 0.5 1 2 3 (ppb) _ _ _ _ _ _ _ _ _ _ _ _ _ 180 120W 60W 0 60E 120E 90N 90S 60N 60S 30N 30S EQ (a) SO2 Longitude L at it ude _ _ (b) SO2 _ _ _ _ _ _ _ _ _ 1.0 0.9 0.8 0.7 0.6 0.5 0.4 0.3 0.2 | | | | | | | 90N 90S 60S 30S EQ 30N 60N Sigma _ Latitude 0.05 0.1 0.25 0.5 1 2.5 5 10 25 50 100 (x10 s )-3 -1 _ _ _ _ _ _ _ _ _ _ _ _ _ 180 120W 60W 0 60E 120E 90N 90S 60N 60S 30N 30S EQ (c) CS Longitude L at it ude _ _ _ _ _ _ _ _ _ _ 1.0 0.9 0.8 0.7 0.6 0.5 0.4 0.3 0.2 | | | | | | | 90N 90S 60S 30S EQ 30N 60N Sigma 0.05 0.1 0.25 0.5 1 2.5 5 10 25 50 100 (x10 s )-3 -1 _ (d) CS Latitude _ _ _ _ _ _ _ _ _ _ _ _ _ _ 180 120W 60W 0 60E 120E 90N 90S 60N 60S 30N 30S EQ 0.01 0.03 0.1 0.3 0.6 1 3 6 10 30 60 100 (x10 cm )6 -3 (e) [H SO ]2 4 Longitude L at it ude (f) [H SO ]2 4 0.01 0.05 0.1 0.2 0.3 0.5 1 2 3 5 10 (x10 cm )6 -3 _ _ _ _ _ _ _ _ _ 1.0 0.9 0.8 0.7 0.6 0.5 0.4 0.3 0.2 | | | | | | | 90N 90S 60S 30S EQ 30N 60N _ Sigma Latitude
Fig. 1. Horizontal (a, c, e: average over first seven model layers above Earth’s surface) and vertical (b, d, f: sigma=pressure/surface pressure)
distributions of annual mean values of SO2mixing ratio, condensation sink (CS), and [H2SO4]. We run the GEOS-Chem coupled with nucleation model for one year from 07/01/2001 to 06/30/2002. The time step for transport is 15 minutes and for chemistry (and nucleation) is 30 minutes. The calculations of CS, [H2SO4], and hence nucleation rates are only limited to grid boxes below GEOS-Chem’s annual mean tropopause.
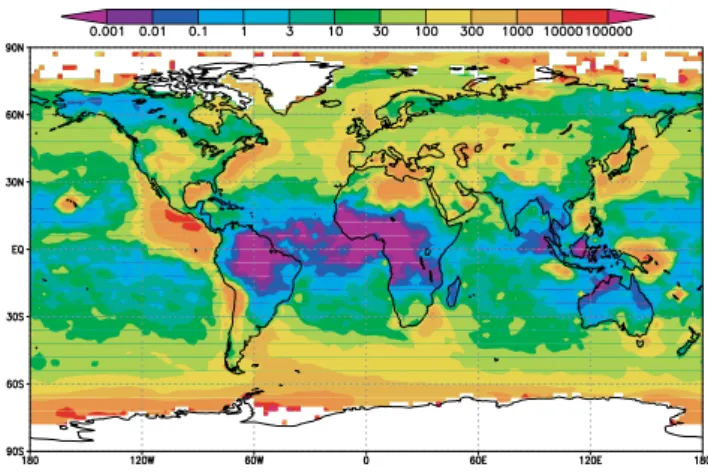
Observed particle formation rates (cm s )-3 -1 N (# of observed events) Predicted nucleation rates (10 cm day ) 4 -3 -1 Longitude Latitude
Fig. 2. Simulated global distribution of annual mean nucleation rates averaged within the boundary layer (0–930 m) (refer to the color
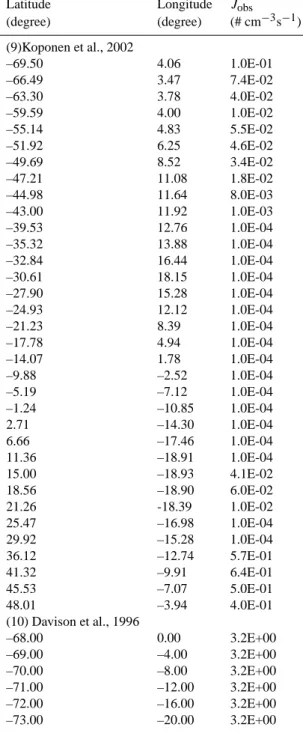
bar on the right). Corresponding measured particle formation rates from ship observations are shown as color-filled circles (refer to the lower color bar, which gives the average local nucleation rate, typically over a window of several hours). Measurements over land are indicated by unfilled circles, where circle size defines the number of nucleation events reported (refer to the scale at the bottom of the figure), while color gives the average nucleation rate over the event ensemble. Land-based nucleation data prior to 2004 are taken from Kulmala et al. (2004); after 2004, publications listed in Table 1 are used. Ship-based nucleation rates are derived from the recorded time-series of ultrafine particle concentrations at sizes between ∼3 nm and ∼12 nm (Appendix Table A1). Assuming that typical nucleation events last for 3 hours, an observed nucleation rate of 1 particle cm−3s−1is equivalent to roughly 104particles cm−3day−1; this equivalence has been used to cross-calibrate the color bars in the figure.
Most of the land-based measurements were taken in West-ern Europe and North America. Ship data, which span the major ocean basins, show negligible particle formation over tropical seas (∼30◦S–30◦N). It should be noted that the model results represent annual mean nucleation rates (aver-aged over periods that may or may not include nucleation events) for each 2◦×2.5◦ grid cell, while the observations represent average “apparent” particle formation rates based on measured particle concentrations (mostly of sizes ∼3 nm or larger) detected during nucleation events at specific loca-tions. The fraction of freshly nucleated particles (∼1.5 nm) that can grow to measurable size depends on the local growth rate and coagulation lifetime. While the comparison be-tween simulations and observations shown in Fig. 2 is quali-tative and limited, it is the first of the kind and Fig. 2 shows that, overall, the predicted spatial pattern of aerosol forma-tion agrees quite well with measurements. The comparison
also reveals regions with high predicted nucleation rates in middle-western United States, Canada, Middle East, Eastern Europe, Greenland, Asia, Chile, and Antarctica where nu-cleation measurements are sparse. Measurements in these regions would therefore be useful for improving our under-standing of particle nucleation in the global atmosphere. It should be pointed out that nucleation events do not occur ev-ery day of the year. At some sites where long-term nucleation measurements are available (N >100 in Fig. 2), nucleation events typically occur on about one third of the days (i.e., nucleation frequency=1/3). Considering the qualitative na-ture of the comparison, and the fact that some observations do not persist long enough to derive meaningful nucleation frequency, the observed values in Fig. 2 are not weighted by the nucleation frequency. Multiplying the average observed particle formation rates by nucleation frequency would re-duce the equivalent observed values by a factor of around 3,
Table 2. Steady state ion-mediated nucleation rates (cm−3s−1) at critical size (J
crit)and 3 nm (J3 nm)under a number of different combina-tions of sulfuric acid concentration ([H2SO4], read 1E7 as 107cm−3), surface area of preexisting particles (S0, µm2cm−3), and ionization rate (Q, ion-pairs cm−3s−1). D
critis the diameter (in nm) of critical clusters. T =280 K, RH=50%, Condensation of organics is not consid-ered.
S0 [H2SO4] Q Dcrit Jcrit J3 nm J3 nm/Jcrit J3 nm/(2*Q)
50 5E6 5 1.6 0.22 0.032 15% 0.3% 51 1E7 5 1.45 1.82 0.68 37% 6.8% 64 5E7 5 1.37 5.64 3.47 62% 34.7% 100 1E8 5 1.35 5.95 4.05 68% 40.5% 224 5E7 5 1.37 4.1 1.63 40% 16.3% 260 1E8 5 1.35 5.06 2.87 57% 28.7% 606 1E8 5 1.35 3.1 1.05 34% 10.5% 742 2E8 5 1.34 4.3 1.96 46% 19.6% 260 1E8 20 1.35 17.2 9.0 52% 22.5% 606 1E8 20 1.35 11.4 3.7 32% 9.3% 742 2E8 20 1.34 15.5 6.6 43% 16.5% 224 5E7 50 1.37 27.4 10.1 37% 10.1% 260 1E8 50 1.35 36.5 18.2 50% 18.2% 0.01 0.1 0.25 0.5 0.75 1 1.5 2 3 5 7.5 10 -3 -1 0.2 0.3 0.4 0.5 0.6 0.7 0.8 0.9 1.0 S igm a 90S 60S 30S EQ 30N 60N 90N Latitude 250 500 1000 2000 4000 8000 (a) Simulated annual mean zonal-averaged nucleation rates
(10 cm day ) -3
(b) Observed zonal-averaged ultrafine particle concentrations (cm ) 4
_
_
_
_
_
_
_
_
_
1.0 0.9 0.8 0.7 0.6 0.5 0.4 0.3 0.2 | | | | | | | 90N 90S 60S 30S EQ 30N 60N Sigma LatitudeFig. 3. (a) Meridional structure of predicted annual-mean zonally-averaged nucleation rates calculated using GEOS-Chem coupled to an
ion-mediated nucleation sub-model. (b) Zonally-averaged latitudinal and vertical distributions of total ultrafine condensation nuclei (UCN) concentrations measured in situ (Sect. 3.3). In panel 3b, to avoid overlap owing to the large number of data points, the pressure-latitude cross section is divided into a 5 mb×0.5◦grid, wherein all data, at all longitudes, are averaged. The average value for each grid point is represented as a color-coded circle. The observed UCN concentrations have also been normalized to standard conditions (1 atm, 298 K).
but would not change the conclusions of the paper. The IMN rate is limited by the local ionization rate, roughly ∼10 ion-pairs cm−3s−1in the continental surface layer, and ∼2
ion-pairs cm−3s−1in the surface layer over oceans (and snow or
ice). The fraction of ions that are lost before inducing nu-cleation, and the fraction of nucleated particles that are
scav-enged before growing to sizes >3 nm, depend on precursor vapor concentration (growth rate), the surface area density (S0)of pre-existing particles, and other factors including T
and RH. It should be noted that, while S0in polluted regions
is quite large, the concentration of precursor gases can be very high as well. For example, the measured [H2SO4] can
reach as high as 2×108cm−3in Atlanta, Georgia (McMurry
et al., 2005) and 8.8×107cm−3in anthropogenic plumes
ad-vecting from Asia (Weber et al., 2003).
Table 2 gives the steady state ion-mediated nucleation rates at the critical size (Jcrit)and at 3 nm (J3 nm, i.e., the
“apparent” formation rates as observed) under a number of different combinations of sulfuric acid concentration and surface area of preexisting particles. The percentage of nucleated particles (with sizes of Dcrit) growing to 3 nm
(J3 nm/Jcrit)and the fraction of ionization “leading” to the
formation of 3 nm particles (J3 nm/(2*Q)) are also given. The
results were based on the simulations using a size-resolved kinetic IMN model that takes into account the scavenging of ions and nucleated particles by pre-existing larger particles and oppositely-charged ions/particles (Yu, 2006a). It is clear from Table 2 that a significant fraction of ions can lead to nucleation and a large fraction of the nucleated particles can grow into observable size range of >3 nm, even in the pol-luted regions. It should be noted that the possible contribu-tion of certain organics to the growth of nucleated particles is not considered in the results shown in Table 2. The enhanced growth rates as a result of organic condensation will increase the fraction of nucleated particles growing into observable range.
Most observed particle production rates (Kulmala et al., 2004, also see Table 1) fall below the background ionization-rate limit (∼20 ions cm−3s−1over continental sites). An
ob-vious exception is the extremely high rate of particle forma-tion (well above 1000 cm−3s−1 and up to ∼105cm−3s−1)
observed in the clean marine coastal environment at Mace Head (O’Dowd et al., 1998). It seems that these anoma-lously high nucleation rates are linked to the occurrence of low tides and may be associated with homogeneous nucle-ation of iodine species (O’Dowd et al., 2002). Some mea-surements also yield particle formation rates that exceed the assumed IMN ionization limit. In this case, possible expla-nations include:
1. Homogeneous nucleation mechanisms that involve other species, which remain to be identified.
2. Nucleation in exhaust streams that are not fully diluted prior to sampling, where binary homogeneous nucle-ation can lead to very high levels of nanoparticles (Du and Yu, 2006).
3. Enhanced particle formation at locations where the am-bient ionization rate exceeds ∼10 ion-pairs cm3s−1.
In-deed, some measurements indicate that ionization rates near the surface can exceed 100 ion-pairs cm3s−1due to
the accumulation of radon gas in the nocturnal bound-ary layer (Dhanorkar and Kamra, 1994). Recently, Var-tiainen et al. (2007) detected exceptionally high ion pro-duction rates of up to 30 ion-pairs cm−3s−1during some
measurement periods. In urban zones, corona discharge may generate high concentrations of small ions as well.
Fig. 4. The ratio of annual mean IMN rates integrated within the
lowest 3 km of atmosphere (e.g., the source strength due to IMN, SSIMN0−3, # cm−2day−1) to the annual mean rate of emission of primary particles (e.g., source strength due to primary aerosol emis-sion, SSprimary, # cm−2day−1). The primary aerosols considered in GEOS-Chem, and their corresponding assumed (fixed) sizes (ra-dius), are: dust (4 sizes: 0.7, 1.5, 2.5, 4 µm), sea salt (3 sizes: 0.732, 5.67 µm, and an ultrafine sea salt mode with a radius of 40 nm), black carbon aerosol (39 nm), and organic carbon particles (70 nm).
Small ion concentrations of up to 104−105cm−3 have
been observed near and downwind of high voltage Transmission lines (Carter and Johnson, 1988; Suda and Sunaga, 1990; Grabarczyk and Berlinski, 2005). Higher ion production rate generally leads to enhanced nucle-ation in the lower troposphere (see Table 2).
4. The inferred high rates of particle formation based on ultrafine particle concentrations may be a result of rapid mixing of particles formed elsewhere during an un-known period of time (Stanier et al., 2004). In many nu-cleation events reported in the literature, apparent par-ticle formation rates (for example J3 nm)are calculated
based on time series of the concentrations of freshly nu-cleated particles (for example, N3−20 nm, i.e.
concentra-tion of particles in the size range of 3–20 nm). This is a valid approach when the air mass during the nucle-ation period is spatially homogeneous. In such cases, the evolution of particle number size distributions shows a well defined “banana” shape (for example, see Fig. 1 in Qian et al., 2007). However, in many observations, particles in the size range of 3–20 nm appear simultane-ously (i.e., no time delay in the appearance of the peak values of N3 nm and N10 nm), and the evolution of the
particle size distribution has the “apple” shape rather than the “banana” shape (for example, see Fig. 3b in Wu et al., 2007; Fig. 10 in Mozurkewich et al., 2004; Fig. 5 in Pet¨aj¨a et al., 2007; Fig. 7 in Iida et al., 2006). In these cases, the observed increases in N3−20 nm are
likely a result of mixing or transport of particles nucle-ated somewhere else, and the particle formation rates
derived from dN3−20 nm/dt may be significantly
over-estimated if the change of air mass is quick. In other words, transport and mixing can make 3–20
,nm particles “pop” up rapidly at a measurement site and thus mimick very fast nucleation in conditions that would support nucleation only at a much lower rate.
Figure 3a shows GOES-IMN simulated annual-mean zonally-averaged nucleation rates as a function of sigma (=pressure/surface pressure) and latitude. It is clear that while nucleation rates are generally small in the lower trop-ical atmosphere, very high nucleation rates are predicted in middle and upper tropical air layers associated with very low temperature, high ionization rate, and lower condensation sink. High nucleation rates are also obvious in the whole mid-latitude troposphere (25◦N–75◦N) in the northern hemi-sphere although the nucleation rates decrease with altitude. Nucleation appears to be negligible in most northern part of the troposphere (∼75◦N and north). In the southern hemi-sphere, nucleation in the middle troposphere over Antarc-tica is significant and nucleation zone extends to ∼60◦S. Ito (1993) reported that bimodal size distribution with a trough at around 20 nm in diameter was observed at Syowa station (69◦S, 39◦35′E) in almost all the days from August to December in 1978. Deshpande and Kamra (2004) ob-served very high concentrations (as high as 104cm−3)of
nu-cleation mode particles around 10 nm in diameter associated with subsidence of midtropospheric air at the Indian Antarc-tica station, Maitri (70◦45′S, 11◦44′E). It appears that these measurements support our simulations which indicate the ex-istence of a nucleation zone over the Antarctica. The nucle-ation zone in the lower troposphere around 30◦S is primarily a result of anthropogenic SO2 emissions (also see Fig. 1).
The strong nucleation zone in the middle to upper tropo-sphere around 30◦S appears to be mainly associated with the continuously active volcano Lascar in Chile which injects 2400 Mg of SO2per day at an altitude of around 5.6 km.
The total concentrations of particles larger than ∼3 nm have been measured at various altitudes, latitudes, and longitudes with aircraft-based ultrafine condensation nuclei (UCN) counters. While it is difficult to derive in situ parti-cle formation rates directly from these data owing to rapid changes in air mass, UCN concentrations nevertheless can be used as indicators of nucleation, since high UCN concen-trations are generally associated with large nucleation rates. Figure 3b summarizes the zonally-averaged latitudinal and vertical distributions of total UCN concentrations measured during a number of field campaigns covering a wide range of areas and seasons (see Sect. 3.3). The high UCN regions in the upper troposphere and northern mid-latitude troposphere, and lower UCN in tropical lower troposphere are consistent with corresponding high or low nucleation rates in Fig. 3a (keeping in mind that the nucleation rates in Fig. 3a repre-sent zonal and temporal averages, while the UCN concen-trations in Fig. 3b represent measurements at selected
loca-tions and times). While the comparison between Fig. 3a and Fig. 3b should be considered qualitative, it is the first attempt to compare global nucleation zones with aircraft-based UCN measurements. Figure 3 indicates that the IMN mechanism appears to capture the vertical spatial patterns in the UCN distribution for the regions where sufficient data are available to discern larger-scale patterns. High concentrations of ultra-fine particles were also observed during the upper systematic tropospheric transequatorial Africa flights (Heintzenberg et al., 2003). These data are not included in Fig. 3b but are gen-erally consistent with Fig. 3. Aircraft-based measurements at higher latitudes in both hemispheres are currently lacking to verify our model predictions.
The general agreement between simulations and observa-tions demonstrated above suggests that IMN may play an important role in generating new particles in global tropo-sphere. Figure 4 compares the annual mean IMN rates inte-grated over the lowest 3 km of atmosphere (e.g., the source strength due to IMN, SSIMN0−3, # cm−2day−1) with the
an-nual mean source of primary particles due to emissions (e.g., the source strength of primary emissions, SSprimary, # cm−2
day−1) in terms of the ratio of SS
IMN0−3 to SSprimary. The
results in Fig. 4 clearly indicate that IMN is a significant source of particles throughout the lower troposphere. At high latitudes (∼30◦N–90◦N, 30◦S–90◦S), the ratio exceeds 10 over oceans, and lies between ∼10 and ∼300 over land. In the tropics (30◦S–30◦N), SS
IMN0−3/SSprimary is generally
between 0.1 and 10, although some spots have very high ratio and some others spots have very low ratio.
In discussing the relative contribution of secondary par-ticle formation versus primary parpar-ticle emission to climate active particles, we should keep in mind that the diameters of freshly nucleated particles are just a few nanometers, while those of primary particles are generally greater than 50 nm. The fraction of nucleated particles that grow to CCN sizes depends on the local growth rates (and, hence, the precur-sor vapor concentrations), and on the concentration of pre-existing particles. Pierce and Adams (2007) found that the probability of a nucleated particle generating a CCN varies from <0.1% to >90% in different regions of the atmosphere, and falls between 5% and 40% for a large fraction of nu-cleated particles in the boundary layer. Clearly, with these statistics in mind, IMN is very likely to be a significant source of particles that impact climate. It should be noted that the ratios shown in Fig. 4 do not include the contribu-tions of new particle formation in the middle and upper tro-posphere. Some of the particles nucleated in the middle and upper troposphere will contribute to the climate effective par-ticles due to their relatively long lifetime (against scavenging by pre-existing particles), although the particle growth rates in these regions are typically small. The evolution of nu-cleated particles into CCN should be analyzed using a size-resolved aerosol microphysical model coupled to global code like GEOS-Chem.
5 Summary and discussion
The magnitude of the aerosol indirect radiative forcing is poorly constrained in climate models, and this is the dom-inant uncertainty in assessing climate change. The aerosol indirect radiative forcing is largely determined by the number abundance of particles that can act as cloud condensation nu-clei (CCN). A clear understanding of the contribution of new particle formation and growth to CCN abundance, which is essential to properly assess the influences of aerosols on cli-mate, depends on our ability to predict accurately the rates of new particle formation in large-scale models. Significant theoretical and experimental progresses have been made in last couple of years with regard to the role of ions in the for-mation of tropospheric particles.
In this study, we integrate a recently updated ion-mediated nucleation (IMN) mechanism into a global chemical trans-port model (GEOS-Chem) to investigate the significance of IMN mechanism as a global source of new particles and the spatial distribution of nucleation zone. We run the GEOS-Chem coupled with nucleation mechanism for one year from 07/01/2001 to 06/30/2002, using GEOS-3 grid with 2◦×2.5◦ horizontal resolution and 30 vertical levels. The time step for chemistry (and nucleation) is 30 min. Our simulations indi-cate that IMN can lead to significant new particle production. Horizontally, a comparison of simulated annual mean par-ticle formation rates in boundary layer with a comprehensive dataset of land- and ship- based nucleation measurements suggests that IMN mechanism may be able to account for many of the observed nucleation events. Vertically, the simu-lated high and low regions of annual-mean zonally-averaged nucleation rates appears to be consistent with high and low zones of UCN concentrations measured during a number of aircraft-based field campaigns. While the comparison be-tween simulations and observations shown in this study is qualitative and limited, it is the first of the kind and, over-all, the predicted spatial pattern of aerosol formation agrees quite well with measurements. The comparison also reveals regions with high predicted nucleation rates where nucle-ation measurements are sparse and thus identifies the regions where possible future nucleation measurements should be carried out to improve our understanding of particle nucle-ation in the global atmosphere.
Particle formation rates are sensitive to [H2SO4]. One of
major uncertainties in our simulated results is associated with the accuracy of the calculated [H2SO4]. In addition to the
un-certainty in the simulated SO2concentrations which depend
on emission, transport, and loss processes, the uncertainty in the condensation sink (CS) estimated from the simulated mass and assumed size of particles of different types also influence the accuracy of [H2SO4]. In addition, the
contribu-tion of nucleacontribu-tion mode particles to CS is not considered in current model. To resolve the issue and to study the contribu-tion of nucleacontribu-tion to CCN in different global environments,
we will include size-resolved aerosol microphysics processes in GEOS-Chem in our future study.
Similar to other nucleation schemes that have been used in the global models to predict new particle formation, the IMN mechanism is subject to uncertainty as well. First, the ther-modynamic data and physical algorithms used in the IMN model have limitation and uncertainties. Second, species other than H2SO4 and H2O (such as NH3, HNO3, and
or-ganics) may affect the properties of small clusters and the nucleation rates in the real atmosphere. These uncertainties may imply that the IMN contribution to new particle forma-tion in the troposphere could be either higher or lower than what we presented in this study. It should be noted that other nucleation mechanisms may also contribute to tropospheric new particle formation. For example, Kulmala et al. (2006) showed that observed new particle formation rates appear to be a function of sulfuric acid concentration to the power from one to two and proposed an activation theory based on the activation of the clusters containing about one sulfuric acid molecule via heterogeneous nucleation. The physics behind the activation theory remains to be further investigated. In addition to improve the nucleation mechanisms through the-oretical development, laboratory and field studies, and quan-tum calculations for small clusters, further research is also needed on the contributions of different nucleation mecha-nisms to global source of new particles. More detailed and comprehensive comparisons of model predictions with rele-vant data obtained in various field campaigns will be help-ful to assess the successhelp-fulness of various nucleation mech-anisms in explaining the observed nucleation events and to identify the areas for further improvement in the existing the-ories.
Appendix A
Table A1 gives particle formation rates over oceanic surface derived from ship-based condensation nuclei (CN, diameter
>∼12 nm) and ultrafine condensation nuclei (UCN, diameter
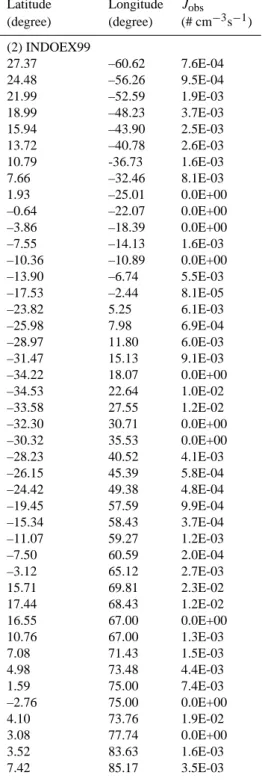
Table A1. Ship-based particle formation rates (Jobs) derived from measurements obtained during 10 ship cruise campaigns. The data in this table are plotted in Fig. 2 of the main text.
Latitude Longitude Jobs (degree) (degree) (# cm−3s−1) (1)RITS94 49.98 –128.20 1.5E-02 51.49 –131.20 4.6E-02 54.90 -139.80 1.6E-02 50.46 –140.00 1.5E-04 44.84 –140.00 0.0E+00 39.99 –140.00 0.0E+00 36.31 –140.00 2.8E-03 32.24 –140.00 5.6E-03 28.27 –140.00 3.4E-03 22.95 –140.00 6.6E-05 17.62 –140.00 0.0E+00 12.14 –140.00 7.6E-05 5.42 –140.00 4.9E-05 –0.07 –140.00 4.5E-04 –3.97 –140.00 0.0E+00 –4.95 –140.20 2.6E-04 –4.85 –140.40 9.2E-04 –4.75 –140.50 7.8E-04 -4.62 -140.90 1.1E-03 -12.93 –141.70 1.7E-03 –14.99 –145.60 0.0E+00 –19.14 –149.50 2.5E-03 –23.49 –149.10 2.0E-03 –28.24 –148.40 1.9E-03 –31.45 –145.40 1.5E-03 –35.39 –145.10 9.6E-03 –38.88 –144.80 0.0E+00 –46.02 –143.00 5.5E-02 –49.61 –141.70 0.0E+00 –55.01 –139.30 6.1E-03 –61.27 –135.60 9.0E-03 –67.28 –130.30 1.7E-02 –67.02 –122.90 4.7E-03 –69.00 –113.00 1.0E-02 –68.56 –104.90 0.0E+00 –68.95 –94.26 5.0E-04 –67.27 –79.36 8.1E-03 –66.81 –72.76 0.0E+00 –64.78 –64.08 4.7E-03 –64.71 –63.10 2.9E-02 –58.01 –63.88 3.9E-02 –53.34 –67.03 2.4E-01
Table A1. Continued.
Latitude Longitude Jobs (degree) (degree) (# cm−3s−1) (2) INDOEX99 27.37 –60.62 7.6E-04 24.48 –56.26 9.5E-04 21.99 –52.59 1.9E-03 18.99 –48.23 3.7E-03 15.94 –43.90 2.5E-03 13.72 –40.78 2.6E-03 10.79 -36.73 1.6E-03 7.66 –32.46 8.1E-03 1.93 –25.01 0.0E+00 –0.64 –22.07 0.0E+00 –3.86 –18.39 0.0E+00 –7.55 –14.13 1.6E-03 –10.36 –10.89 0.0E+00 –13.90 –6.74 5.5E-03 –17.53 –2.44 8.1E-05 –23.82 5.25 6.1E-03 –25.98 7.98 6.9E-04 –28.97 11.80 6.0E-03 –31.47 15.13 9.1E-03 –34.22 18.07 0.0E+00 –34.53 22.64 1.0E-02 –33.58 27.55 1.2E-02 –32.30 30.71 0.0E+00 –30.32 35.53 0.0E+00 –28.23 40.52 4.1E-03 –26.15 45.39 5.8E-04 –24.42 49.38 4.8E-04 –19.45 57.59 9.9E-04 –15.34 58.43 3.7E-04 –11.07 59.27 1.2E-03 –7.50 60.59 2.0E-04 –3.12 65.12 2.7E-03 15.71 69.81 2.3E-02 17.44 68.43 1.2E-02 16.55 67.00 0.0E+00 10.76 67.00 1.3E-03 7.08 71.43 1.5E-03 4.98 73.48 4.4E-03 1.59 75.00 7.4E-03 –2.76 75.00 0.0E+00 4.10 73.76 1.9E-02 3.08 77.74 0.0E+00 3.52 83.63 1.6E-03 7.42 85.17 3.5E-03
Table A1. Continued.
Latitude Longitude Jobs (degree) (degree) (# cm−3s−1) (3) ACE-ASIA 34.03 -174.90 2.7E-03 31.76 178.00 3.1E-03 31.33 173.50 2.0E-04 32.39 168.10 4.5E-03 32.95 165.30 4.3E-03 34.20 162.80 0.0E+00 33.00 158.10 0.0E+00 32.74 155.20 1.6E-03 33.00 143.90 1.0E-01 33.01 141.50 0.0E+00 33.20 139.90 8.3E-02 32.82 136.70 2.2E-02 31.96 133.50 2.9E-02 30.72 131.50 1.4E-01 31.70 127.70 5.5E-02 33.45 128.60 6.2E-02 35.47 131.80 0.0E+00 38.06 133.60 3.8E-02 38.97 134.50 1.7E-02 37.92 131.00 5.8E-03 37.53 130.00 0.0E+00 35.01 130.00 1.9E+00 35.74 132.50 2.8E+00 33.84 129.50 0.0E+00 32.52 128.40 3.0E-01 31.36 126.40 2.6E-02 33.01 128.00 8.1E-02 31.22 131.40 1.9E-01 33.13 135.40 6.3E-01
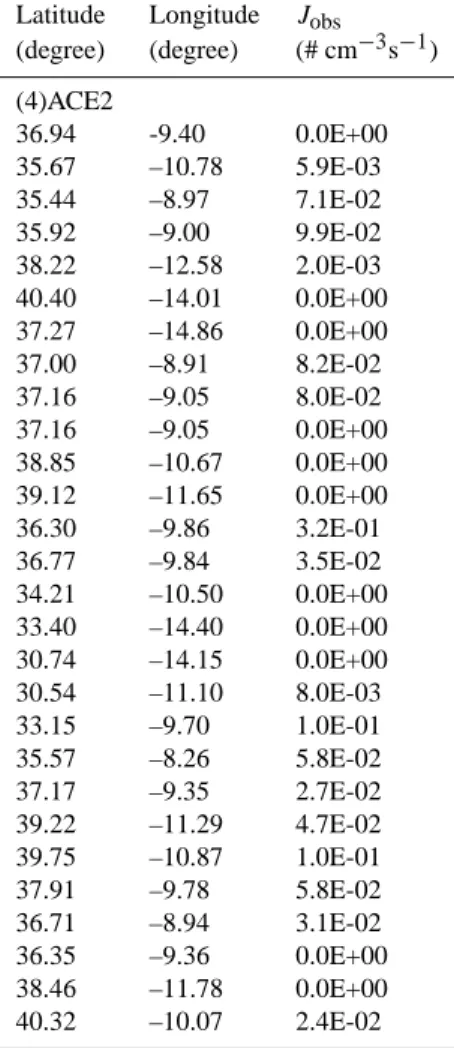
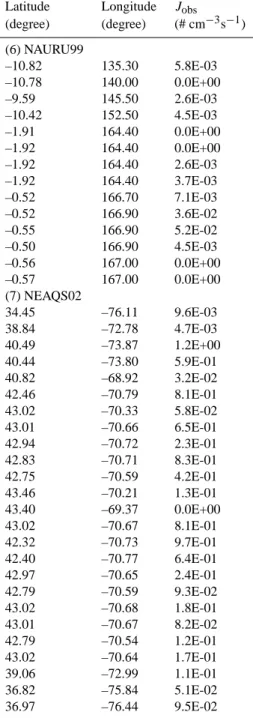
Table A1. Continued.
Latitude Longitude Jobs (degree) (degree) (# cm−3s−1) (4)ACE2 36.94 -9.40 0.0E+00 35.67 –10.78 5.9E-03 35.44 –8.97 7.1E-02 35.92 –9.00 9.9E-02 38.22 –12.58 2.0E-03 40.40 –14.01 0.0E+00 37.27 –14.86 0.0E+00 37.00 –8.91 8.2E-02 37.16 –9.05 8.0E-02 37.16 –9.05 0.0E+00 38.85 –10.67 0.0E+00 39.12 –11.65 0.0E+00 36.30 –9.86 3.2E-01 36.77 –9.84 3.5E-02 34.21 –10.50 0.0E+00 33.40 –14.40 0.0E+00 30.74 –14.15 0.0E+00 30.54 –11.10 8.0E-03 33.15 –9.70 1.0E-01 35.57 –8.26 5.8E-02 37.17 –9.35 2.7E-02 39.22 –11.29 4.7E-02 39.75 –10.87 1.0E-01 37.91 –9.78 5.8E-02 36.71 –8.94 3.1E-02 36.35 –9.36 0.0E+00 38.46 –11.78 0.0E+00 40.32 –10.07 2.4E-02
Table A1. Continued.
Latitude Longitude Jobs (degree) (degree) (# cm−3s−1) (5) ACE1 40.44 –135.70 0.0E+00 36.17 –141.00 5.2E-03 31.99 –145.80 0.0E+00 27.85 –150.40 0.0E+00 23.80 –154.80 3.8E-04 19.19 –157.00 5.0E-02 19.12 –159.10 0.0E+00 12.34 –160.00 1.0E-03 7.39 –160.00 3.1E-03 2.49 –160.00 1.2E-04 –3.68 –160.00 7.1E-04 –8.34 –160.00 3.1E-04 –14.14 –160.00 1.0E-03 –20.51 –160.00 5.4E-02 –25.33 –160.00 1.2E-03 –30.76 –161.60 2.2E-02 –32.11 –164.30 7.7E-04 –34.58 –169.50 0.0E+00 –37.61 –176.60 1.1E-02 –35.53 178.80 0.0E+00 –35.15 177.10 1.5E-01 –34.40 172.10 0.0E+00 –42.04 150.80 3.0E-02 –50.29 155.90 9.8E-03 –47.75 145.40 0.0E+00 –49.99 138.30 0.0E+00 –42.88 140.80 5.7E-02 –41.08 143.30 2.6E-02 –40.81 144.20 2.5E-01 –44.28 141.10 0.0E+00 –45.14 141.20 0.0E+00 –47.47 147.00 8.7E-03 –44.96 144.90 2.1E-02
Table A1. Continued.
Latitude Longitude Jobs (degree) (degree) (# cm−3s−1) (6) NAURU99 –10.82 135.30 5.8E-03 –10.78 140.00 0.0E+00 –9.59 145.50 2.6E-03 –10.42 152.50 4.5E-03 –1.91 164.40 0.0E+00 –1.92 164.40 0.0E+00 –1.92 164.40 2.6E-03 –1.92 164.40 3.7E-03 –0.52 166.70 7.1E-03 –0.52 166.90 3.6E-02 –0.55 166.90 5.2E-02 –0.50 166.90 4.5E-03 –0.56 167.00 0.0E+00 –0.57 167.00 0.0E+00 (7) NEAQS02 34.45 –76.11 9.6E-03 38.84 –72.78 4.7E-03 40.49 –73.87 1.2E+00 40.44 –73.80 5.9E-01 40.82 –68.92 3.2E-02 42.46 –70.79 8.1E-01 43.02 –70.33 5.8E-02 43.01 –70.66 6.5E-01 42.94 –70.72 2.3E-01 42.83 –70.71 8.3E-01 42.75 –70.59 4.2E-01 43.46 –70.21 1.3E-01 43.40 –69.37 0.0E+00 43.02 –70.67 8.1E-01 42.32 –70.73 9.7E-01 42.40 –70.77 6.4E-01 42.97 –70.65 2.4E-01 42.79 –70.59 9.3E-02 43.02 –70.68 1.8E-01 43.01 –70.67 8.2E-02 42.79 –70.54 1.2E-01 43.02 –70.64 1.7E-01 39.06 –72.99 1.1E-01 36.82 –75.84 5.1E-02 36.97 –76.44 9.5E-02
Table A1. Continued.
Latitude Longitude Jobs (degree) (degree) (# cm−3s−1) (8) NEAQS04 42.42 –70.65 2.0E+00 42.51 –70.56 2.3E-01 43.72 –66.20 2.9E-01 43.00 –66.80 7.6E-02 42.46 –70.35 4.6E-01 42.36 –71.03 3.7E+00 42.78 –70.71 2.3E+00 42.41 –70.74 2.0E-01 42.38 –70.86 4.0E-01 42.74 –70.70 7.1E-01 42.74 –70.73 6.2E-01 43.17 –69.26 1.5E-01 44.32 –67.10 2.5E-02 44.00 –66.59 1.2E-01 43.16 –70.47 1.3E-01 42.45 –70.82 6.6E-01 42.80 –70.51 1.4E-02 42.80 –70.63 5.9E-02 42.97 –70.51 0.0E+00 42.67 –69.77 3.8E-01 42.82 –70.74 7.7E-02 43.32 –70.17 2.8E-01 43.09 –70.44 3.9E-01 43.52 –70.07 9.9E-01 43.65 –69.90 2.3E-01 44.39 –67.62 4.7E-01 43.64 –69.41 4.2E-01 43.62 –70.12 1.4E-01 42.55 –68.38 2.3E-02 42.43 –70.50 4.6E+00 42.37 –71.05 1.6E+00 42.63 –69.61 0.0E+00 42.87 –70.77 4.4E-01
Table A1. Continued.
Latitude Longitude Jobs
(degree) (degree) (# cm−3s−1) (9)Koponen et al., 2002 –69.50 4.06 1.0E-01 –66.49 3.47 7.4E-02 –63.30 3.78 4.0E-02 –59.59 4.00 1.0E-02 –55.14 4.83 5.5E-02 –51.92 6.25 4.6E-02 –49.69 8.52 3.4E-02 –47.21 11.08 1.8E-02 –44.98 11.64 8.0E-03 –43.00 11.92 1.0E-03 –39.53 12.76 1.0E-04 –35.32 13.88 1.0E-04 –32.84 16.44 1.0E-04 –30.61 18.15 1.0E-04 –27.90 15.28 1.0E-04 –24.93 12.12 1.0E-04 –21.23 8.39 1.0E-04 –17.78 4.94 1.0E-04 –14.07 1.78 1.0E-04 –9.88 –2.52 1.0E-04 –5.19 –7.12 1.0E-04 –1.24 –10.85 1.0E-04 2.71 –14.30 1.0E-04 6.66 –17.46 1.0E-04 11.36 –18.91 1.0E-04 15.00 –18.93 4.1E-02 18.56 –18.90 6.0E-02 21.26 -18.39 1.0E-02 25.47 –16.98 1.0E-04 29.92 –15.28 1.0E-04 36.12 –12.74 5.7E-01 41.32 –9.91 6.4E-01 45.53 –7.07 5.0E-01 48.01 –3.94 4.0E-01 (10) Davison et al., 1996 –68.00 0.00 3.2E+00 –69.00 –4.00 3.2E+00 –70.00 –8.00 3.2E+00 –71.00 –12.00 3.2E+00 –72.00 –16.00 3.2E+00 –73.00 –20.00 3.2E+00
Acknowledgements. This study is supported by the NOAA/DOC under grant NA05OAR4310103, NSF under grant 0618124, and NASA under grant NNX08AK48G. Z. Wang acknowledges the support of the CAS International Partnership Program for Creative Research Teams, National 973 Project (2005CB422205) and NSFC (40533017). The GEOS-Chem model is managed by the Atmo-spheric Chemistry Modeling Group at Harvard University with support from the NASA Atmospheric Chemistry Modeling and Analysis Program. We thank V. N. Kapustin and A. D. Clark for providing the aircraft-based UCN data. TRACE-P and INTEX-A data are from NASA Global Tropospheric Experiment (GTE) database website. The original ship-based data were obtained from NOAA PMEL Atmospheric Chemistry Data Server.
Edited by: M. Kulmala
References
Albrecht, B. A.: Aerosols, cloud microphysics and fractional cloudiness, Sciences, 245, 1227–1230, 1989.
Alexander, B., Park, R. J., Jacob, D. J., Li, Q. B., Yan-tosca, R. M., Savarino, J., C. C. W. Lee, C. C. W., and Thiemens, M. H.: Sulfate formation in sea-salt aerosols: Con-straints from oxygen isotopes, J. Geophys. Res., 110, D10307, doi:10.1029/2004JD005659, 2005.
Andreae, M. O. and Merlet, P.: Emission of trace gases and aerosols from biomass burning, Global Biogeochem. Cycles, 15(4), 955– 966, 2001.
Andres, R. J. and Kasgnoc, A. D.: A time-averaged inventory of subaerial volcanic sulfur emissions, J. Geophys. Res., 103(D19), 25 251–25 262, doi:10.1029/98JD02091, 1998.
Benkovitz, C. M., Scholtz, M. T., Pacyna, J., Tarrason, L., Dignon, J., Voldner, E. C., Spiro, P. A., Logan, J. A., and Graedel, T. E.: Global gridded inventories of anthropogenic emissions of sulfur and nitrogen, J. Geophys. Res., 101(D22), 29,239–29,253, 1996. Bey, I., Jacob, D. J., Yantosca, R. M., Logan, J. A., Field, B., Fiore, A. M., Li, Q., Liu, H., Mickley, L. J., and Schultz, M.: Global modeling of tropospheric chemistry with assimilated me-teorology: Model description and evaluation, J. Geophys. Res., 106(D19), 23 073–23 096, 2001.
Birmili, W., Berresheim, H., Plass-D¨ulmer, C., Elste, T., Gilge, S., Wiedensohler, A., and Uhrner, U.: The Hohenpeissenberg aerosol formation experiment (HAFEX): a long-term study in-cluding size-resolved aerosol, H2SO4, OH, and monoterpenes measurements, Atm. Chem. Phys., 3, 361–376, 2003.
Carter, P. J. and Johnson, G. B.: Space charge measurements down-wind from a monopolar 500 kV HVDC test line, IEEE Transac-tions on Power Delivery, 3(4), 2056–2063, 1988.
Charlson, R. J., Schwartz, S. E., Hales, J. M., Cess, R. D., Coakley Jr., J. A., Hansen, J. E., and Hofmann, D. J.: Climate forcing by anthropogenic aerosols, Science, 255, 423–430, 1992.
Chin, M., Rood, R. B., Lin, S.-J., Mu¨uller, J.-F., and Thompson, A. M.: Atmospheric sulfur cycle simulated in the global model GOCART: Model description and global properties, J. Geophys. Res., 105(D20), 24 671–24 687, 2000.
Clarke, A. D. and Kapustin, V. N.: A pacific aerosol survey, Part 1: A decade of data on particle production, transport, evolution, and mixing in the troposphere, J. Atmos. Sci., 59, 363–382, 2002.
Davison, B., Nicholas Hewitt, C., O’Dowd, C. D., Lowe, J. A., Smith, M. H., Schwikowski, M., Baltensperger, U., and Harri-son, R. M.: Dimethyl sulfide, methane sulfonic acid and physico-chemical aerosol properties in Atlantic air from the United King-dom to Halley Bay, J. Geophys. Res., 101(D17), 22 855–22 868, 1996.
Deshpande, C. G. and Kamra, A. K.: Physical properties of aerosols at Maitri, Antarctica, Proc. Indian Acad. Sci. (Earth Planet. Sci.), 113, 1–25, 2004.
Dhanorkar, S. and Kamra, A. K.: Diurnal variation of ionization rate close to ground, J. Geophys. Res., 99(D9), 18 523–18 526, doi:10.1029/94JD01335, 1994.
Du, H. and Yu, F.: Formation of volatile nanoparticles in engine exhaust: Contributions of the binary H2SO4-H2O homogeneous nucleation, Atmos. Environ., 40, 7579–7588, 2006.
Duncan, B. N., Martin, R. V., Staudt, A. C., Yevich, R., and Logan, J. A.: Interannual and seasonal variability of biomass burning emissions constrained by satellite observations, J. Geophys. Res., 108(D2), 4100, doi:10.1029/2002JD002378, 2003.
Dunn M. J., Jim´enez, J.-L., Baumgardner, D., Castro, T., Mc-Murry, P. H., Smith, J. N.: Measurements of Mexico City nanoparticle size distributions: Observations of new parti-cle formation and growth, Geophys. Res. Lett., 31, L10102, doi:10.1029/2004GL019483, 2004.
Evans, M. J. and Jacob, D. J.: Impact of new laboratory studies of N2O5hydrolysis on global model budgets of tropospheric nitro-gen oxides, ozone, and OH, Geophys. Res. Lett., 32, L09813, doi:10.1029/2005GL022469, 2005.
Fairlie, T. D., Jacob, D. J., and Park, R.: A simulation of the transpa-cific transport of mineral dust from Asia during spring 2001: Evaluation of results from GEOS-CHEM with ground-based, air-craft and satellite measurements, Eos Trans. AGU, 85(17), Jt. Assem. Suppl., Abstract A31B-07, 2004.
Fan J., Zhang, R., Collins, D., Li, G.: Contribution of sec-ondary condensable organics to new particle formation: A case study in Houston, Texas, Geophys. Res. Lett., 33, L15802, doi:10.1029/2006GL026295, 2006.
Ghan, S. J. and Schwartz, S. E.: Aerosol properties and processes: A path from field and laboratory measurements to global climate models, Bull. Amer. Meteorol. Soc., 88, 1059–1083, 2007. Gong, Y., Hang, S., Fang, C., et al.: Analysis on concentration and
source rate of precursor vapors participating in particle formation and growth at Xinken in Pearl River Delta of China, Advances in Atmospheric Sciences, 25(3), 427–436, 2008.
Grabarczyk, Z. J. and Berlinski, J.: Charging of atmosphere aerosols by AC HV power lines, J. Electrostatics, 63, 755–759, 2005.
Hamed, A., Joutsensaari, J., Mikkonen, S., et al.: Nucleation and growth of new particles in Po Valley, Itally, Atmos. Chem. Phys. Discuss., 6, 9603–9653, 2006,
http://www.atmos-chem-phys-discuss.net/6/9603/2006/. Hanson, D. R. and Lovejoy, E. R.: Measurement of the
thermo-dynamics of the hydrated dimmer and trimer of sulfuric acid, J. Phys. Chem. A., 110, 9525–9528, doi:10.1021/jp062844w, 2006. Heintzenberg, J., Hermann, M., and Theiss, D.: Out of Africa: High aerosol concentrations in the upper troposphere over Africa, At-mos. Chem. Phys., 3(4), 1191–1198, 2003.
Hirsikko, A., Bergman, T., Laakso, L., Dal Maso, M., Riipinen, I., H˜orrak, U. and Kulmala, M.: Identification and classification
![Fig. 1. Horizontal (a, c, e: average over first seven model layers above Earth’s surface) and vertical (b, d, f: sigma=pressure/surface pressure) distributions of annual mean values of SO 2 mixing ratio, condensation sink (CS), and [H 2 SO 4 ]](https://thumb-eu.123doks.com/thumbv2/123doknet/14617283.546567/7.892.96.804.121.936/horizontal-average-surface-vertical-pressure-pressure-distributions-condensation.webp)
![Table 2. Steady state ion-mediated nucleation rates (cm −3 s −1 ) at critical size (J crit ) and 3 nm (J 3 nm ) under a number of different combina- combina-tions of sulfuric acid concentration ([H 2 SO 4 ], read 1E7 as 10 7 cm −3 ), surface area of preexi](https://thumb-eu.123doks.com/thumbv2/123doknet/14617283.546567/9.892.231.662.180.464/steady-mediated-nucleation-critical-different-combina-sulfuric-concentration.webp)