HAL Id: hal-01257943
https://hal.sorbonne-universite.fr/hal-01257943
Submitted on 18 Jan 2016
HAL is a multi-disciplinary open access
archive for the deposit and dissemination of
sci-entific research documents, whether they are
pub-lished or not. The documents may come from
teaching and research institutions in France or
abroad, or from public or private research centers.
L’archive ouverte pluridisciplinaire HAL, est
destinée au dépôt et à la diffusion de documents
scientifiques de niveau recherche, publiés ou non,
émanant des établissements d’enseignement et de
recherche français ou étrangers, des laboratoires
publics ou privés.
Distributed under a Creative Commons Attribution| 4.0 International License
Advanced MRI Techniques
I Thomassin-Naggara, D Balvay, A Rockall, M.F. Carette, M Ballester, E
Darai, M Bazot
To cite this version:
I Thomassin-Naggara, D Balvay, A Rockall, M.F. Carette, M Ballester, et al.. Added Value of
As-sessing Adnexal Masses with Advanced MRI Techniques. BioMed Research International , Hindawi
Publishing Corporation, 2015, pp.785206. �10.1155/2015/785206�. �hal-01257943�
Advanced MRI Techniques
I. Thomassin-Naggara,
1,2,3D. Balvay,
1A. Rockall,
4M. F. Carette,
2,3M. Ballester,
3,5E. Darai,
3,5and M. Bazot
2,31INSERM, UMR970, Team 2, Angiogenesis Imaging, 75005 Paris, France
2AP-HP, Hˆopital Tenon, Department of Radiology, 58 avenue Gambetta, 75020 Paris, France 3Sorbonne University, UPMC Univ Paris 06, IUC, 75005 Paris, France
4Imperial College London, ICTEM Building, Room 136, 1st Floor, Du Cane Road, London W12 0NN, UK 5AP-HP, Hˆopital Tenon, Department of Gynaecology and Obstetrics, 4 rue de la Chine, 75020 Paris, France
Correspondence should be addressed to I. Thomassin-Naggara; [email protected] Received 10 August 2014; Revised 23 November 2014; Accepted 7 December 2014
Academic Editor: Zhengchao Dong
Copyright © 2015 I. Thomassin-Naggara et al. This is an open access article distributed under the Creative Commons Attribution License, which permits unrestricted use, distribution, and reproduction in any medium, provided the original work is properly cited.
This review will present the added value of perfusion and diffusion MR sequences to characterize adnexal masses. These two functional MR techniques are readily available in routine clinical practice. We will describe the acquisition parameters and a method of analysis to optimize their added value compared with conventional images. We will then propose a model of interpretation that combines the anatomical and morphological information from conventional MRI sequences with the functional information provided by perfusion and diffusion weighted sequences.
1. Introduction
The clinical suspicion of an adnexal mass is one of the most frequent indications for gynecologic imaging. In this setting, the first imaging technique is ultrasonography with Doppler [1–6]. A large majority of women will not need any other imaging technique for characterization of the adnexal lesion because the lesion either has typically benign features (such as anechoic cyst) or is overtly malignant (such as the presence of peritoneal implants) [7]. In the latter case, the extent of disease will then be determined with computed tomography (CT) which is the current standard of care for preoperative staging.
However, when an echoic area is discovered at ultrasound, the question remains whether or not this represents a solid soft tissue component consistent with tumour. If the sono-grapher detects blood flow within the echoic area, a solid component surely exists but many benign lesions may display a solid component [8]. If no blood flow is detected in the echoic portion, the question remains without answer as solid
tissue may not display any blood flow on ultrasound [9]. Thus, when no typical signs of benignity or malignancy are present, the lesion remains indeterminate and a second line technique is needed with a frequency that depends on sonographer’s experience [10,11].
Pelvic magnetic resonance (MR) imaging has clearly been demonstrated to be the best imaging technique to characterize indeterminate or complex adnexal masses due to its excellent tissue contrast [12,13]. Firstly, the conventional sequences (T2, T1, and T1 with fat saturation) are evalu-ated. MR imaging is very accurate for the identification of endometriotic or fatty masses using these sequences whereas sonography can only suggest these diagnoses in some cases [14,15]. Moreover, conventional MR imaging readily distin-guishes cystic from solid soft tissue components, as solid soft tissue enhances after gadolinium injection [16, 17]. Malignancy can only be suggested if there are enhancing solid components, such as thickened irregular septa, solid papillary projections, or a solid mass. These enhancing solid compo-nents are grouped under the name of “solid tissue” [18,19].
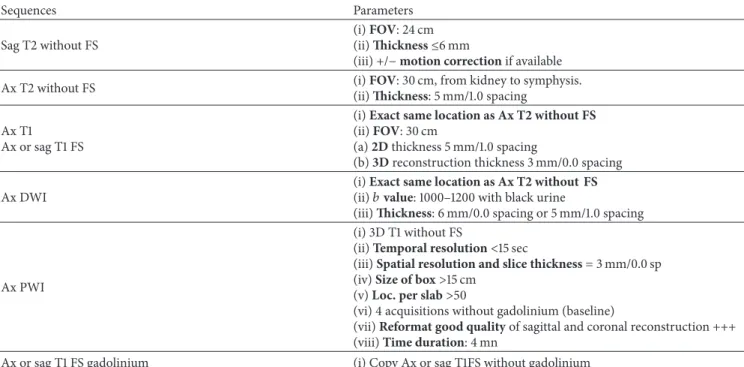
Table 1: Acquisition parameters.
Sequences Parameters
Sag T2 without FS
(i) FOV: 24 cm (ii) Thickness≤6 mm
(iii) +/− motion correction if available
Ax T2 without FS (i) FOV: 30 cm, from kidney to symphysis.
(ii) Thickness: 5 mm/1.0 spacing Ax T1
Ax or sag T1 FS
(i) Exact same location as Ax T2 without FS (ii) FOV: 30 cm
(a) 2D thickness 5 mm/1.0 spacing
(b) 3D reconstruction thickness 3 mm/0.0 spacing Ax DWI
(i) Exact same location as Ax T2 without FS (ii)𝑏 value: 1000–1200 with black urine
(iii) Thickness: 6 mm/0.0 spacing or 5 mm/1.0 spacing
Ax PWI
(i) 3D T1 without FS
(ii) Temporal resolution<15 sec
(iii) Spatial resolution and slice thickness = 3 mm/0.0 sp (iv) Size of box>15 cm
(v) Loc. per slab>50
(vi) 4 acquisitions without gadolinium (baseline)
(vii) Reformat good quality of sagittal and coronal reconstruction +++ (viii) Time duration: 4 mn
Ax or sag T1 FS gadolinium (i) Copy Ax or sag T1FS without gadolinium
Others types of solid component such as thin smooth septa or cyst wall are not considered as solid tissue and do not require any functional characterization. If solid tissue is detected within an adnexal lesion, early publications demonstrated that the T2 signal intensity of the solid tissue is useful to distinguish benign from malignant tumors [12] because some benign tumors contain fibrous material in their solid tissue and thus appear with a typically low T2 weighted signal. The accuracy of MRI interpretation to differentiate benign from malignant masses using only the conventional sequences is about 80% according to the published literature [17,20–22]. However, Huchon et al. demonstrated that most ovarian tumors undergo surgery without any MR analysis and there is a high rate of incomplete surgery [23]. More recently, perfusion and diffusion weighted sequences were demonstrated to improve diagnostic confidence about 25% and 15%, respectively [24], allowing an accuracy of up to 94.6%. This increase in the diagnostic accuracy of MRI may help to increase the clinician’s confidence in MR imaging.
This review will present these two functional techniques that are readily available in clinical routine, including acqui-sition parameters, method of analysis, and added value compared with conventional images. Then, we will propose a synthesis consisting of an interpretation model combining conventional and functional criteria.
2. Perfusion Weighted MR Sequence
Ovarian cancer is characterized by an anarchic neovascular-ization resulting in a wide number of immature microvessels. These vessels are characterized by a lack of coverage by pericytes and the higher expression of one of the receptors of
Vascular Endothelial Growth Factor (VEGF) named VEGFR-2 on both endothelial and epithelial cells of ovarian cys-tadenocarcinomas. These physiopathogenic characteristics have been demonstrated to be in line with variations of MR perfusion parameters [25].
2.1. Technical Features. All the parameters required to
per-form MRI for adnexal masses characterization are provided in Table1.
2.2. MR Acquisition Parameters. For female pelvic imaging,
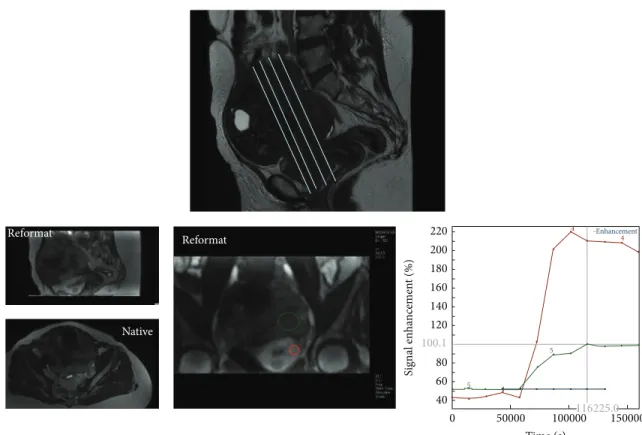
perfusion MR technique is based on a Dynamic Con-trast Enhanced (DCE) Gradient Echo (GRE) T1 weighted sequence. The main important parameters include a temporal resolution which must be lower than 15 seconds and the total sequence duration should be at least 3 minutes. External myometrium is used as an internal reference because it is enhanced to approximately the same extent as ovarian tumour tissue [26]. Ideally, an axial 3D GRE T1 sequence should be performed with high quality reformats postcon-trast in the sagittal and coronal planes. If only a 2D sequence can be performed, the acquisition plane should be placed in order to cover external myometrium and the tumor, both of which need to be analyzed [27] (Figure1).
2.3. MR Analysis. For perfusion data, three types of analysis
exist. The first one is the time intensity curve analysis. For adnexal mass characterization, as shown in Figure 1, two regions of interest are placed on both external myometrium and solid tissue of the adnexal mass on DCE MR sequence. Then, the evolution of relative signal intensity according to time can be assessed using time intensity curves. For
4 40 60 80 120 140 160 180 200 220 50000 100000 150000 5 5 0 4 4 Reformat Native Reformat 100.1 116225.0 -Enhancement Si gnal enha ncemen t (%) Time (s)
Figure 1: Perfusion MR acquisition. The sequence may be acquired in 2D plane in order to cover both external myometrium and the tumor or in axial 3D plane with a high quality of reformatting imaging in sagittal and coronal planes.
characterization of adnexal masses, time intensity curve of solid tissue in an adnexal mass is compared to that of external myometrium, which acts as the internal reference. The use of an internal reference overcomes to some extent the lack of reproducibility which is well known to be the main limitation of this type of postcontrast perfusion data. Thus, when solid tissue is enhanced with a weak and progressive curve in comparison to the myometrium, the curve is named “type 1.” When solid tissue is enhanced with a moderate enhancement in comparison to myometrium with a plateau, the curve is named “type 2.” Finally, when solid tissue is enhanced with a curve steeper than that of myometrium, whatever the intensity of enhancement, the curve is named “type 3” [28] (Figure2).
The second type of analysis is named semiquantitative analysis based also on relative signal intensity of the curve as descriptive analysis. Area under the enhancing curve may be easily calculated and the initial area under the curve (before 60 sec) named Initial Area under Curve (IAUC60) has been demonstrated useful for adnexal masses characteri-zation [28,29]. Using different mathematic models, the time intensity curve can be fitted. With a high temporal resolution acquisition data, Thomassin-Naggara et al. determined three semiquantitative parameters by fitting with Hill equation: enhancement amplitude (EA), time of half rising (THR), and maximal slope (MS) of the curve. These parameters were demonstrated to be useful to characterize adnexal masses because a correlation was proven between enhancement amplitude and maximal slope with pericyte coverage index
Si gnal in te n si ty (%) Myometrium Curve type3 Curve type2 Curve type1 Time (s) 0 180
Figure 2: Time intensity curve.
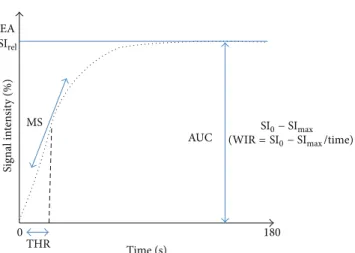
(PCI) and high expression of VEGFR-2 on both epithelial and endothelial cells [25]. Moreover, an independent exter-nal validation of these parameters was performed later on another population studied in another center [29]. With a lower temporal resolution acquisition data of 30 seconds, Dilks et al. demonstrated the usefulness of other parameters including mean SImax, a lower SIrel, and a wash-in rate (WIR) that corresponds to the ratio between enhancement amplitude and time [30] (Figure3). These authors underlined the simplicity of this technique because the software used to calculate enhancement parameters is widely available on MR imaging workstations [31].
EA SIrel 0 180 MS AUC THR Si gnal in te n si ty (%) Time (s)
(WIR = SI0− SImax/time)
SI0− SImax
Figure 3: Semiquantitative analysis. Different parameters published were EA (enhancement amplitude), THR (time of half rising), maximal slope (MS), SIrel (maximal relative enhancement), WIR (wash-in rate), and SImax.
As we underlined before, descriptive and semiquan-titative analysis are based on signal intensity evaluation. However, using MR imaging, signal intensity depends mainly on the type of acquisition parameters, such as flip angle and TR. Image contrast provided by the administration of contrast agent and linearity between signal intensity variation and contrast agent concentration are highly dependent on these parameters [32]. Thus, many authors argue that we need to obtain reproducible perfusion parameters inde-pendent of acquisition conditions. We needed to develop perfusion parameters that are not expressed according to signal intensity but to gadolinium concentration [33]. Then, a more recent approach consists in a quantitative analysis which is based on a pharmacokinetic modeling allowing conversion of signal intensity into gadolinium concentration [34,35]. Depending on the temporal resolution of the acqui-sition, different pharmacokinetic models may be applied. At low temporal resolution acquisition (>10 sec), Carter et al. demonstrated the usefulness of Tofts-Kety model to differentiate benign from malignant tumors using𝐾transand 𝐾ep[29]. Tofts-Kety model is the most used pharmacokinetic
model in this context thanks to its good reproducibility [35]. However, the original Tofts-Kety is not a physiological model resulting in parameters with values depending on acquisition settings [36]. Moreover, descriptive and semiquantitative analysis showed that the initial part of the curve is the most informative to distinguish benign from malignant tumors which suggests that tissue blood flow would be the most informative parameter. Thus, using high temporal resolution acquisition (3 sec) [37], de Bazelaire et al. described a Brix modified model [38] that allows the determination of tissue blood flow (𝐹𝑇), blood volume fraction (𝑉𝑏), permeability-surface area product (𝑃𝑆), and interstitial volume fraction (𝑉𝑒) and this proved useful for adnexal mass characterization [39] (Figure4).
2.4. Added Value for Adnexal Mass Characterization. The
perfusion weighted MR sequence provides additional criteria for adnexal characterization.
Red cells Tissue cells Tissue Artery AIF F Dt Plasma (Vb) Interstitium (Ve) PS
Figure 4: Pharmacokinetic model: Brix modified model with 4 quantitative parameters including tissue blood flow (𝐹), blood volumetric fraction (𝑉𝑏), the product of capillary wall permeability
and surface area (𝑃𝑆), interstitial volume (𝑉𝑒), and the delay for the contrast media to reach tissue (𝐷𝑡).
Using descriptive analysis, first publications demon-strated in a population of 37 epithelial tumors that a slow, low-level enhancement pattern typical of a type 1 curve has a sensitivity of 70% and a specificity of 88.8% for benign tumor, whereas a rapid and high level of enhancement typical of a type 3 curve was only found in invasive malignant tumors with a sensitivity of 67%. A type 2 curve was mostly found in borderline tumors (sensitivity 72.4%) but with a lower specificity [28]. The added value of perfusion weighted imaging was tested in a larger population of 87 complex adnexal masses [24] and the addition of time intensity curve analysis resulted in an increase in diagnostic confidence of 25% for a senior reader in pelvic MR imaging. The diagnosis was correctly changed in 7% (3/41) of malignant masses and in 62% (10/16) of benign masses. No diagnosis was incorrectly changed. In our experience, the time intensity curve analysis is particularly interesting for benign tumors with fibrous component such as ovarian fibroma or cystadenofibroma that do not always display a low T2 signal due to oedematous areas. These lesions typically enhance with time intensity curve type 1 [40] (Figure5). Moreover, time intensity curve analysis is also useful to differentiate borderline from invasive malignant tumors. Typically, borderline tumors display solid papillary projections whereas invasive malignant tumors dis-play a solid mass with or without solid papillary projections. When there is no clear solid mass but grouped solid papillary projection, it can be difficult to be sure if the tumor is only a borderline tumor or an early invasive ovarian cancer. Another application of time intensity curve analysis is to help charac-terize a solid pelvic mass when the ovarian or uterine origin cannot be clearly identified. In menopausal women, normal ovarian parenchyma is more difficult to identify on T2 weighted sequences than in premenopausal women because follicles are usually no longer seen. The two most frequent solid pelvic masses in women are uterine leiomyoma and ovarian fibroma. When a uterine leiomyoma is pedunculated, morphological criteria are sometimes insufficient to be sure of the origin. Moreover, T2 signal intensity is not very useful to distinguish these two tumors. Time intensity curve analysis can be useful in this situation because uterine leiomyomas are typically enhanced with virtually the same time intensity
1.20
Figure 5: Ovarian fibroma right adnexal mixed cystic solid mass with an intermediate T2 weighted signal intensity in the solid component (A), a high DW signal (B), and a time intensity curve weak and progressive without any plateau (dotted line) in comparison with myometrial enhancement (continuous line).
Figure 6: T2 “dark though” effect—cystadenofibroma. The fibrous component of this tumor was highly cellular with an ADC value lower than1 ⋅ 10−3mm2/s. However, the tumor is not bright on DW image because of its low T2 signal (T2 dark through effect).
curve as the myometrium whereas ovarian fibromas display a weak and progressive manner (type 1 curve) [41] (Figure6).
Using semiquantitative analysis, Bernardin et al. demon-strated that benign lesions displayed a lower mean maximal signal intensity (SImax), a lower relative signal intensity (SIrel), and a lower wash-in rate (WIR) than borderline and malig-nant tumors [42] (Figure3). In this study, the authors found a sensitivity of 67% and specificity of 88% in predicting bor-derline/invasive malignancy applying a cutoff WIR of 9.5 l/s, although there was overlap between borderline and benign lesion with a range of 2–8 l/s. Moreover, in a more recent study, the same team confirms that all benign cystadenofi-broma solid tissues have a WIR less than 5.8 l/s [40]. Using myometrium as internal reference, Thomassin-Naggara et al. showed that the enhancement amplitude ratio (EAratio), time of half rising ratio (THRratio), and maximal slope (MSratio) were significantly higher in invasive malignant tumors than in benign and borderline tumors. Moreover, in this last study, borderline tumors were characterized by a higher EAratio than benign tumors whereas no differences between benign and borderline tumors were found using WIR values [43]. Thus, in our experience, the use of myometrium as internal reference improves the diagnostic value of semiquantitative
parameters when viewed in combination with the descriptive parameters.
Using quantitative analysis, Thomassin-Naggara et al. demonstrated that benign tumors displayed a lower tissue blood flow (𝐹𝑇), a lower blood fraction volume (𝑉𝑏), a higher interstitial volume (𝑉𝑒), and a lower relative AUC (rAUC) than malignant tumors. Moreover, borderline tumors displayed a lower𝐹𝑇and a higher𝐷𝑡than invasive ovarian tumors [39]. With data acquired at lower temporal resolution, malignant tumors display a higher𝐾epin their solid
compo-nent than benign tumors (𝑃 < 0,001) [29].
3. Diffusion Weighted MR Sequence
Diffusion weighted (DW) MR imaging is based on the analysis of the movement of water molecules in a tissue. In a highly cellular tissue, a restriction of the movement of water molecules (a reduction in diffusivity) exists between cells and the tissue appears as high signal intensity on high𝑏 value DW image with associated low ADC (apparent diffusion coefficient). In less cellular tissue, there is less restriction of the movement of water molecules. Thus, ADC is high
and the tissue typically appears without any high signal intensity on the high b value DW images. Indeed, depending on acquisition parameters, DW signal will be due to both cellularity (ADC values) and T2 signal.
3.1. MR Acquisition Parameters and MR Analysis. For adnexal
mass characterization, many studies have underlined the usefulness of DW signal intensity, although the ADC analysis for solid component analysis can be unhelpful [29, 44,
45]. In fact, many benign tumors have fibrous tissue that restricts the movement of water molecules. Thus, there is a great overlap between ADC values of the solid tissue of benign and malignant tumors [29, 45]. However, as the DW signal is the combination of water diffusivity and T2 signal intensity, the typically very low T2 weighted signal intensity of fibrous tissue in these benign adnexal tumors decreases the theoretical high DW signal intensity due to the high cellularity of these tumors (T2 dark though effect) (Figure6). Thus, the analysis of DW signal allows correct classification as benign in this group of tumors and makes such criteria accurate to distinguish benign from malignant adnexal tumors.
Then, as mainly DW signal is useful for adnexal mass characterization, we need to optimize a sequence to obtain a sequence with the lowest T2 signal effect with a maximal contrast to noise ratio. T2 signal effect decreases with the increase of𝑏 values. At 𝑏0 value, the sequence is weighted as a T2 weighted sequence. To find the optimal𝑏 value, we use urine as internal reference. As we want to suppress T2 effect, we need to obtain dark urine. In our experience, the right 𝑏 value is between 𝑏1000 and 𝑏1200 depending on the manufacturer.
3.2. Added Value for Adnexal Masses Characterization. Many
publications have studied the value of diffusion MR sequence for adnexal mass characterization. First publications studied the value of diffusion weighted MR imaging to characize endometriotic cystic component or mature cystic ter-atoma [46]. The accuracy of MR imaging with conventional sequences is very high for these benign masses (up to 95%) [14, 47–49]. Thus, the added value of diffusion weighted imaging in this setting is limited and has never been statis-tically demonstrated. Nevertheless, in mature cystic teratoma with paucity of fat, the very low ADC value should be useful to identify keratinoid content [46,50].
Using DWI to characterize solid tissue, many authors demonstrate that ADC values are not useful to distinguish benign from malignant tumors due to the overlap with benign fibrous tumors [44, 51]. However, thanks to “dark through” effect, the value of the absence of DW signal was demonstrated for predicting benignity (positive likelihood ratio = 10.1). Moreover, the combination of a low T2 weighted signal with a low DW signal allows a confident exclusion of malignancy. These preliminary data were con-firmed in further studies that underlined the added value of diffusion weighted sequence to increase diagnostic con-fidence in 15% and especially for benign tumors [24]. The diagnosis was correctly changed in 8.9% (4/45) of malignant
masses and in 28% (8/28) of benign masses. One diagnosis was incorrectly changed in one case of ovarian fibroma (Figure7).
4. Combination of Functional Parameters in
an Interpretation Model
Finally, some studies have evaluated the usefulness of the added combination of perfusion and diffusion weighted analysis to conventional analysis. These studies demonstrated that functional analysis is useful especially for reclassifying as benign tumors that were misclassified as malignant using conventional criteria. In our experience, that is the main issue for clinical practice. Indeed, recent trials have shown that unnecessary interventions in women with benign adnexal lesions lead to significant morbidity and mortality [52]. All women have operative and anesthetic risks, which are increased in menopausal women with additional comorbidity factors (obesity, diabetes, and hypertension). Moreover, in premenopausal women, preservation of fertility is a major issue as ovarian surgery mainly based on cystectomy is asso-ciated with the risk of ovarian reserve alteration, especially for cysts greater than 5 cm in diameter [53,54].
Although MRI is the most accurate imaging technique to characterize adnexal masses [54, 55], a debate exists on its use among clinicians explaining why only 25% of surgeons performed MR imaging before surgery and thus the high incidence of preoperative misdiagnoses [23].
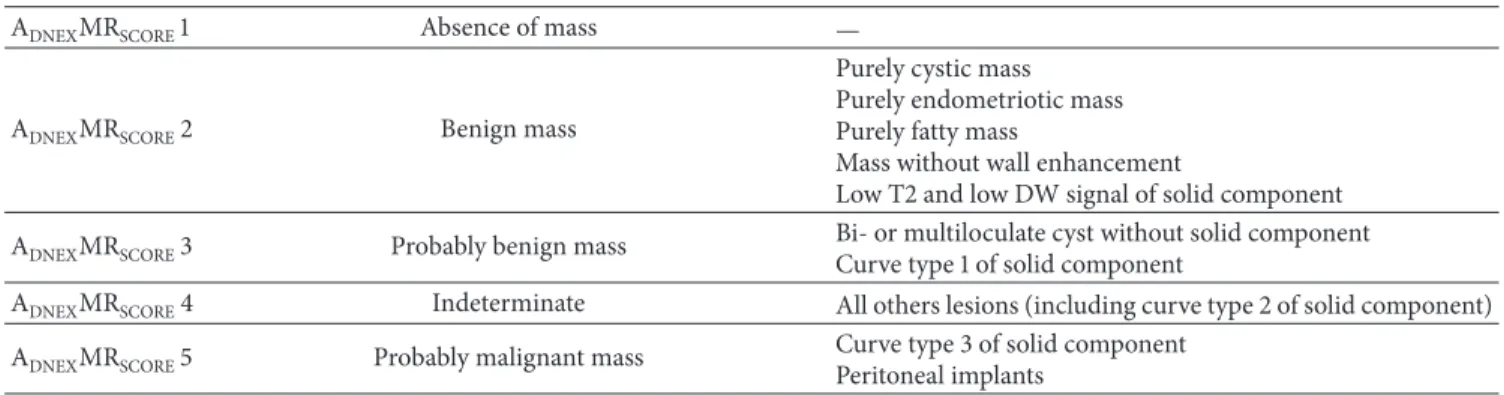
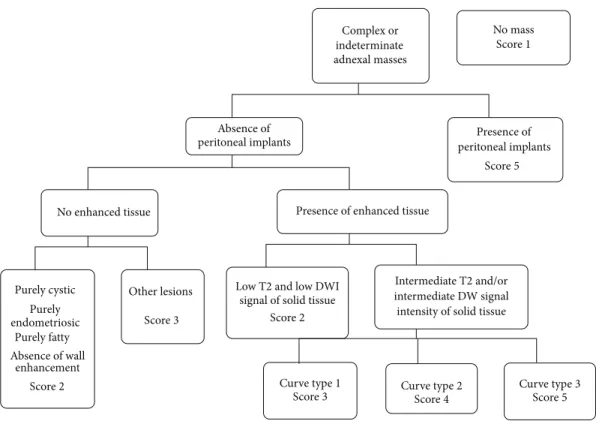
One hypothesis is the lack of standardization of the MR report and the absence of combination of conventional and functional criteria and this could in part be responsible. In this context, the first MR diagnostic score was recently built and described each complex adnexal mass according its positive predictive value of malignancy with a five categories score named ADNEXMRSCORINGsystem [19] (Table2). If the
complex mass does not display any enhancing solid tissue, the classification is ADNEXMRSCORE2 or 3 with a PPV lower than
5%. If a complex adnexal mass displays an enhancing solid tissue, in the absence of peritoneal implants, we need to take account of the evaluation of diffusion weighted (DW) signal and time intensity curve analysis. Functional sequences are included in this score as follows: If there is a low T2 and low DW signal on the high 𝑏 value image, the tumor is always benign (ADNEXMRSCORE 2). If not, time intensity
curve analysis allows differentiating probably benign masses
(ADNEXMRSCORE 3) (if the solid tissue is enhanced
accord-ing to a type 1 time intensity curve), indeterminate mass
(ADNEXMRSCORE4) (if the solid tissue is enhanced according
to a type 2 time intensity), and probably malignant mass
(ADNEXMRSCORE5) (if the solid tissue is enhanced with a type
3 time intensity curve) (Figure8). This score was developed and validated with a very high accuracy (AUROC> 0.94). A score≤ 3 has been associated with benignity with a sensitivity of 96.6% and a specificity of 93.5%. A multicentre European prospective study (the “EURAD study”) is currently in recruitment, with the aim of validating the proposed scoring system (clinical trialNCT01738789). The potential impact of
ADNEXMRSCORE4 Indeterminate All others lesions (including curve type 2 of solid component) ADNEXMRSCORE5 Probably malignant mass Curve type 3 of solid component
Peritoneal implants (a) (b) (c) (d) (e) 0 40 80 160 120 200 240 280 320 360 377 −19 14 8 12 16 20 24 28 32 36 40 44 48 52535 m # 1 1 1 2 2 2 Si gnal enha ncemen t (%) Number of phase (f)
Figure 7: Added value of perfusion and diffusion weighted imaging. Right side: mature cystic teratoma (purely fatty mass: ADNEXMRscore
2). Left side: borderline serous cystadenoma (solid tissue which is bright on T2 and DW sequence and that enhances with a TIC type 2: ADNEXMRscore4). T2 weighted sequence (a), T1 weighted sequence (b), T1 weighted sequence with fat saturation (c), T1 weighted sequence with gadolinium (d), DW sequence (e), and PW analysis comparing myometrial TIC (1) and tumoral TIC (2) (f).
Complex or indeterminate adnexal masses No mass Score1 Absence of
peritoneal implants peritoneal implantsPresence of Score5
No enhanced tissue Presence of enhanced tissue
Purely cystic Purely endometriosic Purely fatty Absence of wall enhancement Score2 Other lesions Score3 Intermediate T2 and/or intermediate DW signal intensity of solid tissue
Curve type1
Score3 Curve typeScore4 2
Curve type3 Score5 signal of solid tissue
Score2
Low T2 and low DWI
Figure 8: ADNEXMR scoring system (19).
the score on therapeutic management will then be tested in a future trial.
In this review, we present the development of perfusion and diffusion analysis to characterize sonographically inde-terminate adnexal masses. Using time intensity curve analysis and visual assessment of DW signal, functional criteria help the radiologist to improve lesion characterization especially for benign lesions and should help the clinician to avoid unnecessary surgeries. Currently, few data are available to validate in clinical routine more reproducible perfusion analysis for the characterization of adnexal masses. Very recently, new developments of DWI were reported thanks to 3T acquisition including the analysis of the heterogeneity of the tumor (ADC entropy) [51]. This method of research would be interesting in the future to find new criteria of characterization.
5. Key Points
(1) Perfusion weighted and diffusion weighted MR imag-ing help to characterize adnexal masses.
(2) Benign tumors with solid components typically dis-play a low DWI signal.
(3) Benign solid tumors are typically enhanced with a type 1 time intensity curve.
(4) ADNEXMRSCORINGsystem is helpful to relay the
radi-ologist’s suspicion of malignancy.
Abbreviations
MR: Magnetic resonance
VEGF: Vascular Endothelial Growth Factor DCE: Dynamic Contrast Enhanced GRE: Gradient Echo
IAUC: Initial Area under Curve EA: Enhancement amplitude THR: Time of half rising MS: Maximal slope
PCI: Pericyte coverage index WIR: Wash-in rate
𝐹𝑇: Tissue blood flow 𝑉𝑏: Blood volume fraction
𝑃𝑆: Permeability-surface area product 𝑉𝑒: Interstitial volume fraction TR: Time of relaxation
SImax: Maximum signal intensity
EAratio: Enhancement amplitude ratio
THRratio: Time of half rising ratio
MSratio: Maximal slope
ADC: Apparent diffusion coefficient.
Disclosure
As this paper is a review, no ethics committee approval is required. I. Thomassin-Naggara (Invited conference for Gen-eral Electric, Consultant for Olea). A. Rockall (Invited confer-ence for Guerbet).
Doppler ultrasound, immunohistochemistry, and microvessel density,” Cancer, vol. 80, no. 5, pp. 899–907, 1997.
[2] E. M. Schutter, P. Kenemans, and C. Sohn, “Diagnostic value of pelvic examination, ultrasound, and serum CA 125 in post-menopausal women with a pelvic mass. An international multicenter study,” Cancer, vol. 74, no. 4, pp. 1398–1406, 1994. [3] M. H. Vuento, J. P. Pirhonen, J. I. Makinen, P. J. Laippala, M.
Gronroos, and T. A. Salmi, “Evaluation of ovarian findings in asymptomatic postmenopausal women with color doppler ultrasound,” Cancer, vol. 76, no. 7, pp. 1214–1218, 1995. [4] D. L. Brown, M. C. Frates, F. C. Laing et al., “Ovarian masses: can
benign and malignant lesions be differentiated with color and pulsed Doppler US?” Radiology, vol. 190, no. 2, pp. 333–336, 1994.
[5] D. Levine, D. L. Brown, R. F. Andreotti et al., “Management of asymptomatic ovarian and other adnexal cysts imaged at US: society of radiologists in ultrasound consensus conference statement,” Radiology, vol. 256, no. 3, pp. 943–954, 2010. [6] D. Timmerman, A. C. Testa, T. Bourne et al., “Logistic
regres-sion model to distinguish between the benign and malignant adnexal mass before surgery: a multicenter study by the Inter-national Ovarian Tumor Analysis Group,” Journal of Clinical
Oncology, vol. 23, no. 34, pp. 8794–8801, 2005.
[7] K. Kinkel, H. Hricak, Y. Lu, K. Tsuda, and R. A. Filly, “US characterization of ovarian masses: a meta-analysis,” Radiology, vol. 217, no. 3, pp. 803–811, 2000.
[8] Y.-Y. Jeong, E. K. Outwater, and H. K. Kang, “Imaging evalua-tion of ovarian masses,” Radiographics, vol. 20, no. 5, pp. 1445– 1470, 2000.
[9] J. W. Walsh, K. J. W. Taylor, J. F. Wasson, P. E. Schwartz, and A. T. Rosenfield, “Gray-scale ultrasound in 204 proved gynecologic masses: accuracy and specific diagnostic criteria,” Radiology, vol. 130, no. 2, pp. 391–397, 1979.
[10] M. Bazot, E. Dara¨ı, D. J. Biau, M. Ballester, and L. Dessolle, “Learning curve of transvaginal ultrasound for the diagnosis of endometriomas assessed by the cumulative summation test (LC-CUSUM),” Fertility and Sterility, vol. 95, no. 1, pp. 301–303, 2011.
[11] J. Yazbek, S. K. Raju, J. Ben-Nagi, T. K. Holland, K. Hillaby, and D. Jurkovic, “Effect of quality of gynaecological ultrasonogra-phy on management of patients with suspected ovarian cancer: a randomised controlled trial,” The Lancet Oncology, vol. 9, no. 2, pp. 124–131, 2008.
[12] E. S. Siegelman and E. K. Outwater, “Tissue characterization in the female pelvis by means of MR imaging,” Radiology, vol. 212, no. 1, pp. 5–18, 1999.
[13] K. Kinkel, Y. Lu, A. Mehdizade, M.-F. Pelte, and H. Hricak, “Indeterminate ovarian mass at US: incremental value of second imaging test for characterization-meta-analysis and Bayesian analysis,” Radiology, vol. 236, no. 1, pp. 85–94, 2005.
109–115, 1996.
[17] Y. Yamashita, M. Torashima, Y. Hatanaka et al., “Adnexal masses: accuracy of characterization with transvaginal US and precontrast and postcontrast MR imaging,” Radiology, vol. 194, no. 2, pp. 557–565, 1995.
[18] D. Timmerman, L. Valentin, T. H. Bourne, W. P. Collins, H. Ver-relst, and I. Vergote, “Terms, definitions and measurements to describe the sonographic features of adnexal tumors: a con-sensus opinion from the International Ovarian Tumor Analysis (IOTA) group,” Ultrasound in Obstetrics & Gynecology, vol. 16, no. 5, pp. 500–505, 2000.
[19] I. Thomassin-Naggara, E. Aubert, A. Rockall et al., “Adnexal masses: development and preliminary validation of an MR imaging scoring system,” Radiology, vol. 267, no. 2, pp. 432–443, 2013.
[20] M. Bazot, D. Haouy, E. Dara¨ı, A. Cortez, S. Dechoux-Vodovar, and I. Thomassin-Naggara, “Is MRI a useful tool to distinguish between serous and mucinous borderline ovarian tumours?”
Clinical Radiology, vol. 68, no. 1, pp. e1–e8, 2013.
[21] M. Bazot, J. Nassar-Slaba, I. Thomassin-Naggara, A. Cortez, S. Uzan, and E. Dara¨ı, “MR imaging compared with intraoperative frozen-section examination for the diagnosis of adnexal tumors; correlation with final histology,” European Radiology, vol. 16, no. 12, pp. 2687–2699, 2006.
[22] S. A. Sohaib, A. Sahdev, P. van Trappen, I. J. Jacobs, and R. H. Reznek, “Characterization of adnexal mass lesions on MR imaging,” American Journal of Roentgenology, vol. 180, no. 5, pp. 1297–1304, 2003.
[23] C. Huchon, A.-S. Bats, C. Bensa¨ıd et al., “Adnexal masses management: a prospective multicentric observational study,”
Gynecologie Obstetrique Fertilite, vol. 36, no. 11, pp. 1084–1090,
2008.
[24] I. Thomassin-Naggara, I. Toussaint, N. Perrot et al., “Character-ization of complex adnexal masses: value of adding perfusion-and diffusion-weighted MR imaging to conventional MR imag-ing,” Radiology, vol. 258, no. 3, pp. 793–803, 2011.
[25] I. Thomassin-Naggara, M. Bazot, E. Dara¨ı, P. Callard, J. Thomassin, and C. A. Cuenod, “Epithelial ovarian tumors: value of dynamic contrast-enhanced MR imaging and correlation with tumor angiogenesis,” Radiology, vol. 248, no. 1, pp. 148–159, 2008.
[26] I. Thomassin-Naggara, D. Balvay, C. A. Cuenod, E. Dara¨ı, C. Marsault, and M. Bazot, “Dynamic contrast-enhanced MR imaging to assess physiologic variations of myometrial perfu-sion,” European Radiology, vol. 20, no. 4, pp. 984–994, 2010. [27] I. Thomassin-Naggara, C. A. Cuenod, E. Darai, C. Marsault, and
M. Bazot, “Dynamic contrast-enhanced MR imaging of ovarian neoplasms: current status and future perspectives,” Magnetic
Resonance Imaging Clinics of North America, vol. 16, no. 4, pp.
[28] I. Thomassin-Naggara, E. Dara¨ı, C. A. Cuenod, R. Rouzier, P. Callard, and M. Bazot, “Dynamic contrast-enhanced magnetic resonance imaging: a useful tool for characterizing ovarian epithelial tumors,” Journal of Magnetic Resonance Imaging, vol. 28, no. 1, pp. 111–120, 2008.
[29] J. S. Carter, J. S. Koopmeiners, J. E. Kuehn-Hajder et al., “Quan-titative multiparametric MRI of ovarian cancer,” Journal of
Magnetic Resonance Imaging, vol. 38, no. 6, pp. 1501–1509, 2013.
[30] P. Dilks, P. Narayanan, R. Reznek, A. Sahdev, and A. Rockall, “Can quantitative dynamic contrastenhanced MRI indepen-dently characterize an ovarian mass?” European Radiology, vol. 20, no. 9, pp. 2176–2183, 2010.
[31] P. Mohaghegh and A. G. Rockall, “Imaging strategy for early ovarian cancer: characterization of adnexal masses with con-ventional and advanced imaging techniques,” Radiographics, vol. 32, no. 6, pp. 1751–1773, 2012.
[32] M. K. Ivancevic, I. Zimine, F. Lazeyras, D. Foxall, and J.-P. Valle, “FAST sequences optimization for contrast media pharmacokinetic quantification in tissue,” Journal of Magnetic
Resonance Imaging, vol. 14, no. 6, pp. 771–778, 2001.
[33] S. M. Galbraith, M. A. Lodge, N. J. Taylor et al., “Reproducibility of dynamic contrast-enhanced MRI in human muscle and tumours: comparison of quantitative and semi-quantitative analysis,” NMR in Biomedicine, vol. 15, no. 2, pp. 132–142, 2002. [34] K. Hittmair, G. Gomiscek, K. Langenberger, M. Recht, H. Imhof, and J. Kramer, “Method for the quantitative assessment of contrast agent uptake in dynamic contrast-enhanced MRI,”
Magnetic Resonance in Medicine, vol. 31, no. 5, pp. 567–571, 1994.
[35] P. S. Tofts, “Modeling tracer kinetics in dynamic Gd-DTPA MR imaging,” Journal of Magnetic Resonance Imaging, vol. 7, no. 1, pp. 91–101, 1997.
[36] C. A. Cuenod, L. Fournier, D. Balvay, and J.-M. Guinebreti`ere, “Tumor angiogenesis: pathophysiology and implications for contrast-enhanced MRI and CT assessment,” Abdominal
Imag-ing, vol. 31, no. 2, pp. 188–193, 2006.
[37] J. L. Evelhoch, “Key factors in the acquisition of contrast kinetic data for oncology,” Journal of Magnetic Resonance Imaging, vol. 10, no. 3, pp. 254–259, 1999.
[38] C. de Bazelaire, N. Siauve, L. Fournier et al., “Comprehensive model for simultaneous MRI determination of perfusion and permeability using a blood-pool agent in rats rhabdomyosar-coma,” European Radiology, vol. 15, no. 12, pp. 2497–2505, 2005. [39] I. Thomassin-Naggara, D. Balvay, E. Aubert et al., “Quantitative dynamic contrast-enhanced MR imaging analysis of complex adnexal masses: a preliminary study,” European Radiology, vol. 22, no. 4, pp. 738–745, 2012.
[40] Y. Z. Tang, S. Liyanage, P. Narayanan et al., “The MRI features of histologically proven ovarian cystadenofibromas-an assessment of the morphological and enhancement patterns,” European
Radiology, vol. 23, no. 1, pp. 48–56, 2013.
[41] I. Thomassin-Naggara, E. Dara¨ı, J. Nassar-Slaba, A. Cortez, C. Marsault, and M. Bazot, “Value of dynamic enhanced magnetic resonance imaging for distinguishing between ovarian fibroma and subserous uterine leiomyoma,” Journal of Computer Assisted
Tomography, vol. 31, no. 2, pp. 236–242, 2007.
[42] L. Bernardin, P. Dilks, S. Liyanage, M. E. Miquel, A. Sahdev, and A. Rockall, “Effectiveness of semi-quantitative multiphase dynamic contrast-enhanced MRI as a predictor of malignancy in complex adnexal masses: radiological and pathological cor-relation,” European Radiology, vol. 22, no. 4, pp. 880–890, 2012.
[43] I. Thomassin-Naggara, E. Darai, C. A. Cuenod, R. Rouzier, P. Callard, and M. Bazot, “Dynamic contrast-enhanced magnetic resonance imaging: a useful tool for characterizing ovarian epithelial tumors,” Journal of Magnetic Resonance Imaging, vol. 28, no. 1, pp. 111–120, 2008.
[44] S. Fujii, S. Kakite, K. Nishihara et al., “Diagnostic accuracy of diffusion-weighted imaging in differentiating benign from malignant ovarian lesions,” Journal of Magnetic Resonance
Imaging, vol. 28, no. 5, pp. 1149–1156, 2008.
[45] I. Thomassin-Naggara, E. Dara¨ı, C. A. Cuenod et al., “Contribu-tion of diffusion-weighted MR imaging for predicting benignity of complex adnexal masses,” European Radiology, vol. 19, no. 6, pp. 1544–1552, 2009.
[46] T. Nakayama, K. Yoshimitsu, H. Irie et al., “Diffusion-weighted echo-planar MR imaging and ADC mapping in the differential diagnosis of ovarian cystic masses: usefulness of detecting keratinoid substances in mature cystic teratomas,” Journal of
Magnetic Resonance Imaging, vol. 22, no. 2, pp. 271–278, 2005.
[47] M. Bazot, F. Boudgh´ene, P. Billi´eres, J.-M. Antoine, S. Uzan, and J.-M. Bigot, “Value of fat-suppression gradient-echo MR imag-ing in the diagnosis of ovarian cystic teratomas,” Clinical
Imaging, vol. 24, no. 3, pp. 146–153, 2000.
[48] C. Guinet, J.-N. Buy, M. A. Ghossain et al., “Fat suppression techniques in MR imaging of mature ovarian teratomas: com-parison with CT,” European Journal of Radiology, vol. 17, no. 2, pp. 117–121, 1993.
[49] C. Guinet, M. A. Ghossain, J.-N. Buy et al., “Mature cystic ter-atomas of the ovary: CT and MR findings,” European Journal of
Radiology, vol. 20, no. 2, pp. 137–143, 1995.
[50] B. Chilla, N. Hauser, G. Singer, M. Trippel, J. M. Froehlich, and R. A. Kubik-Huch, “Indeterminate adnexal masses at ultra-sound: effect of MRI imaging findings on diagnostic thinking and therapeutic decisions,” European Radiology, vol. 21, no. 6, pp. 1301–1310, 2011.
[51] A. S. Kierans, G. L. Bennett, T. C. Mussi et al., “Characterization of malignancy of adnexal lesions using ADC entropy: compar-ison with mean ADC and qualitative DWI assessment,” Journal
of Magnetic Resonance Imaging, vol. 37, no. 1, pp. 164–171, 2013.
[52] S. S. Buys, E. Partridge, M. H. Greene et al., “Ovarian cancer screening in the Prostate, Lung, Colorectal and Ovarian (PLCO) cancer screening trial: findings from the initial screen of a randomized trial,” American Journal of Obstetrics &
Gyne-cology, vol. 193, no. 5, pp. 1630–1639, 2005.
[53] H. Roman, M. Auber, C. Mokdad et al., “Ovarian endometrioma ablation using plasma energy versus cystectomy: a step toward better preservation of the ovarian parenchyma in women wishing to conceive,” Fertility and Sterility, vol. 96, no. 6, pp. 1396–1400, 2011.
[54] H. Hricak, M. Chen, F. V. Coakley et al., “Complex adnexal masses: detection and characterization with MR imaging— multivariate analysis,” Radiology, vol. 214, no. 1, pp. 39–46, 2000. [55] E. K. Outwater and C. J. Dunton, “Imaging of the ovary and adnexa: clinical issues and applications of MR imaging,”
Submit your manuscripts at
http://www.hindawi.com
Stem Cells
International
Hindawi Publishing Corporation
http://www.hindawi.com Volume 2014
Hindawi Publishing Corporation
http://www.hindawi.com Volume 2014
Behavioural
Neurology
Endocrinology
International Journal ofHindawi Publishing Corporation
http://www.hindawi.com Volume 2014
Hindawi Publishing Corporation
http://www.hindawi.com Volume 2014
BioMed
Research International
Oncology
Journal of Hindawi Publishing Corporationhttp://www.hindawi.com Volume 2014
Hindawi Publishing Corporation
http://www.hindawi.com Volume 2014
Oxidative Medicine and Cellular Longevity
Hindawi Publishing Corporation
http://www.hindawi.com Volume 2014
PPAR Research
Immunology Research
Hindawi Publishing Corporation
http://www.hindawi.com Volume 2014
Journal of
Obesity
Journal ofHindawi Publishing Corporation
http://www.hindawi.com Volume 2014
Hindawi Publishing Corporation
http://www.hindawi.com Volume 2014
Computational and Mathematical Methods in Medicine
Ophthalmology
Journal of Hindawi Publishing Corporationhttp://www.hindawi.com Volume 2014
Hindawi Publishing Corporation
http://www.hindawi.com Volume 2014
Research and Treatment
AIDS
Hindawi Publishing Corporation
http://www.hindawi.com Volume 2014