STUDY OF THE PROPOLIS EXTRACT AS A CORROSION INHIBITOR OF COPPER ALLOY IN ETHYLENE GLYCOL / WATER 0.1 M NaCl
H. Hachelef*1, A. Benmoussat1, A. Khelifa2, M. Meziane3
1
Materials and Corrosion Equip of LAEPO Research Laboratory Abobeker Belkaid University of Tlemcen BP 230, Tlemcen 13000 Algeria
2
Research laboratory of processes Genius, Department of Industrial Chemistry, Faculty of Technology, Saâd Dahlab University of Blida, BP 270, 09000, Blida, Algeria
3
Laboratory of fundamental and applied physics Faculty of Technology, Saâd Dahlab University of Blida, BP 270, 09000, Blida, Algeria
Received: 26 September 2016 / Accepted: 15 April 2017 / Published online: 01 May 2017 ABSTRACT
The effect of propolis extract as a corrosion inhibitor of copper alloy in ethylene glycol / water 0.1 M NaCl solution was studied by electrochemical measurements. The Tafel polarization curves showed that the propolis extract at different concentration acts as mixed inhibitor, and the maximum value of the inhibitory efficacy is 73.28% at optimum concentration of 1.25 g/L of propolis extract. The activation parameters reveal that the inhibitor molecules on copper surface are absorbed by physisorption and obey Langmuir isotherm adsorption. These results were supplemented by IR Spectroscopy, Scanning electron microscopy (SEM) and EDX spectrum of chemical composition. The metal solution interface is simulated as a physical model by using Electrochemical Impedance Spectroscopy (EIS). Keywords: Copper Alloy, Propolis extract, ethylene glycol; Corrosion inhibition; Adsorption, Electrochemical impedance Spectroscopy (EIS).
Author Correspondence, e-mail:hachelefhakima@yahoo.fr
doi:http://dx.doi.org/10.4314/jfas.v9i2.3
ISSN 1112-9867
Available online at http://www.jfas.info
Journal of Fundamental and Applied Sciences is licensed under aCreative Commons Attribution-NonCommercial 4.0 International License.Libraries Resource Directory. We are listed underResearch Associationscategory.
1. INTRODUCTION
Water and ethylene glycol-water solutions are fluids commonly used in cooling systems. Although the fluids are the essential component of heat transfer applications, they can also cause corrosion within the systems. Studies show that uninhibited ethylene glycol degrades in five organic components (glycolic, glyoxylic, formic, carbonic acid and oxalic acid) in the presence of heat, oxygen and metals that are commonly found in cooling systems, such as copper and aluminum [1-6]. When copper is corroded, it is often degraded by general corrosion. General corrosion will often attack the copper exposed to oxygen or fluids with high sulfur content or salts dissolved in the fluid, such as chloride ions.
The corrosion of copper can be inhibited by a wide range of substances which may be synthetic or natural inhibitors, such as the biomaterials [1,4,5], Synthetic compounds containing multiple bonds and hetero atoms which are effective inhibitors, but at the same time the processing time, cost and their toxic nature have compelled the researchers to look for eco-friendly, nontoxic and low cost inhibitors for the corrosion protection of metals. Many corrosion prevention works have been carried out using extracts of various plants as corrosion inhibitors [6-24]. The use of plants extracts has been found to be viable alternative. The bioactive compounds in the plant extract are as effective as synthetic inhibitors [20-24]. These bioactive compounds act as inhibitors in ethylene glycol / water 0,1M NaCl. They also interact with metals and affect the corrosion reaction in a number of ways, some of which may occur simultaneously. Propolis is a resinous substance prepared by honeybees from buds, leaves and exudates of trees and plants mixed with pollen, wax and enzymes secreted from the bees [5, 21]. Some important characteristics have been reported concerning this substance, such as antimicrobial and antioxidant effects, anesthetic properties and others, it found that the propolis extracts represent an important functional product, rich in flavonoids and polyphones [8-12]. The used raw propolis have been obtained in harvest month of April from the region of Bordj El – Menaiel in septembre 2014, copper alloy behavior in ethylene glycol (30%)-water(70%) solution 0,1M NaCl with and without propolis extract as corrosion inhibitors motivate our research. The purpose of the present work is to examine the inhibition effect of propolis extract on copper corrosion in ethylene glycol (30%)/ water
(70%) solution 0,1M NaCl. The inhibitory efficiency of this alloy immersed in this solution will be evaluated using various electrochemical techniques namely, the potentiodynamic polarisation curves and electrochemical impedance spectroscopy (EIS). These results were supplemented by IR Spectroscopy, Scanning electron microscopy (SEM) coupled with EDX.
2. MATERIALS AND METHODS
2.1. Materials: A copper alloy of Rectangular dimension 1cm2is used as a sample electrode. The chemical compositions of the alloy used are shown below in Table1 determined by spectrometry kind “SPECTROLAB”.
Table 1. Chemical composition of copper alloy used in Wt. %
Cu Mn Si Mg Fe Co Au Se Sb Zn
70.7 0.0005 0.0005 0.0002 0.014 0.016 0.0043 0.019 0.015 29.19
The cutting process was chosen as it does not alter the microstructure and corrosion test at the coupon surface due to its low heat input and the absence of mechanical damage by avoiding the thermically affected zones. Pre-treatment of copper sample surfaces was carried out by grinding with emery paper of 600- 1200 grit, rinsing with bidistilled water, and ultrasonic degreasing in acetone and dried at room temperature .
2.2. Solution preparation
Sample of propolis extract has been obtained in harvest month of April from the region of Bordj El Menaiel in Algeria. The extract was prepared by dissolving 5g of propolis in 100 ml of ethylene glycol. This extract was used to study the corrosion inhibition in ethylene glycol (30%) / water (70%) 0.1M NaCl. The solution tests are freshly prepared before each experiment. Experiments were carried out in triplicate to ensure the reproducibility.
2.3. Electrochemical tests
The electrochemical study was carried out using a potentiostat Autolab brand piloted by Nova 1.7 software, connected to a cell with three electrode thermostats and double wall (Tacussel Standard CEC/TH). A saturated calomel electrode (SCE) and platinum electrode have been used as reference and auxiliary electrodes, respectively. The surface area exposed to the
electrolyte is 1Cm2. The working electrode was immersed in the testing solution for 1/2 h to reach a quasi-stationary value of the open circuit potential prior to the measurements. Tafel polarization curves were obtained by changing the electrode potential automatically from -150 to +150 mV (vs. SCE) at a scan rate of 1 mV.s-1. The electrochemical impedance spectroscopy (EIS) measurements are carried out with the electrochemical system (Tacussel), which included a digital potentiostat model Autolab 1.7 computer at Ecorr after immersion in solution without bubbling. After the determination of steady-state current at a corrosion potential, sine wave voltage (10 mV) peak to peak, at frequencies between 100 kHz and 10 mHz are superimposed on the rest potential. Computer programs automatically controlled the measurements performed at rest potentials after half an hour of exposure at 298 K. The impedance diagrams are given in the Nyquist, Bode and plot phase representation. Experiments are repeated three times to ensure the reproducibility. The corrosion inhibition efficiency (E) by potentiodynamic polarization was calculated from the value of icorr by using the formula (1) [24–26].
0 0 100 corr corr corr i i E(%) i (1) 0 corr
i and icorr are the corrosion current in the absence and presence of the inhibitor, respectively.
The inhibition efficiency by electrochemical impedance was calculated using the equation [25]. 0 100 p p p R R E(%) R (2) 0 p
R and Rpare the polarization resistance in the absence and presence of the inhibitor,
respectively.
2.4. Temperature studies
The Tafel polarization curves and the electrochemical impedance spectroscopy (EIS) measurements analysis were performed at different temperatures of 298,313,353, K, using a thermostat to study the inhibition efficiency of the extract. This provided details on the nature of the adsorption and activation energies. The activation energy (Ea) of the inhibitor was
calculated by a graphical method, plotting log(C) versus1000/T (K−1) for the temperatures of 298,313,353, K in ethylene glycol (30% ) / water (70%) 0,1 M Na Cl, both with and without the inhibitor. At all extract concentrations Ea was calculated using the formula:
2 303 8 314 Ea . . Slope J (3) 1 K c( ) (4)where is the surface coverage of the inhibitor, C is the concentration of the inhibitor in g/l,
K is the equilibrium constant, and T is the temperature.
2.5. Technical analysis
The copper specimen was characterized with the aid of FEI Quanta 650 FEG scanning electron microscope (SEM) (magnification range from 5-1,000,000x) ( High-vacuum (HV) mode (pressure range 10-2-10-4Pa) . The SEM images were taken at the accelerating voltage of 10kV .Test specimens of 1×1cm2 in size were immersed in 100mL of ethylene glycol (30%)-water (70%) 0.1MNaCl containing1,25g/L of propolis extract for 24h at 298±2K. After washing, the test specimens were dried and their morphologies were examined. The study solution containing 1,25g / L of propolis extract before and after the 24 hours of immersion was analyzed with IR Spectroscopy and UV-visible.
3. RESULT AND DISCUSSION 3.1. Electrochemical method
3.1.1. Effect of inhibitor concentration:
-200 0 200 400 600 800 1000 1200 1400 1600 1800 2000 -0,40 -0,39 -0,38 -0,37 -0,36 -0,35 -0,34 -0,33 -0,32 -0,31 -0,30 -0,29 -0,28 -0,27 Cu blank Cu +0,25g/L Cu+0,5g/L Cu+0,75g/L Cu+1gL Cu +1,25g/L E (V /E C S ) Time (s)
Figure.1 shows the evolution of the open circuit potential (OCP) with time of the copper alloy at a temperature of 25 °C and at various concentrations of the propolis extract in ethylene glycol (30%) /water (70%) solution 0.1 M NaCl. Inspection of these curves shows that between 0- 200 seconds there is an increase in potential values for different concentrations, above 200 seconds we notice the appearance of a bearing with a displacement of potential to negative values of -0,28 V to -0,291 / SCE for a concentration 1,25g / L. This bearing is explained by a passivation phenomenon due to the formation of a copper oxide layer
3.1.1.2. Potentio-dynamic curves
The study of the influence of the concentration of 0.25, 0.5, 0.75 , 1 and / L and 1.25 g / L of the propolis extract of ethylene glycol (30%) / water (70%) solution 0,1 M NaCl on the curves polarization of copper alloy at 298 K is shown in the following figure (2).
-0,45 -0,40 -0,35 -0,30 -0,25 -0,20 -0,15 -0,10 -8,0 -7,5 -7,0 -6,5 -6,0 -5,5 -5,0 -4,5 -4,0 -3,5 -3,0 blank 0,25g/L 0,5g/L 0,75g/L 1g/L 1,25g/L Lo g cu rr en t ( C m 2) E (V/ ECS)
This figure shows that the corrosion potential remains nearly constant; it also shows the Fig.1. OCP curves for copper alloy in ethylene glycol (30%) / water (70%) 0.1 M NaCl at
different concentrations of propolis extract
Fig.2. Potentiodynamic curves for copper alloy in ethylene glycol (30%) - water (70%) 0.1M NaCl at different concentration of propolis extract
lowering of the cathodic corrosion current density. The electrochemical such as corrosion potential (Ecorr), corrosion current density (icorr), cathodic Tafel slope (bc), anodic Tafel slope
(ba) and inhibition efficiency (E %) are calculated and given in Table1.
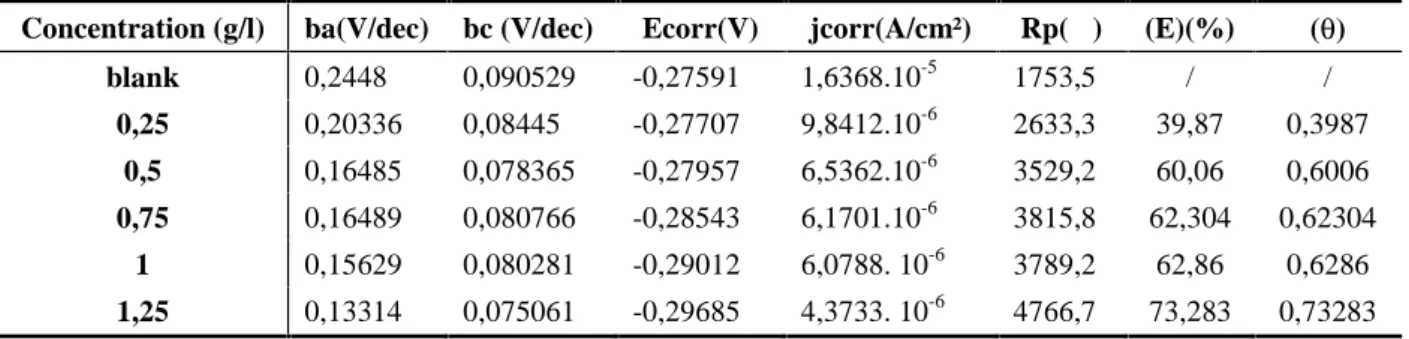
Table 1. Potentiodynamic polarization parameters for the corrosion of copper alloy in ethylene glycol / water 1M NaCl containing different concentrations of propolis extract
Concentration (g/l) ba(V/dec) bc (V/dec) Ecorr(V) jcorr(A/cm²) Rp(Ω) (E)(%) () blank 0,2448 0,090529 -0,27591 1,6368.10-5 1753,5 / / 0,25 0,20336 0,08445 -0,27707 9,8412.10-6 2633,3 39,87 0,3987 0,5 0,16485 0,078365 -0,27957 6,5362.10-6 3529,2 60,06 0,6006 0,75 0,16489 0,080766 -0,28543 6,1701.10-6 3815,8 62,304 0,62304 1 0,15629 0,080281 -0,29012 6,0788. 10-6 3789,2 62,86 0,6286 1,25 0,13314 0,075061 -0,29685 4,3733. 10-6 4766,7 73,283 0,73283
The analysis of these values shows an increase in the inhibitory efficacy in a very remarkable manner. The increase of 39,87% shifts to a maximum value of 73, 283% at a concentration of 1,25 g /L extract. This increase can be explained by a phenomenon of absorption of molecules in the propolis extract on the copper alloy surface, which reduces the corrosive activity. The plot of the efficiency (E) depending on the concentration and the trace C / depending on the concentration of the extract will allow us to approach absorption model product at the metal / solution interface. 0,2 0,4 0,6 0,8 1,0 1,2 1,4 0,6 0,8 1,0 1,2 1,4 1,6 1,8 Isotherme Cu R2= 0,967 C / C (g/l)
Fig.3. Langmuir isotherm for copper alloy immersed in an ethylene glycol / water solution 0.1 M NaCl
This plot gives a straight line with a correlation coefficient of 0,967 indicating that the adsorption of the propolis extract to the copper alloy surface follows the Langmuir isotherm. The inhibitory action phenomenon of propolis extract is based on a mechanism of action by simple adsorption to the metal surface, thus blocking the active sites and thus reducing the corrosion current density.
3.1.1.3. Electrochemical impedance spectroscopy
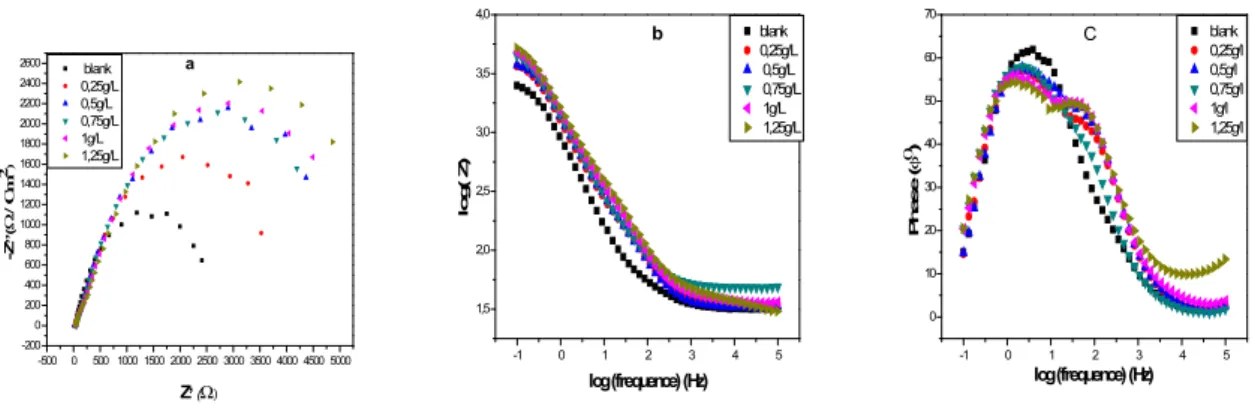
Figure .4 Represents the Nyquist, Bode, Phase angle diagrams of the copper alloy at different concentrations of propolis extract at 298 K . These diagrams were obtained after 30 minutes of immersion in open circuit.
-500 0 500 1000 1500 2000 2500 3000 3500 4000 4500 5000 -200 0 200 400 600 800 1000 1200 1400 1600 1800 2000 2200 2400 2600 blank 0,25g/L 0,5g/L 0,75g/L 1g/L 1,25g/L -Z ,,( / C m 2) Z,( a -1 0 1 2 3 4 5 1,5 2,0 2,5 3,0 3,5 4,0 blank 0,25g/L 0,5g/L 0,75g/L 1g/L 1,25g/L lo g ( Z ) log (frequence) (Hz) b -1 0 1 2 3 4 5 0 10 20 30 40 50 60 70 blank 0,25g/l 0,5g/l 0,75g/l 1g/l 1,25g/l P h a s e ( ) log (frequence) (Hz) C
It is apparent from these plots that the Nyquist diagram response of copper alloy in anuninhibited solution has significantly changed after the addition of propolis extract in the electrolytic solution. This indicates that the Nyquist diagram of inhibited substrate increase with increasing inhibitor concentration and consequently the inhibition efficiency increases. The Nyquist plot has the shape of a quarter of a lemniscates which is a phenomenon of diffusion justified by the straight line of Warburg at high frequencies and the appearance of a constant phase element at bases frequency related to the capacity of the double layer. The equivalent circuit reactions ox / red produced at the metal interface solution is shown in Figure (5) which follows:
Fig.4. (a) Nyquist plots , (b) Bode (plot) (c) phase angle for copper alloy immersed in an ethylene glycol / water solution 0.1M NaCl at different concentrations of inhibitor
Fig.5. Electrochemical equivalent circuit corresponding to the metal / solution interface
The electrochemical equivalent circuit includes the charge transfer (RT) and Warburg impedance which indicates the presence of the diffusion phenomenon of the Cu 2+ cation to the solution in parallel with the phase constant element (CPE) which results from the formation of a layer of oxide on the surface of the copper alloy.
Table 2. Impedance parameters for copper alloy in the absence and presence of the inhibitor Concentration (g/L) CPE.Y0 (F) Rp.R (Ω) Rs.R (Ω) CPE.N E (%) ()
blank 0,00017679 2692,5 53,904 0,99795 / / 0,25 0,00016303 3938,7 113,85 0,99777 31,63 0,3163 0,5 0,00014201 4001,6 135,06 0,99802 32,71 0,3271 0,75 0,00013135 5183,6 109,78 0,99742 48,05 0,4805 1 0,00012209 5606 106,4 0,99716 51,97 0,5197 1,25 0,00011695 6026,9 174,74 0,99731 55,32 0,5532
Inspection of data in table 1 shows a decrease of (CPE) with increasing extract concentration. This decrease may be attributed to the formation of a protective layer on the electrode surface; and the increase in the transfer resistance charge can be justified by the blocking of corrosive sites by the propolis extract. The value of ‘n’ which is not equal to 1 is due to the surface heterogeneity.
3.1.2. Effect of temperature
Potentiodynamic curves have been carried out at different temperatures (298, 313,353 K). The electrochemical parameters obtained for polarization curves for each concentration to different temperatures are grouped in the following table:
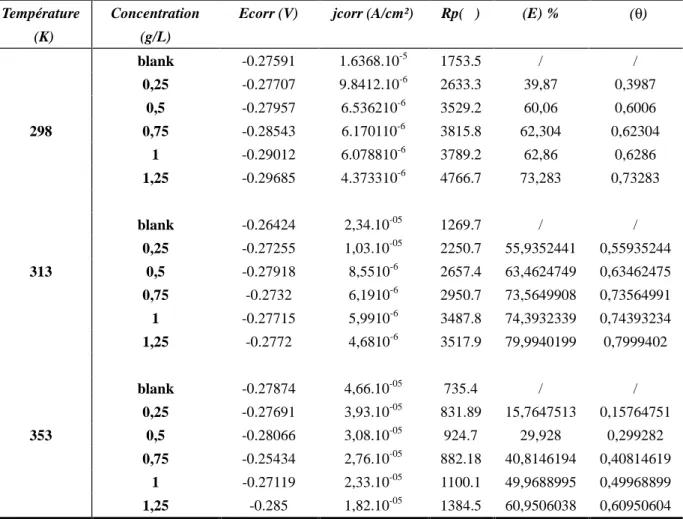
Table 3. Potentiodynamic parameters and inhibitory efficiency for each concentration of the propolis extract at different temperatures 298, 313 and 353 K
Température (K)
Concentration (g/L)
Ecorr (V) jcorr (A/cm²) Rp(Ω) (E) % ()
298 blank -0.27591 1.6368.10-5 1753.5 / / 0,25 -0.27707 9.8412.10-6 2633.3 39,87 0,3987 0,5 -0.27957 6.536210-6 3529.2 60,06 0,6006 0,75 -0.28543 6.170110-6 3815.8 62,304 0,62304 1 -0.29012 6.078810-6 3789.2 62,86 0,6286 1,25 -0.29685 4.373310-6 4766.7 73,283 0,73283 313 blank -0.26424 2,34.10-05 1269.7 / / 0,25 -0.27255 1,03.10-05 2250.7 55,9352441 0,55935244 0,5 -0.27918 8,5510-6 2657.4 63,4624749 0,63462475 0,75 -0.2732 6,1910-6 2950.7 73,5649908 0,73564991 1 -0.27715 5,9910-6 3487.8 74,3932339 0,74393234 1,25 -0.2772 4,6810-6 3517.9 79,9940199 0,7999402 353 blank -0.27874 4,66.10-05 735.4 / / 0,25 -0.27691 3,93.10-05 831.89 15,7647513 0,15764751 0,5 -0.28066 3,08.10-05 924.7 29,928 0,299282 0,75 -0.25434 2,76.10-05 882.18 40,8146194 0,40814619 1 -0.27119 2,33.10-05 1100.1 49,9688995 0,49968899 1,25 -0.285 1,82.10-05 1384.5 60,9506038 0,60950604
Inspection of the results of this table allowed us to observe that, for each concentration is an increase in corrosion rates with the increase in temperature; followed by a remarkable increase in the recovery rate of surface Hoar and Holiday [28] attributed to the increase of the inhibitory efficacy to high temperatures, to a high activation energy during adsorption and high diffusion rate of inhibitory molecules. Singh et al [29] have justified the increasing of the inhibitory efficacy with increasing temperature by the appearance of some chemical changes in the inhibitory molecule which causes an increase in the levels of electronic densities center adsorption of the molecule, and therefore an increase of recovery rate of the surface. Tatati and Gandhi [30] attributed the increase in efficiency to the temperature increase of the area of the metal surface covered by the inhibitor molecules. Fig .6 shows the effect of temperature on the
corrosion current density for each concentration of inhibitor. 2,8 2,9 3,0 3,1 3,2 3,3 3,4 -18,2 -18,0 -17,8 -17,6 -17,4 -17,2 -17,0 -16,8 -16,6 -16,4 -16,2 -16,0 -15,8 a blan 0,25g/l 0,5 g/l 0,75g/l 1g/l 1,25g/l R2= 0,99 L n ( j) / T (A / C m 2 ) 1000/T(°K-1) (b) 2,8 2,9 3,0 3,1 3,2 3,3 3,4 -18,2 -18,0 -17,8 -17,6 -17,4 -17,2 -17,0 -16,8 -16,6 -16,4 -16,2 -16,0 -15,8 blank 0,25g/L 0,5 g/L 0,75g/L 1g/L 1,25g/L R2= 0,99 L n ( j) (A / C m 2 ) 1000/T(°K-1) (a)
a) Thermodynamic activation parameters:
The dependence of corrosion current densities at temperature can be expressed by Arrhenius equation and transition state equation [26, 30]:
corr Ea ln i ln K RT (5)
where icorr is the density corrosion current (A.cm-2); K a constant (pre-exponential factor),
Ea, the activation energy (kJ mol-1); R is the gas constant (J.mol-1.K-1) and T the temperature (K). 0 0 a a corr S H RT i exp exp Nh R RT (6)
The relationship between ln (j /T) and 1/T is shown in fig.6 (b). The Straight lines are
obtained with a slope (H0a /R) and an intercept of log [R/ Nh) + (S0a/ R)], from which the
value ofH0aandS0awere calculated and presented in table.4:
Fig.6. (a) Logarithm plot of the corrosion current densities (b) Arrhenius plots for the copper alloy immersed in an ethylene glycol (30%) / water (70%) solution 0,1M NaCl at
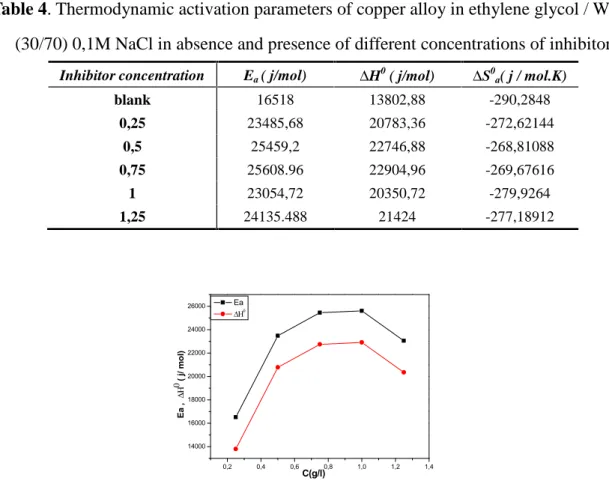
Table 4. Thermodynamic activation parameters of copper alloy in ethylene glycol / Water (30/70) 0,1M NaCl in absence and presence of different concentrations of inhibitor
Inhibitor concentration Ea( j/mol) H0( j/mol) S0a( j / mol.K)
blank 16518 13802,88 -290,2848 0,25 23485,68 20783,36 -272,62144 0,5 25459,2 22746,88 -268,81088 0,75 25608.96 22904,96 -269,67616 1 23054,72 20350,72 -279,9264 1,25 24135.488 21424 -277,18912 0,2 0,4 0,6 0,8 1,0 1,2 1,4 14000 16000 18000 20000 22000 24000 26000 Ea Ea , ( j / m ol ) C(g/l)
Inspection of fig.7 indicated that the value of activation energy and enthalpy of activation varied in the same way, this result verified the thermodynamic relation between Ea and H
[27, 31].
b) Thermodynamic adsorption parameters.
The adsorption behavior of inhibitor molecule on metal surface can be assessed by several adsorption isotherms, among which the most commonly used ones, including Temkin isotherm, Langmuir isotherm, and Frumkin isotherm. In order to obtain the isotherm, the surface coverage degree (), which serves as a function of inhibitor concentration, was calculated by corrosion current density values in an attempt to explain the best isotherm. it is Fig .7. Curve of the variation of the activation energy and the activation enthalpy for the copper alloy in an ethylene glycol / water solution 0,1M NaCl at various concentrations of the
found in fig .3 that the adsorption of propolis extract follows Langmuir adsorption .The relationship between C/ and Cinh at different temperatures (298, 313 , 353 K) is used to
determine the standard free enthalpy energy of adsorption Gads and the constant of
adsorption Kadsusing the following equation :
1000
ads ads
DG RT ln K (7)
Table 5. Thermodynamic adsorption parameters of copper alloy in ethylene glycol Water (30/70) 0.1MNaCl in absence and presence of different concentrations of inhibitor
Température (°K) K ads G0Kj / mol) H0ads(j/ mol) S0ads(j/mol.K)
298 0,85763293 -16,7460343
14452 103.8
313 0,89686099 -17,7054257
353 1,98412698 -22,3001443
The Negative values of Gads indicates the spontaneity of the adsorption process for
temperatures 298 and 313 ° K. TheG0adsvalues are lower in -20 Kj. mol-1.This indicates that
the adsorption is physisorption with the existence of electrostatic interaction forces between the molecules and the inhibitory copper surface oxidized spontaneously, whereas a temperature of 353 ° KGadsvalues are -22,300 kJ / mol which is greater than -20 kJ / mol. This indicates that
the adsorption corresponds to the chemisorption [7-24].
In order to explain the corrosion inhibition of copper alloy using thermodynamic model, heat of adsorption and entropy of adsorption were determined by the relationship between Gadsand
temperature:
0 0 0
ads ads ads
G H T S
(8)
The value of Hads0 is calculated from the intercept and 0 ads S
from the slope
290 300 310 320 330 340 350 360 -23 -22 -21 -20 -19 -18 -17 -16 R2= 0,96 G 0 ( k j/ m o l) T( °K)
Fig .7. Curve of the variation of the activation energy and the activation enthalpy for the copper alloy in an ethylene glycol / water solution 0,1M NaCl at various concentrations of
3.1.3. Study of the effect of immersion time by the method of electrochemical impedance Effect of various immersion times (2,4,6 and 24 h) for the corrosion inhibitor at a concentration of 1.25 g/L of propolis extract at 298 K was studied by the spectroscopy method electrochemical impedance spectroscopy , figure (8) shows the Nyquiste diagrams, bode plot and phase angle after different immersion times containing 1.25 g/L of propolis extract at 298K . 0 500 1000 1500 2000 2500 3000 3500 0 500 1000 1500 2000 2500 2h 4h 6h 24h -Z '' ( Z/() (a) -1 0 1 2 3 4 5 0 10 20 30 40 50 2h 4h 6h 24h P h as e (d eg re e) log( f) (b) -1 0 1 2 3 4 5 1,5 2,0 2,5 3,0 3,5 4,0 2h 4h 6h 24h lo g( Z ) log( fequence) (c)
The high frequency containing the straight line of Warburg can be attributed to the diffusion of Cu2+ ion while the low frequency shows the appearance of a half circle. The larger one appears at 2, 4, 6 hours while the smaller one can be attributed to the charge transfer reaction transfer. The smaller one appears after 24 hours of immersion showing the presence of inductive loop which may be attributed to the relaxation process obtained by adsorption species like Cl- and the carboxylic acid derived from the ethylene glycol conversion with the time .a deviation, from perfect circular shape, often known as frequency dispersion , was attributed to surface roughness and in homogeneities of the copper alloy surface [31,32] The bode plot obtained shows the existence of only time constant justified with a straight line slope.
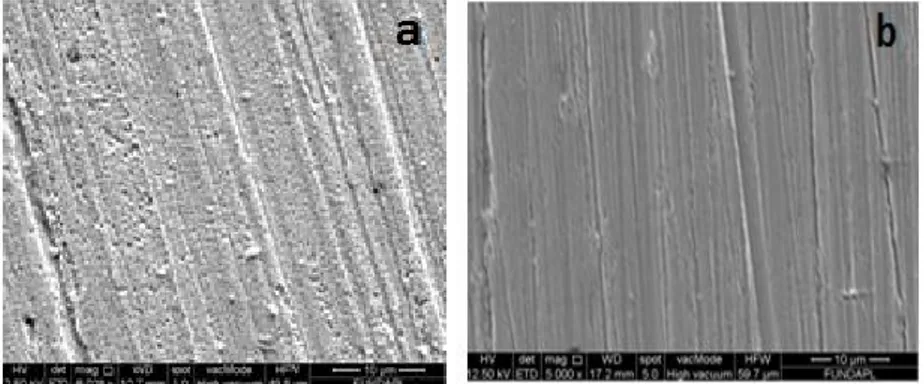
3.1.4. Observation of the surface by the scanning electron microscopy (SEM)
The SEM images and EDX composition of the copper alloy surface exposed to ethylene glycol water solution 0.1M NaCl in absence and presence of 1.25g/l of propolis extract for 24 h are presented in fig 9
Fig.8. (a) Nyquist plots , (b) Bode (plot) (c) phase angle for copper alloy immersed in an ethylene glycol / water solution 0,1M NaCl at different times of immersion
Inhibitor analysis
The FT – IR spectrum of the solution ethylene glycol -water (30%/ 70%) 0.1 M NaCl containing 1.25 g/L propolis extract after and before the immersion the copper alloy surface for 24 h was analyzed.
Fig .9. Scaning electron micrographs and EDX spectrum of the copper alloy surface after 24h immersion at 298 K in ethylene glycol water solution (30%/ 70%) 0.1 M NaCl (a)
Figure 10 shows the FT- IR spectrum of propolis extract after immersion. The band at 3593 cm-1is attributed to OH free of alcohol and phenol stretching vibration, the bands at 3355 and 3190 cm-1 are due to the OH associated stretching vibration, the bands at 2953 cm-1 2886 Cm-1 are due to aliphatic C-H (Sp3) stretching asymmetric and symmetric vibration respectively . The band at 1642 cm-1is due to the C=C aromatic stretching vibration. the band at 1082 Cm-1is due to the stretching vibration C-O of the primary alcohol, but 1041 Cm-1 is due to the to the stretching vibration C-O of ester. The band at 874 Cm-1is attributed to the formation of the bond C- Cl. Comparison with the spectrum after immersion experiments (fig 10.b) clearly points out to the shift in the frequencies at various functional groups indicating the adsorption of these chemical compounds on copper alloy surface, from the FT-IR and SEM – EDX studies. It can be obviously concluded that the various organic compounds containing OH, O, Cl, ester and aromatic compound are effectively adsorbed on the copper alloy surface.
Fig .10. FT – IR Spectrum of the solution ethylene glycol -water (30%/ 70%) 0.1 M NaCl containing 1.25g/l prolpolis extract (a) after and (b) before the immersion of the copper
4. CONCLUSION
The study of propolis extract as a corrosion inhibitor on the copper alloy in ethylene glycol / water (30/70%) NaCl 0.1 M has allowed us to achieve the following conclusion;
1) The maximum inhibitory efficacy determined by potentiodynamic method is 73.38% and 55.55% determined by the impedance technique for concentrating the extract 1.25g / l.
2) The plot C / θ depending on the concentration of the extract is a straight line of positive slope indicating that the adsorption of this extract obeyed to the Langmuir isotherm.
3) The study of the effect of temperature at different concentrations of the extract of 0.25 to 1.25 g/L shows that the molecules of the sample are adsorbed on the alloy surface by electrostatic force low corresponds to physisorption and chimisorption .
3) The effect of duration of treatment shows the increase of the capacitive loop which is a semicircle for a period of immersion of 2, 4 and 6 hours and then decrease one of these for a period of immersion of 24 hours.
5. ACKNOWLEDGEMENTS
We would like to express our gratitude to Prof. A. Khelifa, from the Research laboratory of processes Genius, Department of Industrial Chemistry, Faculty of Technology Saâd Dahlab University of Blida for his kind permission to work in his laboratory.
6. REFERENCES
[1] Guilminot.E., Rameau.J-J., Dalard, F. Degrigny, C. Hiron. X. Benzotriazole as inhibitor for copper with and without corrosion products in aqueous polyethylene glycol (2000) 21-28. [2] Fekry. A. M., Fatayerji. M. Z, Electrochemical corrosion behavior of AZ91D alloy in ethylene glycol Electrochemical Acta 54 (2009) 6522–6528.
[3] Niknejad. M, Khomami corrosion of alloy steel in 30% ethylene glycol solution and CrO42-under hydrodynamique conditions 20(6) ( 2013 ) 82-87.
[5] Hegazy M. A., Badawi. A. M. Abd El Rehim, S. S, Kamel W. M, Corros. Sci. 69 (2013) 110–122.
[6] Nathalie.O, Francis. M, Nadine. P, influence of flow on the synergistic effet of an inhibitive mixture used for water treatment in cooling circuit J Appl. Electrochem 32. (2002) 497.
[7] Noore. A, Journal of Appl Electrochem. 39 (2009) 1465−1475.
[8] Beatriz. C, Mello. S, Miriam .B. Hubinger. D, Inter. J. Food Sci and Techn. 47 (2012) 2510–2518.
[9] Coral .O, J. Cancer Sci. Ther. 5 (10) (2013) 1948-5956.
[10] Rebiai A., Lanez T., Belfar M. L., Int. J. Pharmacol. 2011, 7 (1), 113-118, doi: 10.3923/ijp.2011.113.118.
[11] Rebiai A., Lanez T., Belfar M.L. Total polyphenol contents, radical scavenging and cyclic voltammetry of Algerian propolis. Int J Pharm Pharm Sci, 2014, 6 (1), 395-400.
[12] Belfar ML., Lanez T., Rebiai A., Ghiaba Z. Evaluation of Antioxidant Capacity of Propolis Collected in Various Areas of Algeria Using Electrochemical Techniques. Int. J. Electrochem. Sci., (2015), 10, 9641 – 9651.
[13] Tsuru .T, Haruyama .S, Gijutsu .B., J. Jpn. Soc. Corros. Eng. 27 (1978) 573.
[14] Ashassi-Sorkhabi .H, Asghari . E, J. Appl. Electrochem. 40 (2010) 631. [15] MetikosHukovic .M, Baic .R., Grubac .Z, J. Appl. Electrochem. 32 (2002) 35.
[16] Freres .SE,. Stefenel .MM, Mayer. C., Chierchie .T, J. Appl. Electrochem. 20 (1990) 996 [17] Brustein. GT, Cinderey .R, J. Corros. Sci. 32 (1991) 1195.
[18] Cinderey. RJ, Brustein .G.T, Corros. Sci. 33 (1992) 499.
[19] Ladha .D.G. , Wadhwani. P.M., Kumar .S, Shah .N.K , J. Mater. Environ. Sci. 6 (5) (2015) 1200-1209.
[20] Ogundele .G.I., White. W.E., Corros. Sci. 42 (1986) 71.
[21] Wang .D, Xiang. B, Liang. Y, Song .S, Corros. Sci. 85 (2014) 77-86.
[22] Shabani-nooshabadi .M, Sadat Hoseiny .F,Jafari .Y Green Approach to Corrosion Inhibition of Copper by the extract of Calligonum comosum in Strong Acidic Medium Metals & Materials Society and ASM International (2015), 46-293.
[23] Khadraoui .A, Khelifa.A, Hachama . K, Mehdaoui .R, Thymus algeriensis extract as a new eco-friendly corrosion inhibitor for 2024 aluminium alloy in 1 M HCl medium Journal of
Molecular Liquids 12, (2015) 064.
[24] Hachelef. H., Benmoussat. A,. Khelifa. A, Athmani. D, Bouchareb. D, Study of corrosion inhibition by Electrochemical Impedance Spectroscopy method of 5083 aluminum alloy in 1M HCl solution containing propolis extract J. Mater. Environ. Sci. 7 (5) (2016)1751-1758.
[25] Assunc.S. S, Pereiraa .A, Pegasa .M.M., Fernandeza .T.L,. Magalhaesa .M, Scho¨ntaga T.G., Lagob. D.C, Sennab L.F, E. Corros. Sci. 65 (2012) 360. 529.
[26] Abiolaa .O.K,. Jamesb .A.O, Corros. Sci. 52 (2010) 661.
[27] Bentiss. F., Bouanis. M, Mernari. B, Traisnel .M., Vezin .H., Lagrenee .M., Appl. Surf. 533 Sci. 253 (2007) 3696.
[28] Hoar. T.P, Holliday .R.D, The inhibition by quinolines and thioureas of the acid dissolution of mild steel J. Appl. Chem , 3( 1953) 502-513.
[29] Singh. D.N.N, Chaudhary .R.S,.prakash . B, Agawal .C.V, Corros. J.14 (1979) 2335. [30] Talati. J. D, Gandhi. D.K. N- hétérocyclic compounds as corrosion inhibition for aluminium- coper alloy in hydrochloric acid, Corros.Sci, 23 (1983) 1315- 1332.
[31] Laidler .K.J, Reaction Kinetics, vol. 1, 1st ed., Pergamon Press, New York, 1963p. 1 [32] Popova .A. Christov. M, Corros. Sci. 48 (2006) 3208.
[33] Lopez. D.A. Simison .S.N, De Sanchez .S.R, Electrochim. Acta 48 (2003) 845.
How to cite this article:
Hachelef H, Benmoussat A, Khelifa A, and Meziane M. Study of the propolis extract as a corrosion inhibitor of copper alloy in ethylene glycol / water 0.1 m NaCl. J. Fundam. Appl. Sci., 2016, 9(2), 650-668.