HAL Id: hal-00299482
https://hal.archives-ouvertes.fr/hal-00299482
Submitted on 21 Jan 2008
HAL is a multi-disciplinary open access
archive for the deposit and dissemination of
sci-entific research documents, whether they are
pub-lished or not. The documents may come from
teaching and research institutions in France or
abroad, or from public or private research centers.
L’archive ouverte pluridisciplinaire HAL, est
destinée au dépôt et à la diffusion de documents
scientifiques de niveau recherche, publiés ou non,
émanant des établissements d’enseignement et de
recherche français ou étrangers, des laboratoires
publics ou privés.
Finland during windstorm Gudrun
T. Soomere, A. Behrens, L. Tuomi, J. W. Nielsen
To cite this version:
T. Soomere, A. Behrens, L. Tuomi, J. W. Nielsen. Wave conditions in the Baltic Proper and in the
Gulf of Finland during windstorm Gudrun. Natural Hazards and Earth System Science, Copernicus
Publications on behalf of the European Geosciences Union, 2008, 8 (1), pp.37-46. �hal-00299482�
Nat. Hazards Earth Syst. Sci., 8, 37–46, 2008 www.nat-hazards-earth-syst-sci.net/8/37/2008/ © Author(s) 2008. This work is licensed under a Creative Commons License.
Natural Hazards
and Earth
System Sciences
Wave conditions in the Baltic Proper and in the Gulf of Finland
during windstorm Gudrun
T. Soomere1, A. Behrens2, L. Tuomi3, and J. W. Nielsen4
1Centre for Nonlinear Studies, Institute of Cybernetics at Tallinn University of Technology, Tallinn, Estonia 2Institute for Coastal Research, GKSS Forschungszentrum, Geesthacht, Germany
3Finnish Institute of Marine Research, Helsinki, Finland 4Danish Meteorological Institute, Copenhagen, Denmark
Received: 15 May 2007 – Revised: 27 September 2007 – Accepted: 10 December 2007 – Published: 21 January 2008
Abstract. Wave conditions in the northern Baltic Proper
dur-ing windstorm Erwin/Gudrun (January 2005) are analysed based on in situ measurements in three locations and out-put of operational wave models from the German Weather Forecast Service, the Danish Meteorological Institute and the Finnish Institute of Marine Research. The measured signifi-cant wave height reached 7.2 m in the northern Baltic Proper and 4.5 m in the Gulf of Finland. The roughest wave con-ditions, estimated from the comparison of the forecast and measured data, occurred remote from the sensors, off the coasts of Saaremaa and Latvia where the significant wave height was about 9.5 m. Peak periods exceeded 12 s in a large part of the northern Baltic Proper and in the central part of the Gulf of Finland.
1 Introduction
Windstorm Gudrun, an extratropical cyclone, also known as Erwin in Ireland, the United Kingdom and Central Eu-rope, attacked the northern Europe on 7–9 January 2005. It reached the power of a hurricane, according to the Saffir-Simpson hurricane scale (Saffir-Simpson and Riehl, 1981), in the North Sea region. In the Baltic Sea region it remained slightly below the hurricane level; however; it was one of the strongest in Denmark, Scandinavia and Estonia for at least 40 years. Note that the wind speed used for distinguishing the hurricanes in the United States is measured as the average over 1 min whereas the 10-min average is used in Europe. It caused widespread property damage and exceptionally high floods, and loss of 18 lives (Carpenter, 2005; Suursaar et al., 2006). Forest damage in Sweden was the largest ever re-ported in Sweden (Bengtsson and Nilsson, 2007). The storm cut down power supply in large areas of Sweden, Norway Correspondence to: T. Soomere
(soomere@cs.ioc.ee)
and the Baltic states. The highest storm surge in the known history (275 cm over the mean sea level) occurred in P¨arnu (Suursaar et al., 2006). New records of water level were es-tablished in many locations along the Western Estonian coast as well in the Gulf of Finland. The storm induced a major water inflow into the Gulf of Riga and flushed totally smaller shallow areas such as the Moonsund (V¨ainameri, an area be-tween Saaremaa, Hiiumaa and the Estonian mainland) with the water from the Baltic Proper. Particularly intense trans-port of bottom sediments apparently took place in certain parts of the sea (Suursaar et al., 2006). Several smaller har-bours suffered from massive damage and substantial beach destruction occurred at places (Orviku, 2006). The meteoro-logical conditions, details of accompanying flooding, and the reaction of water masses to this storm in Estonian coastal wa-ters are analysed in detail by Carpenter (2005) and Suursaar et al. (2006).
A major feature of this storm consisted in very rough wave conditions in the northern Baltic Proper and the Gulf of Finland. The combination of rough seas and extremely high water level eventually is the main reason for the extensive property damage in affected coastal areas. Since the network of wave measurements at the downwind side of the northern Baltic Sea (Fig. 1) only consisted of two directional waverid-ers operated by the Finnish Institute of Marine Research and one pressure-based recorder (while sea level was filed at about 20 sites), it is intuitively clear that the measured wave data only partially reflected the wave situation during this storm. The strongest winds (W-WSW) were oblique to the longest extension of the Baltic Proper (SSW-NNE) and occurred between Gotland and Saaremaa where the fetch is relatively short, in an area much southwards from the wave sensors. Even with these non-ideal conditions for wave generation (compared to a “perfect” storm steadily blowing along the axis of the Baltic Proper), very high and long waves were recorded.
Fig. 1. Wave measurement sites, marked by ⊗, in the Northern Baltic Proper, near Helsinki and at the Island of Naissaar.
The purpose of this paper is to estimate the roughest wave conditions during this storm based on available data. The analysis is based on wave measurements in the northern Baltic Proper (NBP) and the Gulf of Finland (GoF), and on the output of operational wave models in the leading oper-ational centres in the Baltic Sea area: the German Weather Forecast Service (DWD, Deutscher Wetterdienst), the Dan-ish Meteorological Institute (DMI), and the FinnDan-ish Institute of Marine Research (FIMR). The analysis is performed for the significant wave height but the peak periods are discussed to some extent as well.
To give an impression of extreme wave conditions and re-lated features of the local wave climate, we start from an overview of the existing wave data and numerical wave stud-ies in the NBP and the GoF. Operational wave modelling rou-tines for this area are described next. Further on, wave data from a buoy in the NBP and from two locations in the GoF are compared with modelled wave properties. Finally, we construct an estimate of the overall maximum wave height in this storm and discuss potential reasons of the excitation of high and long waves.
2 Wave climate in the northern Baltic Proper and the Gulf of Finland
Many Baltic Sea countries have performed extensive wave studies in the past and have implemented operational wave models nowadays. The longest instrumental wave measure-ments in the NBP have been carried out in 1978–2003 by the Swedish Meteorological and Hydrological Institute with the use of an inverted echo-sounder near a caisson lighthouse of Almagrundet (Fig. 1, M˚artensson and Bergdahl, 1987; Bro-man et al., 2006). Wave properties at this site are determined based on the classical zero-downcrossing method. An esti-mate of the significant wave height H1/3(defined as the
av-erage height of 1/3 of the highest waves) is found somewhat
non-traditionally from the 10th highest wave in a record of about 10 min once an hour under the assumption that the wave heights are Rayleigh distributed. Note that contem-porary measurement devices and spectral wave models use another estimate of the significant wave height HS≈H1/3
de-fined as the fourfold variance of the water surface. The high-est H1/3=7.82 occurred at this site in January 1984
(Bro-man et al., 2006, Kahma et al., 2003 mention the value
HS=7.7 m) whereas the mean period (which generally is by
10–20% smaller than the peak period) reached 11 s. This is formally the largest significant wave height ever recorded in the NBP. This storm is the only one recorded at this site when
H1/3≥7 m was registered.
Directional wave properties in the central part of the NBP (buoy 1 in Fig. 1, 59◦15′N, 21◦00′E, water depth about 100 m) have been measured by the FIMR starting from September 1996 excluding ice seasons. The measurement routine and an overview of wave statistics (occasionally in-volving observations at Almagrundet and at some other lo-cations) are presented by Kahma et al. (2003). The highest waves with HS=7.7 m were recorded on 22 December 2004
at this location. The significant wave height has exceeded 7 m only four times at this site: twice in December 1999 and twice within three weeks – on 22 December 2004 (when the largest single wave ever recorded in the NBP has been reg-istered with a height of 14 m) and on 9 January 2005 during windstorm Gudrun. The peak periods during these events slightly exceeded 12 s.
High-quality wave data sets have been measured by the FIMR starting from 1970s in areas surrounding Finland (Kahma et al., 1983; Kahma and Pettersson, 1993; Pettersson 1994; Pettersson, 2001; Kahma et al., 2003). A directional waverider is deployed off Helsinki in the GoF (Fig. 1, 59◦
57.9′N, 25◦14.1′E, water depth about 60 m, below referred to as buoy 2). The measurements have been made in 1990– 1991, 1994 and from November 2001 during the ice-free sea-sons. The highest HS=5.2 m in the GoF was measured at
this site in November 2001 (Pettersson and Boman, 2002; Soomere, 2005). The peak periods reached 11 s during this event. Practically no data are available from the coastal areas of Estonia and Latvia except for visual observations from the coast (Soomere and Zaitseva, 2007) and for sporadic mea-surements with the use of pressure sensors (Soomere, 2005). The third generation wave models (e.g. Komen et al., 1994) adequately represent the sea state in the northern Baltic Sea (e.g. Tuomi et al., 1999). Several numerical wave stud-ies have been performed for the southern part of the Baltic Sea (e.g. Gayer et al., 1995; Blomgren et al., 2001) or for limited areas of the northern Baltic Proper (Soomere, 2001; 2003) during the last decade. Recently, wave statistics for the Baltic Proper has been estimated with the use of the second-generation spectral wave model HYPAS and wind data from 1999–2000 (J¨onsson et al., 2002; 2005). The spatial distri-bution of wave heights follows the local anisotropy of the wind and wave regime in the Baltic Proper (Soomere, 2003).
T. Soomere et al.: Wave conditions in the Baltic Sea during windstorm Gudrun 39
Statistically, the regions of the largest wave activity are found along the eastern coasts of the Baltic Proper. These areas are characterised by long fetches for the dominant winds. The quantitative features of the results in (J¨onsson et al., 2002; 2005), however, may differ from the factual ones, because these studies do not account for ice cover in a part of the northern Baltic Sea during the season that statistically con-tains the highest wind speeds.
A number of studies are concentrated on specific problems of the Baltic Sea wave fields such as multi-peaked wave spec-tra (Kahma, 1981), wave energy problems (M˚artensson and Bergdahl, 1987), possible changes of wave climate caused by changes of storminess (WASA Group, 1995), methods of es-timates of wave climate (Mietus and von Storch, 1997), the persistence of wave statistics (Boukhanovsky et al., 1999), or wave climate in small semi-enclosed basins (Soomere, 2005). However, no comprehensive description of the wave climate or statistical estimates of extreme wave conditions exists in the whole Baltic Proper. Older publications such as Rzheplinsky and Brekhovskikh (1967) are obsolete. The books published in the former Soviet Union (e.g. Davidan et al., 1985) contained valuable measured wave data but were available only in Russian language.
3 Operational wave models in the DWD, FIMR and DMI
All the listed operational centres run the third generation spectral wave model WAM cycle 4 (Komen et al., 1994) on a regular rectangular or spherical grid in shallow wa-ter mode without data assimilation. The models use differ-ent sources of wind information and their land-sea masks, bathymetry, computational grid, spatial and temporal resolu-tion, and spectral range are different (She and Nielsen, 1999; Soomere et al., 2004).
The regional spectral wave model LSM (Local Sea Wave Model) is used in the DWD for an area including the North Sea, the Baltic and the Adriatic Sea since 1999. Wave conditions in the Baltic Sea are independent on the sea state in other model areas. The LSM mesh size is 1/10◦along latitudes and 1/6◦along longitudes. The FIMR runs the wind and wave models for the Baltic Sea area with a 1/5◦×1/5◦ resolution along since November 2001 (J¨arvenoja and Tuomi, 2002). The resolution was increased to 0.08◦×0.08◦ just before the storm in question, from November 2004. The DMI runs since 1999 the WAM model for the North Sea and the Baltic Sea in 1/6◦×1/6◦resolution.
A nested model, with 1/30◦×1/30◦resolution, is applied in
the nearby Danish waters; however, no feedback from the fine model is used in the coarse model runs.
All the models are driven by forecast winds at the standard height of 10 m above the surface level. The LSM wave model uses three-hourly wind fields provided by the atmospheric model LM of the DWD with a mesh size of 1/16◦×1/16◦.
The DMI and FIMR wave models use hourly wind data from different versions of the atmospheric model HIRLAM: the DMI-HIRLAM (horizontal resolution of 1/20◦×1/20◦),
and the Finnish Meteorological Institute’s HIRLAM version 6.2.1 (horizontal resolution of 0.08◦×0.08◦).
The WAM model calculates the two-dimensional wave en-ergy density spectrum at each sea point for a set of equally spaced directions and logarithmically spaced frequencies. The LSM and FIMR models use 24 directions (i.e. direc-tional resolution is 15◦) whereas the DMI model uses 12 di-rections (resolution 30◦). The spectral directions of all the models are shifted away from the major compass directions. The LSM and DMI models employ 25 frequency bands from 0.04177 to 0.41145 Hz (periods from about 2 to 20 s) in 10% steps. The FIMR model uses an extended range of 35 bands up to 1.073 Hz in order to better describe shorter waves in sub-basins of the Baltic Sea.
The LSM and the FIMR models account for sea ice (areas covered by ice are coded as land) while the DMI model does not. For the storm in question this feature of the models is irrelevant, because sea ice only existed in Bothnian Bay in the area that does not influence wave fields in the NBP or in the GoF. The depth information and the land-sea mask of the LSM model are optimised for the concurrent use with a cir-culation model. In some northern parts of the Baltic Sea they do not exactly follow the factual coastline. For example, the area of P¨arnu Bay is not represented in the model grid and the eastern part of the GoF is by and large sheltered from waves propagating from the NBP. The FIMR model accounts for special features of the northern Baltic Sea. The archipelago area between ˚Aland and the Finnish mainland is handled by coding this area as impassable for waves. The irregu-larities of the shoreline and sheltering islands are accounted for by an appropriate choice of the model shoreline. The depth map of the DMI model is sampled from the ETOPO5 bathymetry map of the National Geophysical Data Centre (http://www.ngdc.noaa.gov/mgg/global/global.html) with an imposed minimum depth of 5 m.
The LSM model provided operational forecasts for 48 h twice a day in January 2005. The DMI and FIMR models were run four times a day with a 54 h forecast length. The output of these models is called modelled wave data below. After each forecast cycle, the most important parameters of the sea state such as the significant wave height of the en-tire wave field, the significant wave height, the peak period and the wave direction for both windsea and swell, and op-tionally the mean period, and the components of the driving wind fields (wind speed, wind direction) were stored for all sea points three-hourly for the LSM and the FIMR model, and hourly for the DMI model. Spectral information was only saved for selected sea points in the FIMR model. The peak period TP used in comparisons below is the 1 D peak
of the directionally integrated spectrum which is equivalent to the peak period estimated by the waveriders and from the pressure data.
Fig. 2. Modelled wind speed (m/s) and direction (arrows) 10 m above water surface at 06:00 GMT on 9 January in the DMI 54-hour forecast valid at 00:00 GMT on 9 January.
Fig. 3. Modelled significant wave height HS(m) and wave prop-agation direction (arrows) at 06:00 GMT on 9 January in the DMI forecast valid at 00:00 GMT on 9 January.
To match the factual temporal resolution of all the models, comparisons are made for three-hourly wave data at 00:00, 03:00 GMT etc. at which the wave data of FIMR and the LSM models are saved. As the observation times at buoys 2 and 3 not necessarily coincide with the model output times and have certain gaps, we use the average values of the avail-able wave data and of the DMI model output during ±1.5 h around these time instants.
To the knowledge of the authors, no systematic validation of the models’ results against measured data in the northern Baltic Sea have been reported in international literature al-though there is acute need for such analysis. The available information suggests that, at least in typical wave conditions, all the listed models show reasonable performance. For ex-ample, comparison of the DMI model with satellite data re-vealed that the overall bias and standard deviation of the sig-nificant wave height in the North Atlantic and the Baltic Sea was 0.13 m (the model tended to slightly overestimate the wave heights) and 0.56 m, respectively during July 2004– March 2005 (http://ocean.dmi.dk/validations/waves/satellite/ sat valid.uk.php). The mean relative error of the forecast of the maximum wave height in the 5 strongest storms is about 15% for 13 buoys operated by the DMI in the Baltic Sea and in the North Atlantic (http://ocean.dmi.dk/validations/waves/ resultat/index.uk.php). The DWD model shows an equiva-lent performance. For example, the monthly bias and stan-dard deviation in February 2003 were from −0.27 to 0.32 cm and from 0.3 to 0.71 m, respectively, in 12 different buoy lo-cations. The presented estimates well match the standard de-viation of the forecast from the observed wave heights during the stormy week 7–14 January 2005 at the locations of buoys 1 and 2 (Table 1) and the relative error of the forecast of the maximum wave height during the storm maximum (see be-low). The reasons of somewhat larger deviations of the fore-cast from the observed wave heights for the location of buoy 3 are discussed below.
4 Observed and modelled wave properties in the Baltic Proper
Several features of wind patterns are interesting from the viewpoint of wave generation. Since the coastal data suf-fered from failures of equipment (Suursaar et al., 2006), we shortly describe the modelled wind properties. The maxi-mum wind speeds on the open sea, according to the DWD and the DMI (Fig. 2), were 28–29 m/s between Gotland and Saaremaa (cf. coastal data in Suursaar et al., 2006). Wind blew from W in the central Baltic Proper, from WSW in the Gulf of Riga, and from W–NWN in the northernmost part of the Baltic Proper during the wave storm maximum, and thus a convergent wind pattern occurred. All forecasts sug-gested that strong wind was to blow during many hours. The forecasts released on 6–7 January predicted the highest wind speeds to occur along the Norrk¨oping–Hiiumaa/Saaremaa line. The significant wave height was forecast to exceed 10 m at buoy 1, to reach 11–12 m at the entrance of the GoF, and to be over 6 m in the central part of this gulf. Such wave conditions would have been rougher than during any other storm in the northern Baltic Sea in the history of contempo-rary shipping (K. Kahma, personal communication on 8 Jan-uary 2005).
T. Soomere et al.: Wave conditions in the Baltic Sea during windstorm Gudrun 41
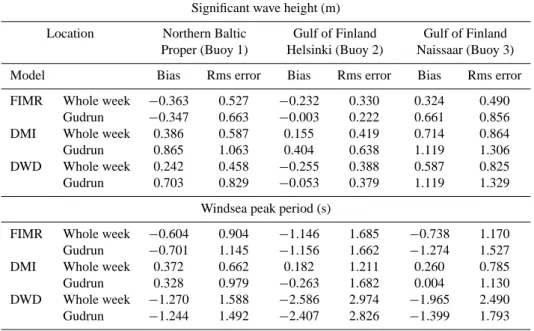
Table 1. Comparison of modelled and observed significant wave height HSand peak period TPduring windstorm Gudrun (from 12:00 GMT on 08 January to 24:00 GMT on 09 January) and during the stormy week 7–14 January 2005 (until 06:00 GMT on 12 January at buoy 2, and from 08:00 GMT on 8 January at buoy 3) in terms the bias (model – observed) and root-mean-square (rms) error.
Significant wave height (m)
Location Northern Baltic Gulf of Finland Gulf of Finland Proper (Buoy 1) Helsinki (Buoy 2) Naissaar (Buoy 3)
Model Bias Rms error Bias Rms error Bias Rms error
FIMR Whole week −0.363 0.527 −0.232 0.330 0.324 0.490 Gudrun −0.347 0.663 −0.003 0.222 0.661 0.856 DMI Whole week 0.386 0.587 0.155 0.419 0.714 0.864
Gudrun 0.865 1.063 0.404 0.638 1.119 1.306
DWD Whole week 0.242 0.458 −0.255 0.388 0.587 0.825
Gudrun 0.703 0.829 −0.053 0.379 1.119 1.329
Windsea peak period (s)
FIMR Whole week −0.604 0.904 −1.146 1.685 −0.738 1.170 Gudrun −0.701 1.145 −1.156 1.662 −1.274 1.527 DMI Whole week 0.372 0.662 0.182 1.211 0.260 0.785
Gudrun 0.328 0.979 −0.263 1.682 0.004 1.130
DWD Whole week −1.270 1.588 −2.586 2.974 −1.965 2.490 Gudrun −1.244 1.492 −2.407 2.826 −1.399 1.793
The low pressure area, in fact, propagated less northwards after crossing Norway and Sweden (Carpenter, 2005, see also analysis of the path of the cyclone and of the strongest winds in Suursaar et al., 2006, or (http://www.emhi.ee/index.php? ide=2&shownews=18). The area with the largest modelled wind speeds crossed Gotland, the northern part of Latvia and the Gulf of Riga, southwards from the location of buoy 1. The highest waves were excited off Saaremaa and Latvia (Fig. 3).
The measured wave heights did not establish any new records. The significant wave height at buoy 1 reached
HS=7.2 m at 03:00 and 07:00 GMT on 9 January (Fig. 4).
The wave height was about 7 m during about 12 h (00:00– 11:00 GMT). The FIMR model well matched the roughest wave conditions in the early morning of 9 January (Fig. 4a, Table 1). The overall maximum of HS was overestimated
by 0.44 m (5.8%). The wave storm decayed somewhat more slowly than suggested by the model. The FIMR model also underestimated by about 1 m (about 20%) the wave height on 13 January. The models of the DWD and the DMI to some extent overestimated the wave heights during the whole stormy week (Table 1). The largest error (1.29 m and 1.91 m) of the instantaneous wave height occurred during a short time interval when the modelled wave height reached its maxi-mum but the factual wave heights dropped by about 0.6 m. The error of the modelled overall maximum wave height (8.17 and 8.96 m) was 12.4% and 20.1%, respectively, for the DWD and DMI models.
The windsea peak period TP at buoy 1 exceeded 10 s for
nearly 24 h and was about 11–12 s when the wave height was
close to 7 m (Fig. 4b). Both the DMI and the FIMR mod-els well reproduced its temporal behaviour (Fig 4b, Table 1). The period calculated by the DMI model behaved in a step-like manner, because no interpolation in space, time or in spectral space was done. The DWD model systematically un-derestimated the wave periods by 1–1.5 s. This feature also caused the large root-mean-square error of the peak period predictions. Notice that the overall performance of the mod-els during windstorm Gudrun is approximately the same as during the entire stormy week 7–14 January 2005 (Table 1). It is interesting to mention that the FIMR and the DWD mod-els almost perfectly reproduced the wave heights at buoy 2 specifically during Gudrun.
The modelled peak periods were somewhat higher, about 12–14 s, in the north-eastern part of the Baltic Proper during a long time. Since the wind direction in the Baltic Proper probably changed from south to west as the cyclone gradu-ally crossed the sea, a part of long waves in the north-eastern area of the Baltic Proper apparently were excited by more south-western winds in the early stage of the storm. Yet the above-described match between the observed and modelled peak periods at buoy 1 suggests that remarkably long and high waves eventually occurred in some sea areas.
5 Waves in the Gulf of Finland
Wave properties in the GoF were measured at two sites (Fig. 1). Off its southern coast, the Institute of Cybernetics used a domestic wave recorder (PTR Group) based on Keller
Fig. 4. (a) Significant wave height (m) and (b) peak period (s) at the location of the FIMR buoy 1 in the NBP (59◦15′N, 21◦00′E) as observed (blue) and modelled by the DWD (red), FIMR (green) and DMI (black).
pressure sensor and mounted about 8 m below the water sur-face, to record this event. The site (59◦37.1′N, 24◦29.1′E,
water depth about 14 m, below called buoy 3) is located north-westwards from the Island of Naissaar. The pressure data was recorded with a frequency of 4 Hz and analysed with the use of the classical procedure of establishing the sur-face wave properties from the pressure time series based on the linear wave theory (e.g. Stumbo et al., 1999). Wave prop-erties in record sections with duration of 20 min were calcu-lated from the truncated wave energy density. The waves with periods <3 s were ignored. For comparisons below the mean wave properties over 3-h time intervals are used.
The observed HS exceeded 4 m at 02:00 GMT on 9
Jan-uary and remained about 4 m during many hours (Fig. 5a). The maximum wave height (4.5 m, the second highest in-strumentally registered wave height in the central part of the GoF) occurred at 09:00 GMT on 9 January. Wave proper-ties at this site are not directly comparable with the
mod-elled data because the closest model grid point (in the FIMR model) is located in a much deeper area about 10 km from buoy 3. The reason is an unfortunate mismatch of the ge-ometry of the coastline and the mesh in the relatively low resolution of the operational model: the centre of the most seaward land point lies only slightly landward from the fac-tual coastline and from this temporary measurement site. Putting the grid points closer to the island in this resolution would lead to unrealistic fetches and unrealistic significant wave heights. Thus it is not unexpected that the modelled wave heights at the closest grid points did not match the ob-served values. Still all three models followed the measured sea state qualitatively. The FIMR model suggested the max-imum HS≈5.5 m and captured even the minor wave height
maximum at 02:00 GMT. For another wave storm on 13 Jan-uary it predicted somewhat earlier appearance of high waves. The DWD and DMI models predicted that the overall wave height maxima at this site were close to or even exceeding 6 m. The analysis below suggests that these values probably were not reached.
The observed peak periods exceeded 10 s during a large part of the 9 January at buoy 3 and were close to 12 s dur-ing about 10 h (Fig. 5b). Visual observations by one of the authors (TS) in the morning of 9 January from high cliffs of the peninsula of Pakri (located about 30 km south-eastwards from buoy 3) confirmed that the periods of the largest beach-ing waves were well over 10 s. The DMI wave model mostly captured this feature (Table 1). The FIMR model qualita-tively followed the temporal behaviour of TP but
underesti-mated by about 1 s the longest wave periods during Gudrun. The DWD model systematically underpredicted the peak pe-riods by 1.5–2 s.
The other wave measurement site (buoy 2) was located in the northern part of the GoF off Helsinki (59◦58.5′N, 25◦14′E). The FIMR operated a directional waverider at this site until 12 January. Since this site is more remote from the Baltic Proper than Naissaar, it is not unexpected that both the wave heights and peak periods were slightly smaller than at Naissaar (Fig. 6). The observed wave height was close to 4 m during a short time interval in the early morning of 9 Jan-uary and exceeded 3 m during the rest of the day. The FIMR and the DWD models well reproduced (but the DMI model somewhat overpredicted) the observed wave heights during the maximum of the wave storm.
The observed peak periods near Helsinki exceeded 10 s during nearly the whole day and reached 11–12 s at noon on 9 January (Fig. 6b). The modelled peak periods did not ex-ceed 9 s and generally were less than 8 s. The DMI model mostly captured the temporal behaviour of TP also at this site
(Table 1). The FIMR model underpredicted the peak periods by about 1 s and the DWD model by 2.5 s.
The occurrence of long and high waves in the interior of the GoF is an important feature of this storm. Early wave measurements have suggested that the peak periods in rough seas are 8–9 s and usually do not exceed 10 s in the GoF
T. Soomere et al.: Wave conditions in the Baltic Sea during windstorm Gudrun 43
Fig. 5. (a) Significant wave height (m) and (b) peak period at the location of buoy 3 near the Island of Naissaar in the Gulf of Finland (59◦37,1′N, 24◦29,1′E) as observed (blue, hourly mean values of peak periods are shown) and modelled by the DWD (red), FIMR (green) and DMI (black). Only observed periods clearly exceeding the threshold period (3 s) are shown.
(Kahma and Pettersson, 1993). More recent observations indicate that TP≈11 s may occur in this area (Pettersson,
2001). Yet the rough seas, with HS∼4 m, have peak
pe-riods of about 8–9 s. The number of observations of even larger peak periods is small: TP≈11 s were filed only three
times during measurements in 1990–1994 (probably during one storm) and occurred during a short time during another very strong storm in November 2001. The distribution of the frequency of occurrence of peak periods (Pettersson, 2001) suggests that TP≥10 s usually corresponds to penetration of
long-period swell of moderate height from the NBP to the GoF (cf. Broman et al., 2006).
The modelled maximum wind speed in the northernmost part of the Baltic Proper and at the entrance of the GoF was about 20–24 m/s during Gudrun (Fig. 2). In the gulf it appar-ently was well below 20 m/s during a large part of the storm (see also coastal data in Suursaar et al., 2006). The moderate water depth (50–80 m) of the western part of the gulf reduces
Fig. 6. (a) Significant wave height (m) and (b) peak period (s) near Helsinki as observed at the location of FIMR buoy 2 (blue) and modelled by the DWD (red), FIMR (green) and DMI (black). There is a gap in measured data at 15:30–21:30 on 9 January.
the celerity of long waves (which is about 20 m/s for deep water waves with periods about 12 s). Although transfer of energy of long waves to atmospheric motions (e.g. Kudryavt-sev and Makin, 2004) is generally quite small, one may as-sume that the wind was mostly faster than the dominating waves and such transfer was negligible in the GoF.
For such wind speeds the observed wave periods in the in-terior of the GoF were very large. Classical estimates of the wave growth in fetch-limited seas suggest that storms with a wind speed of about 20 m/s may excite peak periods about 12 s only if the fetch length is ≥600 km and the wind dura-tion ≥18 h (e.g. Rosenthal, 1986). Although recent growth curves (Kahma and Calkoen, 1992; Komen et al., 1994) sug-gest that somewhat shorter duration (about 15 h) and fetch (about 350 km) are sufficient for generation of such seas, it is probable that a portion of long waves stemming from the Baltic Proper contributed to the observed wave system in the GoF. Long waves propagating from the southern parts of the Baltic Proper are refracted by the coastal slope of Hiiumaa
(a large island northwards from Saaremaa) which turns them to the right and (for a certain combination of wave periods and propagation directions) may guide waves exactly into the gulf. This effect only works for waves approaching from SW because the archipelago north-westwards from the entrance of the GoF is almost impassable for waves.
6 Maximum of the wave storm
The above has shown that the wave storm maximum evi-dently occurred much southwards from buoy 1. The mod-elled wind speed had considerable North-South gradient (Fig. 2). There were quite large differences (up to 6% accord-ing to the DMI model) in the modelled wave heights at cer-tain adjacent grid points in the North-South direction in the NBP. This feature suggests that the wave field contained par-ticularly strong N-S gradients and that the overall maximum wave height apparently was larger than at the measurement site. For single sea points the forecast wave heights varied considerably as the new releases became available because of a certain deflection of the trajectory of the windstorm. Yet the forecast of the overall maximum wave height in the whole Baltic Sea showed a reasonable variation, for example, it was between 10.8 and 12.2 m according to the DMI model.
The overall maximum HS in the NBP and in the GoF
during this storm can be roughly estimated from a compari-son of the modelled spatial distributions of wave properties with the modelled and observed wave heights. It eventu-ally occurred off the coast of Saaremaa (Fig. 3) about 57◦N, 20.4◦E, that is, about 200 km south-eastwards from the
lo-cation of buoy 1. Assuming that (i) the wave models ade-quately represent the spatial patterns of wave properties and (ii) that the relative error of the modelled wave properties is roughly the same in the whole area of intense waves; the es-timate can be obtained by correcting the overall maximum of the modelled HS by the relative error of the model at the
measurement site. The results of doing so based on obser-vations in one point only should be interpreted as indicative: the accuracy of the forecast may vary in different parts of the Baltic Proper; especially in the case when the wind di-rection turns in the NBP as usually happens during strong cyclones. Yet this is a feasible way to estimate the maxi-mum wave heights during the storm given the limited data set. Since a large part of properties of the wave fields repre-sented in Figs. 4–6 are located within the ‘corridors’ formed by outputs of the three models, a reasonable estimate of this maximum eventually lies between the values defined by the three models. The above has shown that the discussed wave models reasonably followed the temporal behaviour of wave fields in the NBP. Their accuracy did not change much dur-ing the whole stormy week and matched the available error statistics. Thus the listed assumptions are sensible.
The FIMR wave model suggested that HS up to 10.2 m
occurred near Saaremaa on 9 January. Since it
overesti-mated the maximum of HS at buoy 1 by 5.8%, the
proba-ble maximum of HS was 9.6 m. The DMI model suggested
that HS=11.7 m occurred in the same area; accounting for its
overestimation at buoy 1 by 20.1% gives the probable max-imum of HS≈9.4 m. The DWD model predicted the overall
maximum of HS about 10.95 m on 9 January. At buoy 1 this
model gave maximum HS=8.17 m and the overestimation of
12.4%, respectively. The estimate for the overall maximum of HSin the Baltic Proper therefore is 9.6 m.
The relatively small scatter of the estimates suggests that the overall maximum of HSin the Baltic Proper during
wind-storm Gudrun most probably was about 9.5 m. The signifi-cant wave height eventually was well over 9 m in a consider-able part of the Baltic Proper. It is unlikely that the threshold of 10 m was exceeded.
Analogous reconstruction of the maximum wave height in the GoF is not straightforward. The site near Naissaar was located at a considerably smaller depth than the clos-est model point and it is not obvious how to account for shallow-water effects in this area with quite a complex ge-ometry and bathymetry. The FIMR deep-water measurement site off Helsinki offers a better ground for comparison. Ap-plication of the above-described procedure suggests that HS
slightly exceeded 5 m but most probably did not considerably exceed the historical maximum HS=5.2 m between Helsinki
and Tallinn.
7 Results and discussion
The strong reaction of the water surface to windstorm Gu-drun both in terms of sea level and high and long waves is the most interesting feature of this event, creating substantial hazards both onshore and offshore. The maximum sustained wind speed (about 29 m/s in the Baltic Proper) was large but not exceptional. Also, the modelled strongest wind direction (from the West) was not particularly favourable for wave gen-eration: the effective fetch was about a half of that for SW winds. Yet Gudrun excited very high and long waves. The central outcome of the above analysis is that that the overall maximum of HSevidently exceeded 9 m off coasts of
Saare-maa and Latvia and most probably was about 9.5 m in some areas. Such wave heights were unexpected based on the ex-isting wave statistics from the northern Baltic Proper.
It might be speculated that a future storm of the same strength and duration, but corresponding to more favourable wave generation conditions, may create even higher waves. Very high waves may occur in the NBP when a strong and large cyclone (that is able to create a practically homoge-neous wind field over the whole Baltic Proper for a long time) travels in the NNE direction. Since only a few cyclones do so (Suursaar et al., 2006), such a “perfect storm” is not likely to occur. However, if it would happen, it would contain a considerably longer fetch and probably would excite even rougher wave conditions at the entrance of the GoF and off
T. Soomere et al.: Wave conditions in the Baltic Sea during windstorm Gudrun 45
the south-western coast of Finland than Gudrun near Saare-maa.
It is not straightforward to identify which feature of Gu-drun is responsible for the generation of the above-described wave fields. As discussed in Sect. 4, the wind direction in the Baltic Proper apparently changed as the cyclone gradu-ally crossed the sea and a part of wave energy in the area of the roughest seas eventually was excited by more south-western winds corresponding to longer fetches. Also, the spatial distribution of the modelled wind speed (Fig. 2) sug-gests that, at least, during a certain time interval the wind field had a convergent pattern that also may result in wave energy concentration in some areas. For the pattern in Fig. 2 the highest waves eventually occur near Saaremaa. Notice that NW winds over the land archipelago visible in Fig. 2 insignificantly contribute to the wave field in the northern Baltic Proper, because most of the archipelago is practically impassable for waves.
The wind direction in a large part of Gudrun was oblique with respect to the axis of the Baltic Proper; thus so-called slanted fetch situation occurred (The SWAMP Group 1985, Ch. 8). If an oblique wind pattern persists during a long time, a system of long waves propagating along the coast-line emerges (Holthuijsen, 1983). At times it may form the main spectral peak. A frequently used explanation of this phenomenon is that the effective fetch for certain wave com-ponents in such conditions may be much longer than the downwind distance from the coast. This phenomenon ac-tually is supported by nonlinear interactions as well. It fre-quently occurs in the GoF (Kahma and Pettersson, 1994; Pet-tersson, 2004) in which a part of the dominating winds are slanted with respect to the coastline (Soomere and Keevallik, 2003). To the knowledge of the authors, this phenomenon has never been analysed in the Baltic Proper where the dom-inating winds mostly are aligned along the axis of the basin. Its contribution to the wave field is very similar to that of a convergent wind pattern.
Another interesting feature of windstorm Gudrun is that very long and high waves also appeared in the interior the GoF, an area which generally is somewhat sheltered from long waves excited in the Baltic Proper. It is debatable if they were excited by west wind in the NBP at the latitudes of the GoF or whether they represented a part of long waves ex-cited in the more southern areas of the Baltic Proper possibly by higher wind speeds over a longer fetch. The combination of such waves with uncommonly high water level is a prob-able reason for extensive damage to certain beaches, smaller harbours and jetties in sea areas where such long waves are uncommon (Orviku, 2006). For the above-described ‘perfect storm’ the direct excitation of a similar combination by wind in the inner part of the GoF is not likely, because the wind direction is largely different from the axis of the gulf. How-ever, topographic refraction may still redirect a part of waves approaching from SW into the gulf.
The comparison of modelled and observed wave data
shows that the basic features of wave fields during windstorm Gudrun as well as during the following stormy period were mostly well captured by operational wave models. They only tended to either somewhat overestimate the wave height or to underestimate the wave periods. An important feature is that the observed properties of the roughest windseas were gener-ally found between the values predicted by different models. Consequently, a “poor man’s ensemble modelling” (which can also be called consensus forecast) based on the compar-ison of predictions of different models and analysis of their performance in extreme conditions might give a reasonable forecast for the future storms. This forecast method is well known in meteorology where it is used for more exact deter-mining of particularly sensitive parameters such as the posi-tion or trajectory of tropical cyclones (Weber, 2005), or po-tential location of floods (Chowdhury, 2005), and where it has led to clear improvements of the forecast skill. Its appli-cation in the forecast of mostly wind-induced marine hazards such as extreme water levels and storm surges is straightfor-ward. The performed analysis suggests that this method is also applicable in predictions of hazardous wave conditions in cooperation of operational services.
Acknowledgements. This study has been mostly performed when
one of the authors (TS) was visiting the Institute for Coastal Research, GKSS Forschungszentrum, in the framework of the re-invitation programme of the Alexander von Humboldt Founda-tion. The work was financially supported by the Estonian Science Foundation (Grant 5762 and 7413), EU-supported INNOVE project 1.0101-0208, and Marie Curie RTN network SEAMOCS (MRTN-CT-2005-019374). The study was finalized when one of the authors (TS) was visiting the Centre of Mathematics for Applications, University of Oslo in the framework of the Marie Curie ToK project CENS-CMA (MC-TK-013909). The permission of the Marine Systems Institute to use their wave measurement device is gratefully acknowledged. The authors thank G. Gayer and the anonymous reviewers for useful comments and suggestions. Edited by: A. Mugnai
Reviewed by: two anonymous referees
References
Bengtsson, A., Nilsson, C.: Extreme value modelling of storm dam-age in Swedish forests, Nat. Hazards Earth Syst. Sci., 7, 515– 521, 2007,
http://www.nat-hazards-earth-syst-sci.net/7/515/2007/.
Blomgren, S., Larson, M., and Hanson, H.: Numerical modelling of the wave climate in the southern Baltic Sea, J. Coastal Res., 17, 342–352, 2001.
Boukhanovsky, A. V., Lavrenov, I. V., Lopatoukhin, L. J., Rozhkov, V. A., Divinsky B. V., Kos’yan, R. D., Ozhan, E., and Abdalla, S.: Persistence wave statistics for Black and Baltic seas, in: Pro-ceedings of the International MEDCOAST Conference on Wind and Wave Climate of the Mediterranean and the Black Sea, An-talya, Turkey, 9–13 November 1999, 199–210, 1999.
Broman, B., Hammarklint, T., Rannat, K., Soomere, T., and Vald-mann, A.: Trends and extremes of wave fields in the
eastern part of the Baltic Proper, Oceanologia, 48(S), 165–184, 2006.
Carpenter, G.: Windstorm Erwin/Gudrun – January 2005. Specialty Practice Briefing, Issue No 2., http://www.guycarp.com/portal/ extranet/pdf/Speciality Briefing 170105.pdf, 14 pp., 2005, last access: 9 December 2007.
Chowdhury, M. R.: Consensus seasonal Flood Forecasts and Warn-ing Response System (FFWRS): An alternate for nonstructural flood management in Bangladesh, Environ. Manage., 35, 716– 725, 2005.
Davidan, I. N., Lopatoukhin, L. I., Rozhkov, V. A.: Wind waves in the world oceans, Gidrometeoizdat, Leningrad, 256 pp. 1985. Gayer, G., G¨unther, H., and Winkel, N.: Wave climatology and
ex-treme value analysis for the Baltic Sea area off the Warnem¨unde harbour entrance, Deutsche Hydrographische Zeitschrift, 47, 109–130, 1995.
Holthuijsen L. H.: Observations of the directional distribution of ocean wave energy in fetch limited conditions, J. Phys. Oceanogr., 13, 191–207, 1983.
J¨arvenoja, T. and Tuomi, L.: Coupled atmosphere-wave model for FMI and FIMR, HIRLAM Newsletter, 40, 9–22, 2002.
J¨onsson, A., Broman, B., and Rahm, L.: Variations in the Baltic Sea wave fields, Ocean Eng., 30, 107–126, 2002.
J¨onsson, A., Danielsson, A., and Rahm, L.: Bottom type distribu-tion based on wave fricdistribu-tion velocity in the Baltic Sea, Cont. Shelf Res., 25, 419–435, 2005.
Kahma, K.: On two-peaked wave spectra, Finnish Marine Research, 248, 87–116, 1981.
Kahma, K. and Calkoen, C. J.: Reconciling discrepancies in the observed growth of wind-generated waves, J. Phys. Oceanogr., 22, 1389–1405, 1992.
Kahma, K. and Pettersson, H.: Wave statistics from the Gulf of Fin-land, Finnish Institute of Marine Research, Internal report 1/93, 27 pp., 1993.
Kahma, K. and Pettersson, H.: Wave growth in a narrow fetch ge-ometry, The Global Atmosphere and Ocean System, 2, 253–263, 1994.
Kahma, K., Pettersson, H., and Tuomi, L.: Scatter diagram wave statistics from the northern Baltic Sea, MERI – Report Series of the Finnish Institute of Marine Research, 49, 15–32, 2003. Kahma, K., Rantanen E., and Saarinen, J.: Wave data from the
southern Bothnian Sea 1973–1975, 1981. Finnish Institute of Marine Research, Internal report 1/83, 26 pp., 1983.
Komen, G. J., Cavaleri, L., Donelan, M., Hasselmann, K., Hassel-mann, S., and Janssen, P. A. E. M.: Dynamics and modelling of ocean waves, Cambridge University Press, Cambridge, 532 pp., 1994.
Kudryavtsev, V. N. and Makin, V. K.: Impact of swell on the ma-rine atmospheric boundary layer, J. Phys. Oceanogr. 34, 934– 949, 2004.
M˚artensson, N. and Bergdahl, L.: On the wave climate of the southern Baltic, Report series A15, Department of Hydraulics, Chalmers University of Technology, G¨oteborg, 63 pp., 1987. Mietus, M. and von Storch, H.: Reconstruction of the wave climate
in the Proper Baltic Basin, April 1947–March 1988, GKSS Re-port 97/E/28, Geesthacht, 30 pp., 1997.
Orviku, K.: Developmental ties between J¨arve-M¨andjala beach and Nasva harbour, Proc. Estonian Maritime Academy, 3, 7–18, 2006.
Pettersson, H.: Directional wave statistics from the southern Both-nian Sea 1992, Finnish Institute of Marine Research, Internal re-port 1994(5), 23 pp., 1994.
Pettersson, H.: Directional wave statistics from the Gulf of Fin-land 1990–1994, MERI – Report Series of the Finnish Institute of Marine Research, 44, 1–37, 2001.
Pettersson, H.: Wave growth in a narrow bay. PhD Thesis, Finnish Institute of Marine Research, Contributions no. 9, Helsinki, 33 pp. + 4 articles, 2004.
Pettersson, H. and Boman, H.: High waves and sea level during the November storm, in: Annual report 2001, Finnish Institute of Marine Research, Helsinki, 7, 2002.
Rosenthal, W.: Wind waves and swell, in: Oceanography, vol. 3C, edited by: S¨undermann, J., Landolt-B¨ornstein: Numerical Data and Functional Relationships in Science and Technology – New Series, Springer, 17–36, 1986.
Rzheplinsky, G. V. and Brekhovskikh, Y. P.: Wave atlas for Gulf of Finland, Gidrometeoizdat, Leningrad, 1967.
She, J. and Nielsen, J. W.: Operational Wave Forecasts Over Baltic and North Sea, Scientific Report 99-7, Danish Meteorological Institute, Copenhagen, Denmark, 1999.
Simpson, R. H. and Riehl, H.: The hurricane and its impact, Lou-siana State Univ. Press, Baton Rouge, 398 pp., 1981.
Soomere, T.: Wave regimes and anomalies off north-western Saare-maa Island, Proc. Estonian Acad. Sci. Eng., 7, 157–173, 2001. Soomere, T.: Anisotropy of wind and wave regimes in the Baltic
Proper, J. Sea Res., 49, 305–316, 2003.
Soomere, T.: Wind wave statistics in Tallinn Bay, Boreal Env. Res., 10, 103–118, 2005.
Soomere, T., Dick, S., G¨astgifvars, M., Huess, V., and Nielsen J. W.: Project plan for implementation of interfacing be-tween Baltic scale models to local (coastal area) models, http://www.boos.org/fileadmin/user upload/PAPA Reports/ PAPA ImplementationInterfacingBalticScaleToLocalModels. pdf, 22 pp., 2004, last access: 9 December 2007.
Soomere, T. and Keevallik, S.: Directional and extreme wind prop-erties in the Gulf of Finland, Proc. Estonian Acad. Sci. Eng., 9, 73–90, 2003.
Soomere, T. and Zaitseva, I.: Estimates of wave climate in the north-ern Baltic Proper derived from visual wave observations at Vil-sandi, Proc. Estonian Acad. Sci. Eng., 13, 48–64, 2007. Stumbo, S., Fox, K., Dvorak, F., and Elliot, L.: The prediction,
measurement, and analysis of wake wash from marine vessels, Marine Technol., 36, 248–260, 1999.
Suursaar, ¨U., Kullas, K., Otsmann, M., Saarem¨ae, I., Kuik, J., and Merilain M.: Cyclone Gudrun and modelling its hydrodynamic consequences in the Estonian coastal waters, Boreal Env. Res., 11, 143–159, 2006.
The SWAMP Group: Ocean wave modelling, Plenum Press, New York, 262 pp., 1985.
Tuomi, L., Pettersson, H., and Kahma, K.: Preliminary results from the WAM wave model forced by the mesoscale EUR-HIRLAM atmospheric model, MERI – Report series of the Finnish Institute of Marine Research 40, 19–23, 1999.
WASA Group: The WASA project: changing storm and wave cli-mate in the northeast Atlantic and adjacent seas? GKSS Report 96/E/61, Geesthacht, 1995.
Weber, H. C.: Probabilistic prediction of tropical cyclones, Part I: Position, Mon. Weather Rev., 133, 1840–1852, 2005.