HAL Id: hal-00806825
https://hal.archives-ouvertes.fr/hal-00806825
Submitted on 10 May 2021
HAL is a multi-disciplinary open access
archive for the deposit and dissemination of
sci-entific research documents, whether they are
pub-lished or not. The documents may come from
teaching and research institutions in France or
abroad, or from public or private research centers.
L’archive ouverte pluridisciplinaire HAL, est
destinée au dépôt et à la diffusion de documents
scientifiques de niveau recherche, publiés ou non,
émanant des établissements d’enseignement et de
recherche français ou étrangers, des laboratoires
publics ou privés.
Distributed under a Creative Commons Attribution| 4.0 International License
microphytobentos in a temperate estuarine
macro-intertidal bay.
F. Orvain, Sébastien Lefebvre, J. Montepini, M. Sébire, A. Gangnery, B.
Sylvand
To cite this version:
F. Orvain, Sébastien Lefebvre, J. Montepini, M. Sébire, A. Gangnery, et al.. Spatial and
tempo-ral interaction between sediment and microphytobentos in a temperate estuarine macro-intertidal
bay..
Marine Ecology Progress Series, Inter Research, 2012, 458 (ISSN: 0171-8630), pp.53-68.
�10.3354/meps09698�. �hal-00806825�
INTRODUCTION
The importance of describing spatial and temporal patterns of primary producers at the scale of an ecosystem is well recognised as a starting point in
ecological studies (Underwood et al. 2000). The main primary producers in estuarine ecosystems are phyto -plankton and microphytobenthos (MPB), which pro-vide a mixture of organic matter in the water column that is very variable in space and time (Underwood &
© Inter-Research 2012 · www.int-res.com *Email: [email protected]
Spatial and temporal interaction between sediment
and microphytobenthos in a temperate estuarine
macro-intertidal bay
F. Orvain
1, 2,*, S. Lefebvre
1, 3, J. Montepini
1, M. Sébire
1, A. Gangnery
4, B. Sylvand
5, 61Université de Caen Basse-Normandie − FRE3484 BIOMEA CNRS, Esplanade de la Paix, BP 5186, 14032 Caen Cedex, France 2CNRS, UMR 7208 BOREA, Muséum d’histoire Naturelle, CRESCO, 38 Rue du Port Blanc, 35800 Dinard, France
3Université de Lille1 Sciences et Technologies- CNRS, UMR 8187 Laboratoire d’Océanologie et Géosciences,
Station Marine de Wimereux, 28 Avenue Foch, 62930 Wimereux, France
4Ifremer-Laboratoire Ressources Halieutiques, Station de Port-en-Bessin, Avenue du Général de Gaulle,
14520 Port-en-Bessin, France
5GEMEL-Normandie, Station Marine de Luc-sur-Mer, B.P. 49, 54 rue du Dr Charcot, 14530 Luc-sur-Mer, France 6M2C-Morphodynamique Continentale et Côtière, 2-4 Rue des Tilleuls, Université de Caen, 14032 Caen Cedex, France
ABSTRACT: Intertidal flats of the estuarine macro-intertidal Baie des Veys (France) were investi-gated to identify spatial features of sediment and microphytobenthos (MPB) in April 2003. Gradi-ents occurred within the domain, and patches were identified close to vegetated areas or within the oyster-farming areas where calm physical conditions and biodeposition altered the sediment
and MPB landscapes. Spatial patterns of chl a content were explained primarily by the influence
of sediment features, while bed elevation and compaction brought only minor insights into MPB distribution regulation. The smaller size of MPB patches compared to silt patches revealed the interplay between physical structure defining the sediment landscape, the biotic patches that they contain, and that median grain-size is the most important parameter in explaining the spatial
pat-tern of MPB. Small-scale temporal dynamics of sediment chl a content and grain-size distribution
were surveyed in parallel during 2 periods of 14 d to detect tidal and seasonal variations. Our results showed a weak relationship between mud fraction and MPB biomass in March, and this relationship fully disappeared in July. Tidal exposure was the most important parameter in explaining the summer temporal dynamics of MPB. This study reveals the general importance of bed elevation and tidal exposure in muddy habitats and that silt content was a prime governing physical factor in winter. Biostabilisation processes seemed to behave only as secondary factors that could only amplify the initial silt accumulation in summer rather than primary factors explain-ing spatial or long-term trends of sediment changes.
KEY WORDS: Benthic diatoms · Benthos · Coastal ecosystems · Intertidal flats · Baie des Veys · Normandie · Spatial pattern · Geostatistics · Kriging
Kronkamp 1999, Perissinotto et al. 2003). Dynamics of marine systems vary widely in their temporal and spatial components due to complexity in the bentho-pelagic coupling (Zajac 2008). The trophic environ-ment of benthic fauna in these systems is therefore characterised by a high degree of spatial hetero-geneity, such as transition zones and patches (Dee-gan & Garritt 1997, Dubois et al. 2007) that are related to the landscape of their habitats. It appears very relevant to understand the spatial patterns of primary producers in relation to sediment in order to elucidate the role they play in the trophic food web and to assess the respective contributions of both components to consumer’s diet (Lefebvre et al. 2009). The questions of spatial distribution of benthic pri-mary producer are thus critical to gain new insights in the dynamics and structure of macrozoobenthos that inhabit these environments (Herman et al. 2000). There is a general consensus that MPB biomass varies along wide-scale environmental gradients and is not affected by an isolated variable but, rather, depends on a combination of factors controlling the physical and biological conditions in the sediment. Those factors creare spatial stucture in MPB according to exposure gradients such as bathymetry, sediment grain-size, deposit-feeders, or sediment nutrient stocks (Jesus et al. 2009). The environmental factor thought to influence the spatial variability of MPB assemblages to the greatest extent is the nature of substratum (Underwood & Kronkamp 1999). There is a vast body of literature on field studies about MPB. Some of these studies focus specifically on the rela-tionship between sediment and MPB (Admiraal & Peletier 1980, Jesus et al. 2009, van der Wal et al. 2010) and most especially on the spatio-temporal dynamics of this relationship, which is often partly obscured by other co-varying factors that also regulate MPB distribution (e.g. topography, compaction and water con -stitution, nutrient availability, vegetation fields and macro zoobenthos). There is also a critical need to assess the temporal dynamics of these sediment land-scapes since temporal features, such as seasonality or storm events can intensively alter the spatial configu-ration of sediment in estuarine systems (de Jonge & von Beusekom 1995, van der Wal et al. 2010). As a result, benthic organisms are subjected to high levels of disturbances that affect their large-scale distribu-tion. Van der Wal et al. (2010) have shown that the sea-sonal patterns of MPB development in coastal and estuarine ecosystems are remarkably stable from one year to the next, underlining that bed elevation and tidal processes are implied in MPB development equi-librium than meteorological fluctuating variations.
Even though fine sediment and MPB are often con-sidered well-correlated in intertidal flats, these 2 variables have rarely been studied simultaneously at the scale of an entire bay (Admiraal & Peletier 1980, Jesus et al. 2009, van der Wal et al. 2010). This is cru-cial to understanding the structural stability of the landscapes of sediment and MPB organisms at dif -ferent types and frequencies of disturbances. It is sometimes difficult to obtain such temporal data over extensive geographic regions. Temporal mapping and analysis in a selected ecological landscape can at least provide some of this needed information and this strategy was applied in the present study. The purpose of the present study was to investigate the spatial and temporal relationships between sediment and MPB in an estuarine macro-intertidal bay. A comprehensive field of spatial measurements of MPB and sedimentary parameters was conducted by direct sampling over intertidal areas in April 2003. Geostatistical estimation methods were applied to produce variograms and kriging. To better under-stand the interplay between sediment and MPB, the spatial analysis was coupled with 2 small scale 14 d temporal surveys (July 2003 and March 2004) of the dynamics of MPB biomass and sediment in a selected location at the edge of a MPB patch.
MATERIALS AND METHODS Study area
The Baie des Veys is located in the western part of the Baie de Seine within the eastern English Channel (Fig. 1). It is directly connected to the sea and sub-jected to a high marine influence. Fine sand and coarse shell sand are historically the dominant type of sediment (Sylvand 1995). The tidal range of this macrotidal system during spring tide is about 8 m. The tidal regime is semi-diurnal and the synchro-nization between daytime exposure periods and solar noon occurs during neap tides. The bay
con-tains a total area of about 117 km2from which 37 km2
are intertidal flats, and current velocity can reach 3 m
s−1 during flood tide and 1.5 m s−1during ebb tide
(Dubois et al. 2007). The rivers Douve and Taute join together in the western Carentan Channel while 2 other rivers, Vire and Aure, converge to form the eastern Isigny Channel. These 2 channels separate the system into 3 sections from east to west: (1) Géfosses, where oyster farming covers an area of
about 3 km2with an approximate stock of 10 000 t of
sandy sediments at the lower shore and muddy sedi-ments at the upper shore, with vegetated areas at the highwater mark; and (3) Le Grand Veys with mussel farming at the north where sediment is sandy and the broadest saltmarsh of the system at the south, where the sediment is siltier (Fig. 1).
Sampling strategy for spatial patterns of sediment and MPB
Samples for MPB biomass analysis were collected over 5 d during spring tides from April 14 to 19, 2003. A systematic grid was extended over the entire map of intertidal areas and the sampling interval was 500 m. Furthermore, a nested spatial sampling design was applied to explore spatial aggregation
among smaller scales. More precisely, the do main
was divided into 3 nearly homogeneous sub-domains (separated by the 2 channels; Fig. 1). In each
sub-domain, the small-scale heterogeneity was in vesti
-gated by applying a criss-cross sampling as con-ducted by Guarini et al. (1998) in the Marennes-Oléron bay. A large grid with a systematic sampling design was deployed with a step of 500 m between neighbour sites and a second stratum of heterogene-ity was included with 3 smaller grids (in the shape of crosses with steps of 100 m between neighbour sites). These small scale crosses are especially important to develop a complete variogram accounting for auto-correlation at any distance from the minimum 100 m to the maximum 2500 m (i.e. half of the whole domain size). The estimation of variogram function at small distances and the quality of interpolation was opti-mised by estimating different semi-variogram func-tions for each sub-domain and to distinguish some Fig. 1. Location of (A) the Baie des Veys, (B) the sampled sites, showing the systematic sampling grid (small blue dots) and (C)
heterogeneity if necessary (see Figs. 2 & 4). The coor-dinates of the centres of each criss-cross grid were determined to match with observed muddy patches on the field before sampling. Among 175 defined grid nodes, only 138 sites were sampled, because other stations were never emerged or not accessible. Five 15 cm diameter cores were collected at each sampling site.
Sampling strategy for temporal patterns of sediment and MPB
The station is situated about 500 m from the bay mouth, at the west of the western Carentan channel in the Grand Veys area (49° 21’ 59’’ N, 01° 10’ 19’’ E). This location was selected at the edge of a muddy
patch with an intermediate level chl a biomass.
Sam-ples were collected during two 14 d periods (July 9 to 23, 2003 and March 8 to 22, 2004) in order to encom-pass complete neap/spring tide cycles. The field sampling was organised as a chessboard where we defined square sampling units (2 m side) separated by alleys (2 m in width). Every day, 3 squares were randomly selected to account for spatial heterogene-ity. Three cores were sampled within each square at 3 different time points: the beginning, middle, and end of exposure periods (an exposure period being defined as a diurnal emersion period).
Analyses of MPB biomass and sediment features
Sampling procedures followed the same protocol as for the spatial and temporal surveys. The upper-most 1 cm of the sediment cores was sliced in the field and kept frozen separately in plastic bags placed in a cooler (ca. 4°C in the dark) and rapidly brought back to the upper shore, where sediment mixing of each of the plastic bags was performed and a small aliquot of the mixed sample was taken and placed in 2 ml tubes, weighed and stored at −20°C (immediately since we installed a temporary field lab on the beach with a freezer). All frozen samples were brought back to the lab for further freeze-drying
before a new weighing prior to chl a extraction of a
given mass of dry sediment (~150 mg). MPB biomass was estimated by fluorometric quantification after extraction in 90% acetone in the dark overnight under constant agitation at 4°C; the chlorophyll extracts were measured on a Turner Designs TD 700
fluorometer following the method of Welsch meyer
(1994) and expressed as a content (µg g−1dry
sedi-ment [DW]). After the sedisedi-ment mixing on the shore, another aliquot was put in petri dishes for analyzing water content and sediment composition. These petri dishes were also placed immediately in the freezer and later brought back to the lab.
One replicate of sediment sample was selected for the analyses of sediment grain-size distribution. First, a wet sieve analysis was performed to collect the finest fraction. The sediment sample was gently mixed in freshwater, which was agitated with a brush to remove the salt and break the aggregates. Particles were sieved through a 40 µm mesh to retain the coarse fraction. The remainder of the sample was allowed to settle for 24 h, then the overlying liquid was decanted to leave behind the fine fraction, which was then dried for 36 h. The whole mass of sediment was also dried and subjected to a dry sieving. The final dry samples were screened with a set of 25 sieves in 2 columns (sieve shakers). The 12 coarsest sieves (ranging from 20 mm to 1 mm) were subjected to vibration for 5 min, whereas the 13 finest sieves (ranging from 0.8 to 0.04 mm) were vibrated for 15 min. The particles remaining on each sieve were col-lected and weighed on scales to the nearest mg. After multiplying by 1.3 (to convert from a grain-size of particles sieved on a squared mesh into an equivalent spherical grain-size), the weights recorded with each sample of sediment were used to draw up a curve giving the cumulative percentage mass correspond-ing to the fractions. The Wenworth grade scale was used to define each sediment type and the silt con-tent percentage (< 63 µm) was calculated at this step (Chamley 2000). Median and mean grain diameter were calculated from the sediment mass cumulative percentage.
Statistical analyses
The spatial autocorrelation was first analysed for chl a content, silt content, and median grain-size (for details of the methods and associated results see the Supplement at www.int-res.com/articles/suppl/ m458 p053_supp.pdf). Geostatistics were also applied on the spatial survey using 2 kriging methods: universal and ordinary kriging (Krige 1952, Journel & Huijbregts 1978, Legendre & Legendre 1998) (Fig. 2). Further-more, multiple regression tests were performed with
the software XLSTAT-2008 to compare the chl a
bio-mass to bathymetric level, water content, silt content, median and mean grain-size from the 87 stations of the 500 m large grid (these regression statistics were limited to the large grid data because data from the
smaller grid imply the interference of autocorrelation). The best regression model was searched to retain the most important factors that were linked to
the chl a biomass.
Concerning the temporal survey, Mantel analyses were performed (1) to detect the presence of inherent spatial autocorrelation and (2) to separate the effects of temporal variation (i.e. be-tween-day and within-day) from spatial effects. These non-parametric tests are most appropriate when data are spa-tially auto-correlated (Fortin & Gure-vitch 2001). A 4-matrix Mantel test was performed to examine the relationships between (1) the variable distance Matrix
A that contains the differences in chl a
biomass among the 3 × 15 = 45 sampled squares, (2) the distance Matrix B that contained the Euclidian spatial dis-tances among the 45 sites, and (3) 2 tem-poral distance matrices that contained the differences between all pairs of data in between-day (Matrix C) and within-day (Matrix D). The ana lysis was per-formed on the basis of normalized Man-tel statistics that assessed the effect of spatial factor, while the temporal factors were held constant (Fortin & Gurevitch 2001). The analysis of temporal effects was performed similarly (i.e. when spa-tial factors were holding constant). The
within-day ana lysis of the variation of
chl a biomass was done by using a split-plot ANOVA (the spatial effect being nested to the experiment time point). Pairwise Tukey’s HSD tests were per-formed to compare the bio mass between the 3 moments (Potvin 2001).
RESULTS
Spatial patterns of MPB biomass
The universal kriging provided the best interpolation in Grand Veys and Brévands while the ordinary kriging was the best fitted in Géfosses for MPB biomass (see the Supplement). The best MPB biomass map thus combined the 2 different kriging: universal in Brévands
0 500 1000 1500 2000 2500 0 500 1000 1500 2000 2500 0 500 1000 1500 2000 2500 1 1.5 0.5 0 2 1 0 –1 30 20 10 0 Distance (m) D) E) F) 0 500 1000 1500 2000 2500 0 0.5 1 0 500 1000 1500 2000 2500 0 0.5 0 500 1000 1500 2000 2500 0 0.5 1 Semi-variance Moran’s I Geary’s C Distance (m) A) B) C) Fig. 2. Str
uctural analysis of micr
ophytobenthic biomass (n = 138): (A–
C) autocor
re
lation functions of the log-transfor
med data for or dinar y kriging (n = 138); (D – F ) auto cor re
lation functions after r
e
moval of the drift (used for universal kriging). Cor
re
lograms (A,D: Gear
y’
s index; B,E: Moran’
s i
ndex) contain encir
cled points when
ther
e is a significant positive or negative autocor
re
lation (
α
= 0.05); (C) and (F) ar
e experimental semi-variograms (points) and best-fitted theor
etical models (dashed
lines). Separate cor
re
lograms and semi-variograms ar
e also computed in the nor
th
–
south (gr
ey squar
es) and east
–
west (gr
ey diamo
nds) dir
e
ctions (only computed
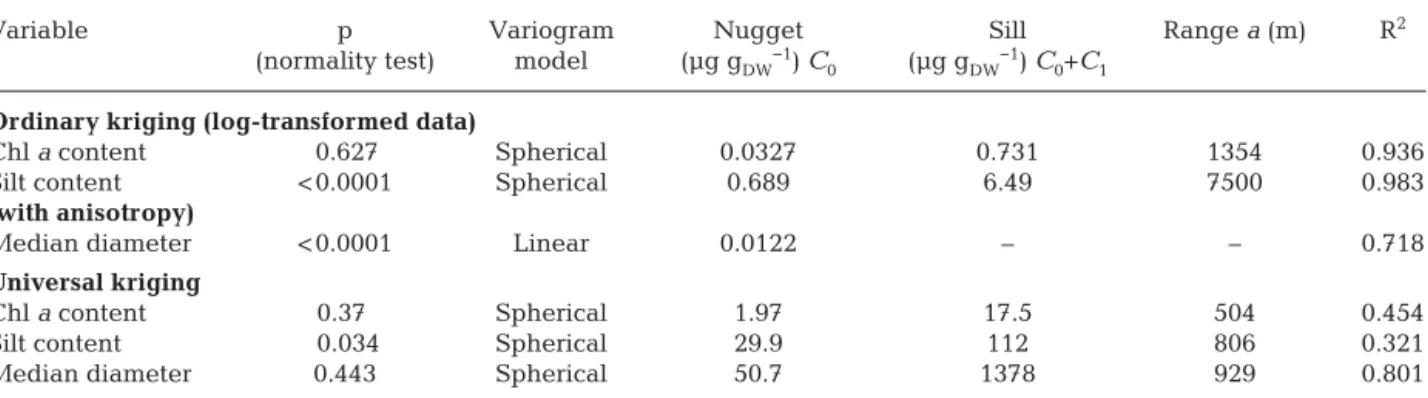
and Grand Veys and ordinary in Géfosses (Table 1). The averaged diameter of the MPB patches which was estimated by the range of the variogram model (universal method), was ca. 500 m (Table 2).
Gradi-ents were oriented in the north-south direction in the 2 western sectors (Grand Veys and Brévands; Fig. 3). The Brévands area was characterised by 2 main patches on the upper shore in the south and minimal values in the center of the bay in the north. Similar tendencies were found in Grand Veys with only one
main patch in the south. The highest values of chl a
were obtained close to the edge of the saltmarshes in these 2 sectors. In the eastern sector (Géfosses), there was a main patch at the center of the area (approxi-mately 500 m from the oyster-farms towards the
south) that extended to the north within
oyster-farming areas. The biomass of chla was within the
range of 0.5 to 20 µg gDW−1in Brévands, 1 to 35 µg
gDW−1in Gefosses, and 0.3 to 24.5 µg g
DW−1in Grand
Veys. The patch at the center of the Gefosses sub-domain was smaller than other patches but with the
maximal biomass of chl a of the whole bay (35 µg
gDW−1) and northern extension within oyster-farming
areas.
Note that chl a contents were not normalized by
surface (mg m−2) in the present study; although this is
usually done, and recommended to correct for com-paction affecting microalgae distribution (Perkins et al. 2003), we chose not to do so here due to the krig-ing results and especially to a stronger pellet effect for this variable.
Fig. 3. Kriged map of chl a biomass (µg per g dry weight
[DW] of sediment), combining both kriging methods as a function of the cross-validation results in each sub-domain: ordinary kriging was used for Géfosses and universal krig-ing was used for Brevand and Grand Veys (see Supplement)
Variable p Variogram Nugget Sill Range a (m) R2
(normality test) model (µg gDW−1) C
0 (µg gDW−1) C0+C1
Ordinary kriging (log-transformed data)
Chl a content 0.627 Spherical 0.0327 0.731 1354 0.936
Silt content < 0.0001 Spherical 0.689 6.49 7500 0.983
(with anisotropy)
Median diameter < 0.0001 Linear 0.0122 – – 0.718
Universal kriging
Chl a content 0.37. Spherical 1.97 17.5 504 0.454
Silt content 0.034 Spherical 29.9 112 806 0.321
Median diameter 0.443 Spherical 50.7 1378 929 0.801
Table 2. Variogram models with their parameter values and correlation coefficients (see Eqs. S4, S6 & S7 in the Supplement at www.int-res.com/articles/suppl/m458p053_supp.pdf)
Variable Universal Ordinary (with log transformation)
Brévands Grand Veys Géfosses Brévands Grand Veys Géfosses
Chl a content 0.835 0.783 0.683 0.728 0.658 0.733
Silt content 0.716 0.720 0.764 0.785 0.761 0.779
(with anisotropy)
Median diameter 0.827 0.817 0.755 0.830 0.814 0.736
Table 1. Goodness-of-fit of kriging methods analysed by the correlation coefficient between the measured variables (zi) in all
data points (n = 138) and the interpolated value ˆZ–iafter removal of the i th datum. The bold coefficients exhibit the best fits
Analysis of spatial patterns of sediment features
The spatial structure of the silt content was also clearly patchy but these patches were all anisotropic and located on the upper shores, creating a small gradient (Fig. 4). Ordinary method was used for kriging, with a spherical model and a low
nugget effect of 0.689. However, ani so
-tropy was well developed for silt content and was thus taken into account for the kriging interpolation (Table 2 and Supplement). The averaged diameter of the pat -ches can be estimated from the range of the variogram model (for the universal method), i.e. 800 m. The maps of the 3 sed-iment characteristics (Fig. 5) were in good agreement between each other in terms of sand distribution as well as localisation and size of muddy patches. The map of the sediment category exhibited muddy patches that were surrounded by wider structures of sandy sediments. Pure sand was found at the lower shores, and fine sands were the major sediment category in terms of surface covering, since 56% of the stations were characterised by a median grain size of > 200 µm and only 3% were characterised by < 63 µm. The sediment was particularly sandy at the north of the study area and between the 2 channels. Each sub-domain had at least one well-defined patch of silt. The main patch was found to the eastern edge of the Brévands vegetated areas with more than 70% silt (and a median grain-size of < 63 µm). The second muddy patch was located in Grand Veys with a maximal silt content of 47% and a minimal median diameter of 82 µm at the mouth of the Carentan channel, close to the other vegetated area of the bay. South of the oyster-farming struc-tures, the patch was smaller but very muddy (80% silt and a median grain size of 10 µm).
Temporal dynamics of sediment and MPB
The chl a data were significantly
af-fected by spatial effects during the July 2003 and March 2004 surveys (Mantel
0 500 1000 1500 2000 2500 0 500 1000 1500 2000 2500 0 500 1000 1500 2000 2500 0 1.5 0.5 1 0.5 0 –0.5 0 1000 3000 1 2000 0 500 1000 1500 2000 2500 0 500 1000 1500 2000 2500 0 500 1000 1500 2000 2500 0 0.5 1 –0.5 0 0.5 1 4 2 0 D) E) F) Semi-variance Moran’s I Geary’s C Distance (m) Distance (m) A) B) C) Fig. 4. Str
uctural analysis of (A–
C) silt content and (D
–
F) median grain size diameter
. Cor
re
lograms (A,D: Gear
y’
s index; B,E:
Moran’
s index) contain encir
cled points
when ther
e is a significant positive or negative autocor
re
lation (
α
= 0.05). (C) and (F) show experimental semi-variogram (points) and best-fitted theor
etical models
dashed
lines). For the median diameter
, the spherical model was best fitted without anisotr
opy
, but for the silt content, 2 cont
inuous lines wer
e fitted along the 2
perpen-dicular axes: nor
th
–
south (gr
ey dashed line) and east
–
west (black dashed line). Separate cor
re
lograms and
semi-variograms wer
e also computed in the nor
th
–
south
(squar
es) and east
–
west (diamonds) dir
e
ctions (only at the 3 lowest distances for the median diameter
, because ther
e was no ani
sotr
tests; p < 0.001). There was also significant variation
in chl a due to the 2 temporal factors (within-day and
between-day; p < 0.001). In summer, the pattern fol-lowed continuous variations with clear tendencies following the 14 d tidal cycle (Fig. 6). The category of sediment was always fine sand across the 2 sampled periods. During the first 8 days of the survey, there was only small and insignificant variation of the silt content. A higher degree of heterogeneity was regis-tered on 11 and 12 July, when the highest values of MPB biomass were registered (Fig. 6B). From 12 to 14 July, the sediment silt content decreased to its lowest level (17.5%). From 14 July, there was no vari-ation of silt content until 19 July, when a final small
increase oc curred. There was no rainfall re ported
during the low-tide temporal windows of the 2 sam-pled periods.
To refine the within-day variability of the summer sampling, an ANOVA re vealed that the increase in chl a was significant only during 2 exposure periods (p < 0.05): 13 and 18 July. Three increases (on 17, 18, and 21 March) and 2 decreases (11 and 14 March) were significant during exposure periods. Generally, these differences were significant between 2 consec-utive sampling times but not necessarily between the beginning and the end of the exposure period, high-lighting the non-linearity of the net production within one exposure period (Fig. 6).
The averaged (± SD) chl a biomass in July was 12.2
± 1.6 µg gDW−1. There was a 4 d increase from 12 to
15.5 µg gDW−1when shifting from neap tides to spring
tides (Fig. 6A). The maximal chl a biomass was
regis-tered on 11 July at the end of exposure period with a
value of 15.5 µg gDW−1. The classical scheme in which
biomass increases only during exposure time lags (Blanchard et al. 2001) was evident during this period. This period was then followed by a 6 d decrease in chl a biomass during spring tides, and a very low chl a
value of 11 µg gDW−1was registered at the end of this
period (Fig. 6A). Biomass diminished only during immersion periods, indicating the prevailing effects of physical factors that cause the resuspension of ben -thic diatoms and their exportation into the water col-umn. Nevertheless, there was still a net production of chla during exposure periods, as shown by the signif-icant increase reported on 13 July. Be tween 15 and 16 July there was a small deposition of silt, and these
de-posits were especially impoverished in chl a biomass
(Fig. 6A,B). The tidal coefficient was maximal at the
same time (Fig. 6C). A new release of chl a from the
sediment occurred during the spring tides of 19 and
20 July. The minimum chl a biomass of the summer
sampling was obtained on 20 July with a value of Fig. 5. Interpolated maps of (A) silt content built using
ordi-nary kriging with anisotropy, (B) median diameter built us-ing universal krigus-ing, and (C) sediment category (converted into a semi-qualitative discrete variable from 1 to 6 before
9.4 µg gDW−1. When the con ditions returned to a quiet
status (Fig. 6C) due to the new shift from spring tides to neap tides and low wind speed, there was a new
in-crease of chl a bio mass but during immersion periods
(Fig. 6A). This may be related to a deposition of sedi-ment between 18 and 19 July. These deposits were relatively en riched in resuspended benthic diatoms, probably corresponding to the redeposition of benthic diatoms being released from intertidal sediments of the upper shore. Conversely, decreases were reported during the exposure periods of the last 3 days but they were not significant (Fig. 6A).
There is evidence that MPB responds to the time exposure of the typical 14 d spring/neap cycle (neap tides being the conditions with the longest low-tide exposure periods around the maximum daylight) and to a lesser extent to resuspension/deposition
bal-ances. For instance, the minimum chl a biomass of
the summer sampling was obtained on 20 July after a
long period of resuspension of chl a. When the
condi-tions calmed due to the new shift from spring tides to neap tides and low wind speed, the temporal
varia-tions of chl a decreased during exposure periods of
the following 3 d, but these variations were not
sig-nificant. the temporal variation of chl a decreased
during exposure periods of the following 3 d, but these variations were not significant.. This period seemed to be a typical lag phase, providing the time for benthic diatom to settle, start migratory cycles, and initiate a new colonisation of sediment. In the field, the lag phase is not characterised by biomass remaining at a constant level without production (as in a mesocosm without macrofauna; Blanchard et al. 2001), but rather an equilibrium between losses and
gains of chl a biomass during exposure periods
because of several processes: (1) primary production (and its potential limitation by light, nutrient stocks or even desiccation); (2) the grazing effects by deposit-feeders; and (3) losses/gains during immer-sion due to eroimmer-sion outputs or sedimentation inputs. The consumption rate of benthic diatoms by deposit-feeders was especially high during the last 3 days of the summer survey, possibly because of an
increas-ing density of Hydrobia ulvae at the site during calm
Sampling day 0 20 40 60 80 100 W in d sp eed (m s –1 ) Tidal coef ficie n t 0 2 4 6 8 10 12 8 9 10 11 12 13 14 15 16 17 18 19 20 21 22 23 8 9 10 11 12 13 14 15 16 17 18 19 20 21 22 23 Silt c o n te n t (% ) 8 10 12 14 16 18 Ch l a cont e n t ( µ g g DW –1 ) 8 9 10 11 12 13 14 15 16 17 18 19 20 21 22 23 Beginning Middle End A) B) C) 10 20 30 40
Fig. 6. Temporal dynam-ics from 8 to 24 July 2003 of (A) the
microphyto-benthic biomass (chl a
content per g sediment dry weight [DW]), (B) silt content, and (C) wind speed (black lines) and tidal coefficient (grey line). Error bars are stan-dard deviation (n = 3)
conditions (low tidal coefficient and wind stress) that did not result in resuspension of these floating snails. In March 2004, the MPB biomass remained in a
lower range than in summer 2003 with a mean chl a
value of 8.80 ± 0.78 µg gDW−1, while the silt fraction
remained in the same order of magnitude between the 2 seasons. The pattern exhibited successive short
periods with rapid increases and decreases of chl a
biomass, with each period lasting only a few days (Fig. 7A). From 8 to 10 March, there was a
concomi-tant decrease of chl a biomass and silt content, with
the minimal values of the sampled period: 7.0 µg chl
a gDW−1and 16% silt in the sediment. This de crease
was then followed by a continuous increase of the 2 variables from 11 to 14 March during the neap tide (Fig. 7A,B). From 14 to 17 March, silt contents decreased from the maximal value of 27% to 18% and then remained relatively stable (ca. 20%). On 14
March, the chl a content was also subject to a small
drop followed by a significant net production of chl a
biomass during the subsequent low-tide exposure period (p < 0.05). For the 2 variables, the values increased again at the end of the survey with the
maximal value of 10.36 µg chl a gDW−1and 25% silt in
the sediment. During the following immersion
peri-ods, a drop was registered in chl a biomass between
the 17 and 18 March, probably due to the increasing tidal coefficient, since the wind speed was particu-larly low at this date (Fig. 7C). The silt content was
already low and it remained low while the chl a
con-tent decreased. Despite the recent resuspension,
there was another significant increase of chl a
bio-mass on 18 March. We assume that the biobio-mass was maintained to a level that enabled the benthic diatoms to support standing stocks able to produce. A deposition of silt was reported on 19 March and the silt content did not vary much over the following 2 d.
The chl a biomass followed the same kinetics as the
silt content from 18 to 21 March (Fig. 7A). After this
period, there was a significant net production of chl a
during the exposure period of 21 March. The last day of the survey was characterised by new deposition
of a small layer of silt but a low chl a biomass
(Fig. 7A,B).
Interaction between sediment and MPB
Generally speaking, there was a very good
agree-ment between the kriged maps of chl a and sediment
Beginning Middle End Tidal coefficient Sampling day 6 8 10 12 120 100 80 60 40 20 0 0 4 8 12 A) C) 8 9 10 11 12 13 14 15 16 17 18 19 20 21 8 9 10 11 12 13 14 15 16 17 18 19 20 21 8 9 10 11 12 13 14 15 16 17 18 19 20 21 Silt content (%) B) 10 20 30 Ch l a cont e n t ( µ g g DW –1) Wind speed (m s –1)
Fig. 7. Temporal dy-namics from 8 to 23 March 2004 of (A) microphytobenthic
biomass (chl a), (B)
silt content, and (C) wind speed (black lines) and tidal coef-ficient (grey line). Er-ror bars are standard
(Figs. 3 & 5). The level of correlation between chl a content and silt content was very high (R = 0.813), while a negative significant correlation was obtained
between chl a and median grain-size (R = −0.803).
The median grain-size was negatively correlated to all parameters except to the bathymetric level. Almost all variables were significantly correlated.
Among all variables, the chl a content was the one
the most strongly correlated to the bathymetric level (F1,136= 20.1, p < 0.001). A multiple stepwise linear regression was run with all abiotic variables together but with data from the main sampling grid (not including the second level of the criss-cross design).
The final model that better explained chl a content
(µg gDW−1) contained 3 variables (n = 87):
Chl a = 11.85 − 0.0545 Median + 0.153 Water + 0.58 Bathy
where ‘Bathy’ is the bathymetric level, ‘Water’ is the water content and ‘Median’ is the median grain size. This model explained 76% of the
vari-ability in chl a biomass; median grain-size ex
-plained 68.6 % of total variation, water content explained 5.1% and bathymetric level explained 2.25 %. The analysis of the dynamics revealed that
the temporal relationship between chl a biomass
and silt content was much more scattered than the spatial one (Fig. 8). Only a weak regression
coeffi-ciant was found in winter (re gression test: R2 =
0.106; F1, 85 = 9.9; p < 0.01). This regression
com-pletely disappeared when examining the
relation-ship between chl a concentration and sediment
composition. In winter, the range of chl a was
lower than in summer because of the windy
condi-tions and also the low level of primary production
that prevented chl a accumulation for long periods
(Fig. 8). Nevertheless, the silt content was in the same order of magnitude between the 2 seasons.
DISCUSSION
There is generally a positive interaction between diatom and mud accumulation (Yallop et al. 2000). Interactions of MPB communities with their environ-ment have traditionally been considered in the con-text of physical factors such as sediment characteris-tics, tidal inundation and exposure time, which are, in turn, determined largely by hydrodynamic pro-cesses and bed elevation (Paterson & Black 1999). The present paper clearly demonstrates that, in Baie des Veys, the sediment characteristics strongly ex -plain the spatial distribution of benthic diatoms, but bed elevation and desiccation/compaction (via the study of water content) constitute secondary factors that also ex plain a part of the total variability of the chl a biomass (expressed as µg gDW−1) in the spatial
survey. The importance of the interaction between sediment and MPB is confirmed by the high levels of
correlation between silt and chl a content spatial
pat-terns. Moreover, the median diameter of grain size is the first forcing variable explaining the variability of chl a content in multiple regression. This confirms the general idea that there is a cascade of processes with positive feedbacks amplifying the accumulation of mud and MPB cells within the same areas (van de Koppel et al. 2001). Conversely, in the Westerschelde estuary, van der Wal et al. (2010) found that bed ele-vation was the prime factor explaining MPB biomass, and silt content explained only some variations at a lesser degree. The difference with our observation could be related to the different proxy used for esti-mating MPB biomass since van der Wal et al. (2010) used satellite-derived normalized differential
vege-tation index data expressed in mg m−2 (closely
related to MPB biomass at the surface of the biofilm). We also found that bed elevation explained a part of the variability but only as a secondary factor after median grain-size. We emphasise that when using
the chl a concentration (in mg m−²) instead of chl a
content (in µg gDW−1), the conclusions remain the
same concerning the fac tors explaining the spatial
patterns of MPB biomass. The median diameter remained the primary factor explaining MPB
aggre-gation, but chl a content showed a significant
posi-tive correlation with percentage water content,
which did not occur when examining chl a
concen-Silt content (%) 0 5 10 15 20 25 0 5 10 15 20 25 30 35 40 Ch l a cont e n t ( µ g g DW –1 )
Fig. 8. Regression lines between microphytobenthic biomass
(chl a content per g sediment dry weight [DW]) and silt
con-tent in July 2003 (white squares; very weak relationship) and March 2004 (black circles; weak but significant
tration. This confirms the importance of sediment compaction affecting MPB biomass when expressed
in µg chl a gDW−1, as clearly demonstrated by Perkins
et al. (2003). We are aware that chl a concentration
is theoretically the best proxy for MPB biomass
(Perkins et al. 2003, Jesus et al. 2006), since chl a
con-centration is less subject to sediment compaction of mud particles, but we obtained better results with chl a content and a lower degree of error in terms of nugget effect, cross validation and mapped errors (data not shown). A significant part of the explained variability is also lost in the spatial regression
analy-sis when considering chl a concentration. This is also
the case when considering the temporal dynamics since standard errors represented 4.1% of the mean
value on average for chl a content but reached 4.3%
when examining chl a concentration, without
chang-ing the general story. This higher error of chl a
concentration implies a lower amount of accuracy when measuring the interstitial porewater content (and volumetric mass) in the sand/mud mixtures that dominate the sediment substratum of this bay. The increased accuracy ob tained by Perkins et al. (2003)
when converting chl a data to concentration could be
a specific feature of pure mud where the relation-ship between compaction and seawater percentage is more straightforward. During the spatial analysis fieldwork, the analysis of water content could be
biased be cause some samplings occurred at the
beginning of emersion periods, when sandy sedi-ments were sometimes still enriched in seawater. Other samples were taken from sediments that remained covered by seawater, because of the local topography. Fewer mistakes were committed when
expressing MPB biomass in chl a content.
The spatial distributions of MPB in Baie des Veys clearly exhibit patchy structures embedded in a gra-dient related to the distance from the sea. This is con-firmed by the necessity of applying universal kriging to disentangle the effects of wide-scale gradients from smaller patchy structures. The analysis of spa-tial patterns clearly shows that the upper shore is
characterised by a mosaic of chl a enriched muddy
patches that are defined by the geomorphological and topographic features around the channels and the proximity of nutrient inputs close to river mouths. In the lower parts of intertidal flats, we observed uni-form structures of sand and very low biomass of ben-thic diatoms. This is related to depth and tidal cur-rents, which are generally stronger in the lower parts of intertidal systems. The uniform distributions of sediment grain-size and biogenic variables that we found here clearly indicate the high importance of
tidal currents in determining the amplitude and extent of erosion rates and sand movements. On the upper shores, the muddy patches are not randomly distributed but rather accumulate in the areas where the local currents are affected by coastal protection. These structures thoroughly modify the current fields and the spatial patterns of embayment process. The effect of oyster-farm structures was especially clear since there was a need to apply ordinary kriging instead of universal kriging in the sector of Géfosses where oyster farms were installed. Indeed, the oyster farm in the centre of this sector leads to the develop-ment of a muddy patch of benthic diatoms sur-rounded by a uniform distribution of sandy sedi-ments with low MPB biomasses. The patch is located south of the oyster farm, i.e. in the zones which are protected from the dominant tidal currents (flow tides) by the oyster-farm structures. During the peri-ods of rapid changes of sediment landscape caused by recent human disturbances in the eastern part of the site (Gefosses in Fig. 3), the resulting spatial rearrangement of soft sediments is a factor determin-ing the colonisation by benthic diatoms in intertidal systems. Oyster farming creates physical structures that contain different physical and chemical proper-ties than surrounding sediments (Kervella et al. 2010). The spatial patterns of silt content directly reflect mechanisms that are inevitably associated with an increase of organic matter that stimulates mineralisation processes and nutrient cycling. The MPB cells (whose length ranges within the same spectrum of grain-size as silt) are able to settle with small particles during deposition processes and they find local conditions stimulating their growth. Oyster farms shape the landscape dynamics of intertidal sys-tems where human activities have modified the cur-rent fields (Kervella et al. 2010) and the spatial pat-terning of environmental factors profoundly alters the nature of species interactions and habitat occu -pation in several ways by favouring the development of MPB.
Hence, muddy sediments provide habitats favour-ing the development of epipelic diatoms. In these environments, they consist of epipelic raphid species endowed with endogenous migratory rhythms, which control their vertical movements across the sediment (Underwood & Kronkamp 1999). Extensive mats are produced during emersion periods where copious amounts of extracellular polymeric substances (EPS) are produced in relation to motility and/or nutrient limitation (Orvain et al. 2003). MPB is rarely affected by nutrient limitation (Jesus et al. 2009) because muddy sediments are enriched in organic matter and
the decomposition by bacteria in deep layers stimu-lates a very active mineralization of nutrients that constitute an essential part of MPB nutrition. More-over, the low energy of the tidal flow in these envi-ronments does not prevent MPB from reaching high biomass, especially in summer conditions (Blanchard et al. 2001). In the areas where the silt content is lower, species composition of MPB shifts from epipelic to epipsammic araphid and monoraphid taxa. These forms are mainly immobile and remain attached to sand particles by secreting EPS. Even though the high levels of light penetration in these sediments can induce high production rates, the bio-mass is likely to remain low because diatoms gather lower concentrations of nutrients in sand than in silt and experience high disturbance caused by resus-pension of sandy habitats. Van de Koppel et al. (2001)
demonstrated that the net growth of diatoms in
-creases with the silt content. We assume that these
processes can explain the positive interaction be
-tween silt and chl a and the resulting spatial patterns.
There are other factors that could be involved in the complex set of interactions between sediment and MPB to provide a general over view of the spatial patterns of MPB such as bathymetry or bed elevation (Guarini et al. 1998). In most estuarine systems, the MPB biomass is positively related to the bathymetric level (van der Wal et al. 2010) and this was the case also in Baie des Veys. Lower shore sediments are less stable than sediments at the upper shore due partly to the high energy of turbulent flow and the shorter emersion period. Consolidation and desiccation of sediments are therefore limited on the lower shore level and the duration of the illuminated periods is also reduced since light penetration is restricted in estuarine turbid waters during immersion periods. Under these conditions, the ability for MPB colonisa-tion is diminished. Conversely, the reduced disturbance and long photo synthetic periods create favour -able conditions for epipelic MPB at higher shore levels. Even though grain-size median diameter and water content better explain the distribution of MPB in Baie des Veys, it is remarkable that bathymetric
level is also well correlated with chl a, revealing that
the bed elevation can also explain some
heterogene-ity in chl a biomass that was not explained by
sedi-ment changes. The effects of bathymetry (and de
-pen dent parameters such as light availability or exposure time) seem limited and only involved as secondary sources of variation of MPB biomasses. The MPB could also be affected by top-down pro-cesses since consumption rates by benthic fauna are not homogeneously distributed over intertidal
mud-flats. The distribution of deposit feeders that actively forage for benthic diatoms at the surface (such as Hydrobia ulvae, Scrobicularia plana or Corophium volutator) must noticeably affect spatial patterns of MPB, while suspension-feeders that only benefit from these food items after resuspension must have a limited impact on these spatial patterns. For instance, the high biomass of benthic fauna, such as the bi
-valve Scrobicularia plana at the upper shore of the
Marennes-Oléron bay, plays a major role in regulat-ing MPB biomass at upper-shore levels (Orvain et al. 2007) and also partly explains why the peak in bio-mass is not found at the highest bathymetric level (Guarini et al. 1998). The biomasses of these species remain low in Baie des Veys with only small spatial variations (Sylvand 1995) and seem to be unable to modify the spatial structure of MPB.
The interaction between sediment and MPB is clearly regulated by seasonal effects. Indeed, the
re-lationship between silt accumulation and chl a
bio-mass is less straightforward when examining the temporal dynamics and was significant only in winter. On one hand, the strong hydrodynamical con-ditions in winter prevent MPB from developing a re-sponse to the solar exposure period, and we found a
positive relationship between silt and chl a contents
in March 2004 at the end of the winter (but also in the spatial study that was performed in April 2003, a pe-riod that could be considered as a transition pepe-riod between winter and spring), which revealed the prime influence of physical factors. On the other hand, the summer MPB dynamics were well devel-oped with a very noticeable effect of the 14 d tidal cycle in relation to the duration of the exposure period to solar daylight. Apparently, the calm condi-tions during the whole survey did not provoke mass ero sion of the sediments, since there was only small indentation in the silt fraction kinetics and a high
level of heterogeneity (especially when the chl a
biomasses are high). When conditions remain calm in summer, the MPB biofilm can become deve loped in response to solar exposure during low-tide periods, while silt content does not change much. More precisely, there were fluctuations in biomass with peaks at or just after the timing of emersion at noon (neap tides in Baie des Veys), revealing the in-fluence of the shift of the daylight and emersion time windows in 14 d cycles. The result of this shift was de-scribed by Blanchard et al. (2001, 2002) especially in summer, when MPB is more or less in a steady state with loss processes balancing gain processes.
The spatial interactions between diatoms and silt in the sediment can be explained by a bidirectional
interaction: (1) the first component of this interaction is described by the positive effects of silt accumula-tion on the development of MPB (van de Koppel et al. 2001) and (2) the second part of the interaction consists of the positive effects of MPB biofims on sediment stability, maintaining low erosion rates of sediment (Yallop et al. 2000). The first component of the interaction can explain the regulation of MPB biomass and primary production in winter, since there was a more significant relationship in winter, and the levels of EPS secretion when the MPB bio-mass remained relatively low cannot exert such a strong biostabilising effect. Windy conditions and low temperature both contribute to explain the low standing stocks of MPB in the sediments and the prime influence of hydrosedimentary exchanges, and especially resuspension, that can be indicated by decreases of the silt fraction. Moreover, the average diameter of the muddy patches is 800 m, while the diameter of MPB patches is 500 m. This confirms that the physical structures of soft sediments define the biogenic patch structure that they contain. Muddy patches thus provide habitats where benthic diatoms
are able to develop. The dynamics of chl a in winter
also show that initial changes are associated with silt accumulation and its positive effect on benthic dia -tom growth and resistance.
Biostabilisation processes can be considered as secondary factors amplifying the initial silt accumu-lation in summer rather than primary factors explain-ing the long-term trends of sediment changes. This confirms hydrosedimentary models by Le Hir et al. (2007) who argued that biostabilisation processes by MPB are unable to affect the morphology of mudflats because of the low biomass of MPB in winter (as observed in the present study). Biostabilisation by MPB seems especially ineffective in the present study, since even summer data deviates from this
theory. Indeed, the initiation of chl a decrease during
immersion (probably related to erosion) occurred just
after the peak in chl a biomass that was reported on
19 July 2003, whereas the tidal and wind conditions
were not especially strong at this time. This con
tradicts the biostabilisation theory since the well de
-veloped biofilm should better resist erosion if bio
-stabilisation influence was effective. In Marennes-Oléron bay, Blanchard et al. (2002) also observed that the initiation of erosion occurred after the peak in chl a biomass. At the same time, the low physical forcing made it difficult to explain the initiation of biofilm erosion. This result is in agreement with other find-ings that a thick biofilm of benthic diatoms can make the sediment exceptionally more susceptible to
ero-sion (Orvain et al. 2004). This could be explained either by a modification of the microrelief of sedi-ment due to bubble production in thick biofilms (these bubbles being able to disrupt the biofilm sur-face and produce lift forces), bacteria development, or high production rates of specific EPS that could retain interstitial water and increase bed erodability. Nevertheless, during the first 8 d of the summer sur-vey (Fig. 6), the biomass was holding steady during immersion periods, indicating the lack of resuspension of benthic diatoms. So during this period, bio -stabilisation could be effective, maybe in relation to biofilm growth or EPS secretion.
The chl a development is thus governed by
physi-cal factors with the prevailing influences of resus-pension/deposition processes in winter and solar exposure in summer. This is in agreement with the finding of Blanchard et al. (2001). Nevertheless, the short-term dynamic pattern of MPB biomass during the spring–neap tide cycle in the Baie des Veys did not completely follow the scheme described by Blan-chard et al. (2001) (i.e increasing during emersion and decreasing during immersion). Actually, a signif-icant resuspension-advection-redeposition mecha-nism can occur during immersion along with the clas-sical simple resuspension, resulting in a net increase of biomass during the immersion periods. The sam-pled station in the present study was located at the edge of a benthic diatom patch and the increase of chl a during immersion after spring tides may be the result of an extension of this patch. The size of the patch may vary between a minimum shape during spring tides and a maximal extension during neap tides in BDV. This observation is in agreement with the findings of Guarini et al. (1998) that the location of patches persists in time but the extent of the patch can vary with the season. We assume that this varia-tion of shape is also subject to the 14 d tidal cycle.
CONCLUSION
The Baie des Veys ecosystem is wide open to the sea and under the influence of intense oyster cultiva-tion producing a rapid silt deposicultiva-tion on intertidal flats. This ecosystem is thus submitted to drastic changes in terms of current fields and mud accumu-lation in oyster-farming habitats (Ropert & Dauvin 2000, Kervella et al. 2010). These sediments display a
patchy an isotropic structure of mud. Contrasting
with eco sys tems where the sediment is mainly mud-dominated (such as the Marennes-Oléron bay), the spatial patterns of MPB seem to typically reveal a
bottom-up control in the Baie des Veys with varia-tions of MPB biomass due to changes of the nature of substratum and prevailing effects of physical factors (bed elevation, wind stress, tidal currents, sediment compaction, solar and tidal exposure). The specific effect of rain has still to be investigated since there was no rainfall during our temporal sampling sur-veys. The positive influence of silt on benthic diatoms must be involved in the long-term trends in macro-zoobenthic community by increasing the trophic plas-ticity of the macrozoobenthic community, making possible the coexistence of a wide variety of different species in sediments surrounding oyster farms. How-ever, interaction between MPB and macrozoobenthos must be more thoroughly examined to verify (1) whether long-term MPB development is a factor favouring the trophic plasticity in these habitats (Dubois et al. 2007, Lefebvre et al. 2009) and (2) the long-term trends concerning macro zoobenthic assem-blage evolution (Timsit et al. 2004).
Acknowledgements. We are considerably indebted to 3
anonymous referees who greatly improved the manuscript by their comments. We sincerely thank all people who helped us during the field sampling: P. Claquin, I. Probert and M. Ropert. This study was partly funded by the program POMoyster (Direction Régionale de l’environnement Basse-Normandie, Agence de l’eau Seine Normandie and the European Fisheries Fund). Bathymetric level data were kindly provided by ‘Parc Régional des Marais du Cotentin et du Bessin’.
LITERATURE CITED
Admiraal W, Peletier H (1980) Influence of seasonal varia-tions of temperature and light on the growth rate of cul-tures and natural populations of intertidal diatoms. Mar Ecol Prog Ser 2: 35−43
Blanchard GF, Guarini JM, Orvain F, Sauriau PG (2001) Dynamic behaviour of benthic microalgal biomass in intertidal mudflat. J Exp Mar Biol Ecol 264: 85−100 Blanchard GF, Simon Bouhet B, Guarini JM (2002)
Proper-ties of the dynamics of intertidal microphytobenthic bio-mass. J Mar Biol Assoc UK 82: 1027−1028
Chamley H (2000) Bases de sédimentologie. Dunod, Paris de Jonge VN, van Beusekom JEE (1995) Wind- and tide-induced resuspension of sediment and microphytoben-thos from tidal flats in the Ems estuary. Limnol Oceanogr 40: 776−778
Deegan LA, Garritt RH (1997) Evidence for spatial varia -bility in estuarine food webs. Mar Ecol Prog Ser 147: 31−47
Dubois S, Orvain F, Marin-Léal JC, Ropert M, Lefebvre S (2007) Small-scale spatial variability of food partitioning between cultivated oysters and associated suspension-feeding species, as revealed by stable isotopes. Mar Ecol Prog Ser 336: 151−160
Fortin MJ, Gurevitch J (2001) Mantel tests: spatial structure in field experiments. In: Scheiner SM, Gurevitch J (eds)
Design and analysis of ecological experiments. Chapman & Hall, London, p 309−326
Guarini JM, Blanchard GF, Bacher C, Gros P and others (1998) Dynamics of spatial patterns of microphytobenthic biomass: inferences of geostatistical analysis of two com-prehensive surveys in Marennes-Oléron Bay (France). Mar Ecol Prog Ser 166: 131−141
Herman PMJ, Middelburg JJ, Widdows J, Lucas CH, Heip CHR (2000) Stable isotopes as trophic tracers: combin-ing field samplcombin-ing and manipulative labellcombin-ing of food re sources for macrobenthos. Mar Ecol Prog Ser 204: 79−92
Jesus B, Mendes CR, Brotas V, Paterson DM (2006) Effect of sediment type on microphytobenthos vertical distribu-tion: modeling the productive biomass and improving ground truth measurements. J Exp Mar Biol Ecol 332: 60–74
Jesus B, Brotas V, Ribeiro L, Mendes CR, Cartaxana P, Paterson DM (2009) Adaptations of microphytobenthos assemblages to sediment type and tidal position. Cont Shelf Res 29: 1624−1634
Journel AG, Huijbregts CJ (1978) Mining geostatistics. Academic Press, London
Kervella Y, Germain G, Gaurier B, Fack JV, Cayocca F, Lesueur P (2010) Experimental study of the near-field impact of an oyster table on the flow. Eur J Mech B Fluids 29: 32−42
Krige DG (1952) A statistical analysis of some of the bore-hole values in the Orange Free State goldfield. J Chem Metall Min Soc S Afr 53: 47−70
Le Hir P, Monbet Y, Orvain F (2007) Sediment erodability in sediment transport modelling: Can we account for biota effects? Cont Shelf Res 27: 1116−1142
Lefebvre S, Marin-Léal JC, Dubois S, Orvain F and others (2009) Seasonal dynamics of trophic relationships among co-occurring suspension-feeders in two shellfish cul-ture dominated ecosystems. Estuar Coast Shelf Sci 82: 415−425
Legendre P, Legendre L (1998) Numerical ecology (develop-ments in environmental modeling), 2nd edn, Vol 28. Elsevier Science, Amsterdam
Nelder JA, Mead R (1965) A simplex method for function minimization. Comput J 7: 308−313
Orvain F, Galois R, Barnard C, Sylvestre A, Blanchard G, Sauriau PG (2003) Carbohydrate production in relation
to microphytobenthic biofilm development: an
inte-grated approach in a tidal mesocosm. Microb Ecol 45: 237−251
Orvain F, Sauriau PG, Sygut A, Joassard L, Le Hir P (2004)
Interacting effects of Hydrobia ulvae bioturbation and
microphytobenthos on the erodibility of mudflat sedi-ments. Mar Ecol Prog Ser 278: 205−223
Orvain F, Sauriau PG, Le Hir P, Guillou G, Cann P, Paillard M (2007) Spatiotemporal variations in intertidal mudflat erodability: Marennes-Oléron Bay, Western France. Cont Shelf Res 27: 1153–1173
Paterson DM, Black KS (1999) Water flow, sediment dynam-ics and benthic biology. Adv Ecol Res 29: 156−181 Perissinotto R, Nozais C, Kibirige I, Anandraj A (2003)
Planktonic food webs and benthic–pelagic coupling in three South African temporarily-open estuaries. Acta Oecol 24: S307−316
Perkins RG, Honeywill C, Consalvey M, Austin HA, Tolhurst TJ, Paterson DM (2003) Changes in microphytobenthic
chlorophyll a and EPS resulting from sediment
com-➤
➤
➤
➤
➤
➤
➤
➤
➤
➤
➤
➤
➤
➤
➤
➤
➤
paction due to dewatering: opposing patterns in con -centration and content. Cont Shelf Res 23: 575−586 Potvin C (2001) ANOVA: experimental layout and analysis.
In: Scheiner SM, Gurevitch J (eds) Design and analysis of ecological experiments. Chapman & Hall, London, p 63−76
Ropert M, Dauvin JC (2000) Renewal and accumulation of aLanice conchilega (Pallas) population in the baie des
Veys, western Bay of Seine. Oceanol Acta 23: 529−545 Sylvand B (1995) La baie des Veys 1972−1993: structure et
évolution à long terme d’un écosystème benthique inter-tidal de substrat meuble sous influence estuarienne. PhD thesis, Université de Caen
Timsit O, Sylvand B, Lefeuvre JC (2004) Évolution du macro -zoobenthos intertidal de la baie des Veys de 1985 à 2000. [Intertidal macrozoobenthos evolution of the ‘Baie des Veys’ between 1985 and 2000]. C R Biol 327: 51−64 Underwood GJC, Kronkamp J (1999) Primary production by
phytoplankton and microphytobenthos in estuaries. Adv Ecol Res 29: 93−153
Underwood AJ, Chapman MG, Donnel SD (2000) Observa-tions in ecology: you can’t make progress on processes without understanding the patterns. J Exp Mar Biol Ecol 250: 97−115
van de Koppel J, Herman PMJ, Thoolen P, Heip CHR (2001) Do alternate stable states occur in natural ecosystems? Evidence from a tidal flat. Ecology 82: 3449−3461 van der Wal D, Wielemaker-van den Dool A, Herman PMJ
(2010) Spatial synchrony in intertidal benthic algal bio-mass in temperate coastal and estuarine ecosystems. Ecosystems 13: 338−351
Welschmeyer NA (1994) Fluorometric analysis of
chloro-phyll a in the presence of chlorophyll b and
pheopig-ments. Limnol Oceanogr 39: 1985−1992
Yallop ML, Paterson DM, Wellsbury P (2000) Interrelation-ships between rates of microbial production, exopolymer production, microbial biomass and sediment stability in biofilms of intertidal sediment. Microb Ecol 39: 116−127 Zajac RN (2008) Challenges in marine, soft-sediment
ben-thoscape ecology. Landscape Ecol 23: 7−18
Editorial responsibility: Matthias Seaman, Oldendorf/Luhe, Germany
Submitted: May 10, 2010; Accepted: February 28, 2012 Proofs received from author(s): June 22, 2012
![Fig. 6. Temporal dynam- dynam-ics from 8 to 24 July 2003 of (A) the microphyto-benthic biomass (chl a content per g sediment dry weight [DW]), (B) silt content, and (C) wind speed (black lines) and tidal coefficient (grey line)](https://thumb-eu.123doks.com/thumbv2/123doknet/14798860.605150/10.918.238.827.140.684/temporal-microphyto-benthic-biomass-content-sediment-content-coefficient.webp)
![Fig. 8. Regression lines between microphytobenthic biomass (chl a content per g sediment dry weight [DW]) and silt con-tent in July 2003 (white squares; very weak relationship) and March 2004 (black circles; weak but significant](https://thumb-eu.123doks.com/thumbv2/123doknet/14798860.605150/12.918.74.450.783.1012/regression-microphytobenthic-biomass-content-sediment-squares-relationship-significant.webp)
