HAL Id: hal-01389119
https://hal.univ-reunion.fr/hal-01389119
Submitted on 28 Oct 2016
HAL is a multi-disciplinary open access
archive for the deposit and dissemination of
sci-entific research documents, whether they are
pub-lished or not. The documents may come from
teaching and research institutions in France or
abroad, or from public or private research centers.
L’archive ouverte pluridisciplinaire HAL, est
destinée au dépôt et à la diffusion de documents
scientifiques de niveau recherche, publiés ou non,
émanant des établissements d’enseignement et de
recherche français ou étrangers, des laboratoires
publics ou privés.
The Kaapvaal craton seismic anisotropy: Petrophysical
analyses of upper mantle kimberlite nodules
W Ben-Ismail, Guilhem Barruol, D Mainprice
To cite this version:
W Ben-Ismail, Guilhem Barruol, D Mainprice. The Kaapvaal craton seismic anisotropy: Petrophysical
analyses of upper mantle kimberlite nodules. Geophysical Research Letters, American Geophysical
Union, 2001, 28 (13), pp.2497 - 2500. �10.1029/2000GL012419�. �hal-01389119�
The Kaapvaal craton seismic anisotropy: petrophysical
analyses of upper mantle kimberlite nodules
W. Ben-Ismail, and G. Barruol, D. Mainprice
Laboratoire de Tectonophysique, CNRS, Universite Montpellier II, 34095 Montpellier, France.
Abstract. A dense network of seismic stations has been deployed on the Kaapvaal craton (South Africa) to investi-gate the upper mantle seismic structures. In order to bring independent petrophysical constraints, we analyze a direct sampling of the cratonic upper mantle and determine the seismic properties of 48 mantle nodules brought up to the Earth’s surface by kimberlite eruptions. Seismic properties of these nodules are calculated from the olivine and pyroxene crystal preferred orientations and the single crystal elastic constants. Despite variations in the nodules compositions, microstructures and crystallographic preferred orientations, seismic anisotropy is rather homogeneous throughout the craton. Mean S-wave anisotropy is weak (2.64 %), which is compatible with the small measured SKS wave splitting (mean delay time of 0.62 s).
1. Introduction
The pervasive structure of the upper mantle beneath the Kaapvaal craton is investigated by seismic tomography [e.g., James et al., 2001] and by measuring the splitting of tele-seismic shear waves [Silver et al., 2001]. This splitting is primarily induced by the upper mantle seismic anisotropy and reflects the preferred alignments of crystals and particu-larly those of olivine [e.g., Mainprice et al., 2000]. Since this technique has a poor vertical resolution, the interpretation is debated [Vinnik et al., 1995; Silver, 1996] and requires other constraints, such as petrophysical analyses.
On the Kaapvaal craton, mantle nodules brought to the surface by kimberlitic eruptions provide a means to inves-tigate the physical properties of the cratonic root. In this paper, we first present our selection of nodules representa-tive of the cratonic lithosphere. We then describe the meth-ods of crystallographic measurements and the calculation of the three-dimensional seismic properties. We finally discuss how our petrophysical data may constrain the seismological observations.
2. Selection of upper mantle samples
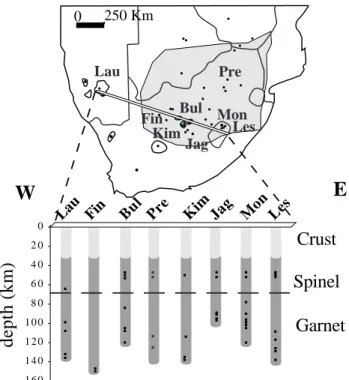
More than 2000 kimberlitic eruptions are documented in South Africa on and off the Kaapvaal craton (Figure 1) and some of them brought mantle xenoliths to the Earth’s surface. The majority of these eruptions are Cre-taceous in age, except Premier mine which is Precam-brian in age. Re/OS analyses [Pearson et al., 1995] made on mantle nodules suggest that the cratonic root might
Copyright 2001 by the American Geophysical Union. Paper number 1999GL000000.
0094-8276/01/1999GL000000$05.00
not have suffered any subsequent thermo tectonic event able to change the geochemical ratios since Archean times.
Using three of the most important sample collections (A. Nicolas’s in Montpellier, France, F.R. Boyd’s at the Carnegie Institution, USA, and J. Gurney’s at Cape Town, South Africa), we selected 11 kimberlite pipes, at widely spread sites (Figure 1) but primarily in the southern part of the craton due to the lack of sampling further north.
To have the largest possible representation of the upper mantle root beneath each pipe, we selected samples accord-ing to (i) their modal composition (harzburgite or lherzo-lite with spinel or garnet), (ii) their microstructure (grain size, grain boundary and internal deformation) and (iii) their depth of equilibrium.
The mantle nodules display two types of microstructure, likely generated by different tectonic histories. A first set is composed of strongly plastically deformed (sheared) nod-ules, characterized by a high degree of deformation and re-crystallization [Boullier and Nicolas, 1975]. Chemical
anal-0
250 Km
Jag
Bul
Lau
Fin
Kim
Pre
Les
Mon
0 2 0 4 0 6 0 8 0 1 0 0 1 2 0 1 4 0 1 6 0Jag
Bul Pre
Kim
Les
Lau Fin
Mon
depth (km)
Spinel
Crust
Garnet
W
E
Figure 1. Kimberlites occurrences in South Africa and pipes at which we selected upper mantle nodules (Pre=Premier mine, Lau=Lauwrencia, Fin=Finsch, Bul=Bultfontein, Kim=Kimber-ley combining 3 samples from KimberKim=Kimber-ley and 1 from Pipe200, Jag=Jagersfontein, Mon=Monastery, Les=Lesotho group com-bining 6 samples from Letseng la Terae, 2 from Thaba Putsoa and 1 from Liqhobong). We also present on schematic vertical logs the depth of sampling of the 48 selected nodules.
2 BEN ISMAIL ET AL.: SEISMIC PROPERTIES OF KIMBERLITE NODULES yses of these nodules [Boyd and Gurney, 1986] indicate
pressures of equilibrium of 5.5 - 6.5 GPa, corresponding to depths between 170 and 200 km but temperature between 1200 and 1400◦C, i.e., higher than predicted by the con-tinental geotherm. A tectonic model [Green and Gueguen, 1983] suggests that these samples could have been locally de-formed in high temperature asthenospheric diapirs intruding the base of the lithosphere. Since their origins do not ap-pear to be related to a pervasive event, we did not consider these microstructures as representative of the cratonic litho-sphere. The second set of microstructure is characterized by large grains with no evidence of intra crystalline deforma-tion [Boullier and Nicolas, 1975]. The coarse grain garnet-bearing nodules equilibrated at PT conditions in agreement with the continental geotherm, between 60 and 130 km. The chemical equilibrium and the absence of any microstructural evidence of high temperature, high stress, and fast deforma-tion, suggest that their structures were not affected by the extraction process. We therefore considered the coarse grain nodules as representative of the cratonic root. Careful thin section analyses does not evidence any structural stratifica-tion of the Kaapvaal craton as first proposed by Boyd and Nixon [1973]. This is in agreement with the observations made by Ji et al. [1994] in the Canadian shield.
We finally retained 48 coarse-grained nodules, typical of the sub continental lithosphere and covering a rather large range of composition and microstructure. Since the previous petrophysical studies of the Kaapvaal mantle nodules was restricted to 5 samples from various pipes [Mainprice and Silver, 1993] and by 6 samples from a single pipe [Long and Christensen, 2000], the present study expands by a factor 5 the number of samples from this area.
3. Crystallographic measurements
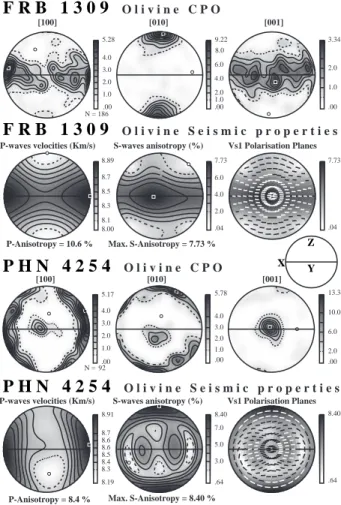
Crystal preferred orientations were determined by optical microscopy for 37 samples and scanning electron microscopy for 11 samples. In the first case, the optical properties of the orthorhombic minerals (olivine and enstatite) were used to determine the individual crystal orientations by using a 5 axes universal stage. In the second case, we used electron back-scattered diffraction techniques (EBSD) [Adams et al., 1993]. Diffraction patterns are generated by interaction of a vertical incident electron beam with a polished thin sec-tion. The diffraction pattern is projected onto a phosphor screen, acquired by a low-light, high-resolution camera, dig-itally processed and indexed in terms of crystal orientation. More than half of the measured olivine crystallographic preferred orientations display similar CPO to sample FRB1309 (Figure 2), that can result from high tempera-ture plastic deformation. These fabrics are characterized by concentration of the olivine [100] axes close to the lineation and [010] axes orientated at high angle to the foliation plane. A second, unusual, type of texture, like the one found in sample PHN4254 (Figure 2) is observed in less than a third of the selection. It is characterized by [001] olivine axes close to the Y structural axis (normal to the lineation in the foliation) and by [100] and [010] axes forming girdles in the (XZ) structural plane (X=lineation, Z=pole to the fo-liation). Careful rotation and comparison with the enstatite CPO shows that these textures are not related to error in the finite strain ellipsoid determination. These textures may be either derived from recrystallization processes or could
rep-resent relics of much deeper material. Although the origin of these fabrics remains unclear, the fact that they equili-brated in the cratonic lithosphere led us to retain them for characterization of the Kaapvaal craton anisotropy.
4. Calculation of rock seismic properties
Using the olivine and enstatite CPO and the single crys-tal elastic constants, we calculated the rock seismic proper-ties [Mainprice and Humbert, 1994]. Comparisons between calculated and measured velocities [e.g., Crosson and Lin, 1971; Barruol and Kern, 1996] show that although the Voigt average gives an upper bound in the elastic stiffness coeffi-cients, the calculated velocities give a rather good agreement with the direct measurements. We therefore used this aver-age in our calculations. We extrapolated the single crystal elastic constants to the depths of equilibrium for each nodule using the temperature and pressure derivatives [Mainprice et al., 2000]. We report figure 2 for the two different olivine fabrics presented above, the three dimensional seismic ve-locities calculated for these pure olivine aggregates : the P-wave velocity pattern, the S-wave anisotropy and the po-larization of the fast split shear waves. For both types of fabrics, the preferred orientation of the [100] olivine
crys-5.17 .00 N = 92 1.0 2.0 3.0 4.0 5.78 .00 1.0 2.0 3.0 4.0 13.34 .00 2.0 6.0 10.0 5.28 .00 [100] N = 186 1.0 2.0 3.0 4.0 9.22 .00 [010] 1.0 2.0 4.0 6.0 8.0 3.34 .00 [001] [100] [010] [001] 1.0 2.0 8.89 8.00
P-Anisotropy = 10.6 % Max. S-Anisotropy = 7.73 %
Max. S-Anisotropy = 8.40 % 8.1 8.3 8.5 8.7 7.73 .04 2.0 4.0 6.0 7.73 .04 8.91 8.19 P-Anisotropy = 8.4 % 8.3 8.4 8.5 8.6 8.6 8.7 8.40 .64 3.0 5.0 7.0 8.40 .64 Vs1 Polarisation Planes P-waves velocities (Km/s) S-waves anisotropy (%)
Vs1 Polarisation Planes P-waves velocities (Km/s) S-waves anisotropy (%)
F R B 1 3 0 9
O l i v i n e S e i s m i c p r o p e r t i e sP H N 4 2 5 4
O l i v i n e S e i s m i c p r o p e r t i e sF R B 1 3 0 9
O l i v i n e C P OP H N 4 2 5 4
O l i v i n e C P O X Z YFigure 2. Stereographic projection (lower hemisphere) of two typical olivine crystal preferred orientations (CPO) in a struc-tural reference frame (X : rock lineation; Z: pole of the foliation). Contours in multiples of a uniform distribution. The seismic prop-erties of the pure olivine aggregate is shown below. See text for interpretation.
tallographic axes induces a maximum P-wave velocity close to the rock lineation. For the S-waves, the plastic deforma-tion texture is characterized by a maximum birefringence parallel to Y, whereas the “abnormal” fabric has the maxi-mum birefringence parallel to Z. In both cases however, the fast split shear wave is generally polarized parallel to the lineation. Adding about 20 % of orthopyroxene in the cal-culation decreases both the P and S anisotropies compared to a pure olivine aggregate. P anisotropy is lowered from 10.6 to 8.4 % and from 8.4 to 5.8 % respectively for samples FRB1309 (at 100 km depth) and PHN4254 (at 75 km depth) and the maximum S anisotropy is lowered in the same time respectively from 7.7 to 5.8 % and to 8.4 to 6.1 %. These anisotropy magnitudes are similar to calculations and direct ultrasonic measurements made on Bultfontein nodules [Long and Christensen, 2000].
Despite variations in microstructures, composition, and depth of origin, the calculated seismic properties taking into account olivine and enstatite CPO and calculated at their depth of origin, are rather homogeneous. Calculated anisotropies are in the range 2-8 % for P-waves and 1-6 % for S-waves which is smaller than anisotropy calculated on peridotite sampled in ophiolites [Ben Ismail and Mainprice, 1998].
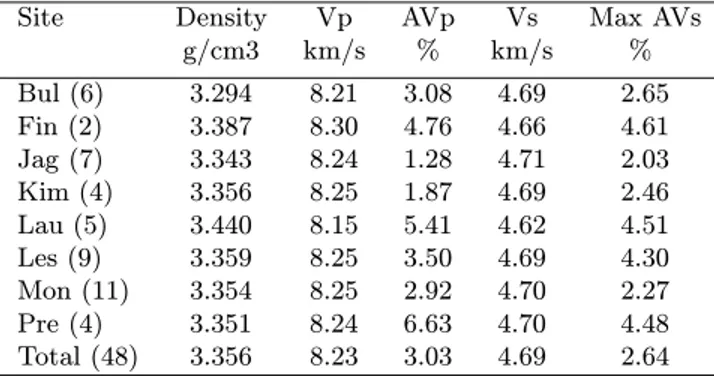
Averaging the seismic properties by giving the same weight to each sample for each site (Table 1) is a way to integrate the small-scale variations in a similar way to seis-mic waves. These averages show S-anisotropies ranging be-tween 2.0 to 4.6 % depending on the locality. These val-ues are smaller than individual rock anisotropies due to destructive interferences between anisotropy patterns. On the craton itself, three pipes display anisotropy larger than 4.0 % (Finsch, Premier and the Lesotho group). Interest-ingly, Lauwrencia, which is off craton, is also characterized by rather high S-anisotropy (4.5 %). On the other hand, three pipes located in the central part of the transect pre-sented in figure 1 (Monastery, Jagersfontein and Kimberley) are weakly anisotropic (respectively 2.3, 2.0 and 2.5 %).
Interestingly, the mean seismic properties of the 48 sam-ples (Figure 3) are not isotropic and display coherent three-dimensional patterns with respect to the foliation and lin-eation. This mean sample shows a small P-anisotropy of 3.0 %. The birefringence pattern is characterized by a weak S-anisotropy parallel to the lineation (0.9 %), and by higher anisotropies for directions normal to the foliation (2.6 %) and normal to the lineation (1.7 %).
Table 1. Average P- and S-Wave Velocity and Anisotropy Cal-culated at Each Locality. The Number of Samples Used at Each Site (for Abbreviations see Figure 1) is also Indicated.
Site Density Vp AVp Vs Max AVs g/cm3 km/s % km/s % Bul (6) 3.294 8.21 3.08 4.69 2.65 Fin (2) 3.387 8.30 4.76 4.66 4.61 Jag (7) 3.343 8.24 1.28 4.71 2.03 Kim (4) 3.356 8.25 1.87 4.69 2.46 Lau (5) 3.440 8.15 5.41 4.62 4.51 Les (9) 3.359 8.25 3.50 4.69 4.30 Mon (11) 3.354 8.25 2.92 4.70 2.27 Pre (4) 3.351 8.24 6.63 4.70 4.48 Total (48) 3.356 8.23 3.03 4.69 2.64 A Vp = 3.0 % Max. S-Anisotropy = 2.64 % Vs1 Polarisation Planes P-waves velocities (Km/s) S-waves anisotropy (%) 8.39 8.14 8.20 8.25 8.30 8.35 2.64 0.0 0.5 1.0 1.5 2.0 2.5 2.64 0.0
Figure 3. Mean seismic properties of the 48 Kaapvaal upper mantle nodules. The corresponding elastic stiffness coefficients are (in GPa): C11= 222.7000; C12= 78.5500; C13= 79.9800; C14= 0.0009; C15= -0.0010; C16= -0.0003; C22= 236.3900; C23= 79.7900; C24= -0.0068; C25= -0.0005; C26= 0.0031; C33= 227.1800; C34= -0.0058; C35= 0.0009; C36= 0.0015; C44= 73.6100; C45= 0.0018; C46= -0.0008; C55= 71.1500; C56= -0.0022; C66= 74.9400
5. Discussion and conclusion
The seismic anisotropy observations made in southern Africa are interpreted either in terms of frozen deformation in the cratonic lithosphere [Silver et al., 2001], or in terms of subcratonic mantle flow [Vinnik et al., 1995]. The verti-cally propagating SKS waves on and off the Kaapvaal craton show rather small delay times but regionally coherent polar-izations [Silver et al., 2001]. As the original orientations of the nodules are lost during their volcanic transport to the surface, we are only able to give quantitative constraints on the amount of intrinsic anisotropy within the lithospheric mantle but not to constrain the trend of the fast split shear waves. If the structures within the cratonic roots are ran-domly orientated, the observed teleseismic shear wave split-ting has to be related to subcratonic anisotropy. Alterna-tively, if the structures within the cratonic root are not ran-domly orientated at the regional scale, the observed SKS delay times (0.62 s on average) [Silver et al., 2001] can be explained by the seismic properties of our average nodule for a 110 km thick anisotropic structure with a horizontal foliation. If the foliations are vertical within the cratonic root, a 170 km thick anisotropic layer may explain the ob-served SKS delay times in case of a sub-horizontal lineation (case of transpressive deformation) but a 400 km thick layer is needed in case of a vertical lineation. In summary, the small SKS splitting observed at the surface are compatible with the weak anisotropies found in the mantle nodules and could be related to frozen deformation within the root of the craton. The absence of detectable SKS splitting in the south-eastern part of the craton [Silver et al., 2001] may be related to short-scale (i.e., hecto to kilometric) variations in the structure orientation which could render the medium isotropic to vertically-propagating SKS waves or to weaker intrinsic upper mantle anisotropy in this area, which may be coherent with the very small S-wave anisotropy we observed in rocks from Jagersfontein, Kimberley and Monastery.
Acknowledgments. We thank J. Boyd, P. Nixon, A. Nicolas and J. Gurney for allowing us to use their collections of mantle nodules. Specials thank goes to J. Boyd and P. Silver for instructive discussions about the Archean mantle. We thank two anonymous reviewers for constructive reviews and C. Nevado who made hundreds of thin sections that allowed this study. This work was supported by the National Science Foundation (# EAR-9526840), by NATO grant # CRG950269 and by EU grant for W. Ben Isma¨ıl. The SEM/EBSD system from the Laboratoire
4 BEN ISMAIL ET AL.: SEISMIC PROPERTIES OF KIMBERLITE NODULES
de Tectonophysique has been funded by the CNRS/INSU, the Universit´e of Montpellier II and the NSF project “Anatomy of an Archean craton”.
References
Adams B. L., S. I. Wright and K. Kunze, Orientation imaging: the emergence of a new microscopy, Metallurgical Transactions, 24A, 819-831, 1993.
Barruol G. and H. Kern, P and S waves velocities and shear wave splitting in the lower crustal/upper mantle transition (Ivrea Zone): Experimental and calculated data, Phys. Earth Planet. Inter., 95, 175-194, 1996.
Ben Ismail W. and D. Mainprice, An olivine fabric database: An overview of upper mantle fabrics and seismic anisotropy, Tectonophysics, 296, 145-157, 1998.
Boullier A. M. and A. Nicolas, Classification of textures and fabrics of peridotites xenoliths from south african kimberlites, Phys. Chem. Earth, 9, 467-475, 1975.
Boyd F. R. and J. J. Gurney, Diamonds and the african litho-sphere, Science, 232, 472-477, 1986.
Boyd F. R. and P. H. Nixon, Structure of the upper mantle be-neath Lesotho, in Carnegie Institution Year Book, pp. 431-445, Washington, D.C., 1973.
Crosson R. S. and J. W. Lin, Voigt and Reuss prediction of anisotropic elasticity of dunite, J. Geophys. Res., 76, 570-578, 1971.
Green H. W. and Y. Gueguen, Deformation of peridotite in the mantle and extraction by kimberlite; a case history docu-mented by fluid and solid precipitates in olivine, in Deforma-tion processes in tectonics, edited by M. A. Etheridge and S. F. Cox, pp. 71-92, Elsevier, Amsterdam, Netherlands, 1983. James D. E., M. J. Fouch, J. C. VanDecar and S. Van der Lee,
Seismic tomography of the Kaapvaal craton, Geophys. Res. Lett., this issue, 2001.
Ji S., X. Zhao and D. Francis, Calibration of shear-wave splitting in the subcontinental upper mantle beneath active orogenic belts using ultramafic xenoliths from the Canadian cordillera and Alaska, Tectonophysics, 239, 1-27, 1994.
Long C. and N. I. Christensen, Seismic anisotropy of the South African upper mantle xenoliths, Earth Planet. Sci. Lett., 179, 551-565, 2000.
Mainprice D., G. Barruol and W. Ben Ismail, The seismic anisotropy of the Earth’s mantle: from single crystal to poly-crystal, in Earth’s deep interior: Mineral Physics and To-mography from the atomic to the global scale, edited by S. I. Karato, pp. 237-264, AGU, Washington, D.C., 2000. Mainprice D. and M. Humbert, Methods of calculating
petrophys-ical properties from lattice preferred orientation data, Surv. Geophys., 15, 575-592, 1994.
Mainprice D. and P. G. Silver, Interpretation of SKS-waves us-ing samples from the subcontinental lithosphere, Phys. Earth Planet. Inter., 78, 257-280, 1993.
Pearson D. G., R. W. Carlson, S. B. Shirey, F. R. Boyd and P. H. Nixon, Stabilisation of Archean lithospheric mantle: a Re-Os isotope study of peridotite xenoliths from the Kaapvaal craton., Earth Planet. Sci. Lett., 134, 341-357, 1995. Silver P. G., Seismic anisotropy beneath the continents: Probing
the depths of geology, Annu. Rev. Earth Planet. Sci., 24, 385-432, 1996.
Silver P. G., S. S. Gao and Kaapvaal seismic group, Mantle de-formation beneath southern Africa, Geophys. Res. Lett., this issue, 2001.
Vinnik L. P., R. W. E. Green and L. O. Nicolaysen, Recent defor-mation of the deep continental root beneath southern Africa, Nature, 375, 50-52, 1995.
G. Barruol and D. Mainprice, Laboratoire de Tectonophysique, CNRS, Universite Montpellier II, 34095 Montpellier, France. (e-mail: barruol@dstu.univ-montp2.fr; david@dstu.univ-montp2.fr) W. Ben Ismail, The Rock Deformation Laboratory, University of Manchester, Manchester M13 9PL, UK.
(e-mail: wismail@fs1.ge.man.ac.uk)
(Received October 2, 2000; revised January 25, 2001; accepted January 30, 2001.)