HAL Id: hal-00299008
https://hal.archives-ouvertes.fr/hal-00299008
Submitted on 1 Jan 2003
HAL is a multi-disciplinary open access
archive for the deposit and dissemination of
sci-entific research documents, whether they are
pub-lished or not. The documents may come from
teaching and research institutions in France or
abroad, or from public or private research centers.
L’archive ouverte pluridisciplinaire HAL, est
destinée au dépôt et à la diffusion de documents
scientifiques de niveau recherche, publiés ou non,
émanant des établissements d’enseignement et de
recherche français ou étrangers, des laboratoires
publics ou privés.
Time independent seismic hazard analysis of Greece
deduced from Bayesian statistics
T. M. Tsapanos, G. A. Papadopoulos, O. Ch. Galanis
To cite this version:
T. M. Tsapanos, G. A. Papadopoulos, O. Ch. Galanis. Time independent seismic hazard analysis
of Greece deduced from Bayesian statistics. Natural Hazards and Earth System Science, Copernicus
Publications on behalf of the European Geosciences Union, 2003, 3 (1/2), pp.129-134. �hal-00299008�
c
European Geosciences Union 2003
and Earth
System Sciences
Time independent seismic hazard analysis of Greece deduced from
Bayesian statistics
T. M. Tsapanos1, G. A. Papadopoulos2, and O. Ch. Galanis1
1Aristotle University of Thessaloniki, School of Geology, Geophysical Laboratory, 54006 Thessaloniki, Greece 2Institute of Geodynamics, National Observatory of Athens, 11810 Athens, Greece
Received: 25 January 2002 – Revised: 2 September 2002 – Accepted: 20 September 2002
Abstract. A Bayesian statistics approach is applied in the
seismogenic sources of Greece and the surrounding area in order to assess seismic hazard, assuming that the earthquake occurrence follows the Poisson process. The Bayesian ap-proach applied supplies the probability that a certain cut-off magnitude of Ms =6.0 will be exceeded in time intervals of
10, 20 and 75 years. We also produced graphs which present the different seismic hazard in the seismogenic sources ex-amined in terms of varying probability which is useful for engineering and civil protection purposes, allowing the des-ignation of priority sources for earthquake-resistant design. It is shown that within the above time intervals the seismo-genic source (4) called Igoumenitsa (in NW Greece and west Albania) has the highest probability to experience an earth-quake with magnitude M ≥ 6.0. High probabilities are found also for Ochrida (source 22), Samos (source 53) and Chios (source 56).
1 Introduction
A large number of models are currently available for the as-sessment of seismic hazard. The objective in seismic hazard modeling is to obtain long term probabilities of occurrence of seismic events of specific size in a given time interval.
The Bayesian formalism allows the solution of prob-lems which otherwise would be unapproachable. Benjamin (1968), assuming the Poisson distribution was the first who dealt with a Bayesian approach for the probabilistic descrip-tion of the earthquake occurrence. Chou et al. (1971), pre-sented a similar application based on different distributions. Mortgat and Shah (1979) presented a Bayesian model, for seismic hazard mapping, which takes into account the ge-ometry of the faults in the investigated area, while Campbell (1982 and 1983) proposed a Bayesian extreme value distri-bution of earthquake occurrence to evaluate the seismic haz-ard along the San Jacinto fault. A similar procedure have Correspondence to: T. M. Tsapanos ([email protected])
been applied by Stavrakakis and Tselentis (1987) for a prob-abilistic prediction of strong earthquakes in Greece. Ferraes (1985, 1986) used a Bayesian analysis to predict the inter-arrival times for strong earthquakes along the Hellenic arc, as well as for Mexico. An alternative view of Ferraes re-search is made by Papadopoulos (1987) for the occurrence of large shocks in the east and west side of the Hellenic arc. A Bayesian approach of estimating the maximum values of the seismic peak ground acceleration at a considered site is pre-sented by Pisarenko and Lyubushin (1997), while Lamarre et al. (1992) made an effort for a realistic evaluation of seismic hazard.
Greece is one of the most seismically active regions of the world. Ranking fifty seismogenic countries of the world Greece takes the sixth position (Tsapanos and Burton, 1991). Papazachos (1990) found that the most probable annual max-imum magnitude of the shallow earthquakes in Greece is
M = 6.3 while Papadopoulos and Kijko (1991) showed that the mean return periods of the shallow main shocks of
Ms =6.0 and Ms =6.5 are around 1.7 years and 13 years,
respectively. The seismotectonics in Greece and the adjacent regions is rather complex and, therefore, seismic hazard has been assessed on the basis of several approaches. The earth-quake parameters used to describe the seismic hazard include maximum expected macroseismic intensity (Shebalin et al., 1976; Papaioannou, 1984), peak ground acceleration or ve-locity (Algemissen et al., 1976; Makropoulos and Burton, 1985), duration of the strong ground motion (Margaris et al., 1990; Papazachos et al., 1992) and maximum expected magnitude in conjunction with the return period of events of certain magnitude (Papadopoulos and Kijko, 1991). The ge-ographical distribution of seismic hazard in Greece based on zonation of seismic sources was approached by Papazachos et al. (1993). Methods incorporating Bayesian statistics were applied by Stavrakakis (1985), Papadopoulos (1988, 1990), Pisarenko et al. (1996), and Stavrakakis and Drakopoulos (1995).
In this paper we test a time independent Bayesian ap-proach (Benjamin, 1968) that yields the probability that a
130 T. M. Tsapanos et al.: Time independent seismic hazard analysis of Greece 31 22 30 34 33 32 19 20 17 15 16 14 28 27 13 10 25 26 46 45 18 29 48 47 49 50 53 54 52 51 58 57 56 55 44 41 9 12 24 8 43 42 400 39 63 62 61 37 38 11 7 6 5 60 59 23 4 67 66 65 64 36 35 3 2 21 1
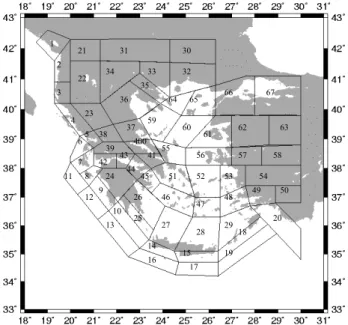
Fig. 1. Seismogenic sources of Greece and the surrounding area according to Papaioannou and Papazachos (2000).
certain cut-off magnitude will be exceeded in certain time intervals, a method that was not tested in the past in the seis-mogenic area of Greece. The method was tested on a new earthquake catalogue (Papazachos et al., 2000) and on the seismic zonation presented recently by Papaioannou and Pa-pazachos (2000). We also produced graphs which present the different seismic hazard behavior in the examined seis-mogenic sources. The source-dependent probability of ex-ceedance, as an expression of seismic hazard, was also esti-mated.
2 Data set and the seismogenic sources
Information about the seismicity of Greece exists since the 6th century B.C. However, most of the existing data banks suffer from that they do not fulfil the basic properties com-pleteness, homogeneity, and accuracy required for a reliable estimation of various seismic parameters. Recently, an up-dated earthquake catalogue was compiled by Papazachos et al. (2000) (which is also presented in http://geohazards.cr. usgs.gov/iaspei/europe/greece/the/catalog.htm) in an effort to increase completeness, homogeneity and accuracy. Given that we are interested for the strong earthquake activity, we used only the part of the catalogue covering the time inter-val 1845–1999, which it is likely complete for M = 6.0. The errors involved in the magnitudes are in the interval of
±0.25 for the instrumental period (1911–1999). For the his-torical data these errors are ±0.35 when the number of avail-able macroseismic points of observations is greater than 10. When the number of observation points is less than 10 the magnitude errors reach up to a half magnitude unit. The epi-center coordinates for the earthquakes of the period 1965–
1999 have been calculated by instrumental data and their er-rors are up to 20 km for the older ones (1965–1980) and up to 10 km for the more recent ones (1981–1999). These co-ordinates for the period 1901–1964 were calculated by both instrumental and macroseismic information and their errors reach up to 30 km. For the historical earthquakes the epi-centers have usually an error of about 30 km but this may go up to 50 km when the number of available observation points is less than 5. Typical shallow earthquakes in the studied area have a focal depth of less than 20 km, with the excep-tion of events occurring along the Hellenic arc where depths can reach up to 50 km. Seismicity of intermediate focal depth also occurs in the South Aegean Sea. However, the present study is restricted to shallow seismicity only. Aftershocks were eliminated, applied the procedure proposed by Gardner and Knopoff (1974) while the foreshocks removed by tak-ing into account the critirion suggested by Jones and Molnar (1976). In this way only main shocks considered for the pur-pose of the present study.
Seismic zonation is one of the major problems in the very complex area of Greece. Papaioannou and Papazachos (2000) proposed a new regionalization of the shallow seis-mogenic sources which is based on historical and instrumen-tal earthquake location data and on the stress field pattern as derived from reliable fault plane solutions. Thus, the whole Greece and the surrounding area was divided in 67 differ-ent seismogenic sources (Fig. 1). In the presdiffer-ent study we adopted the above seismic zonation.
3 Method applied
We assume a Poisson distribution for the number of earth-quake events n that occur in a time interval t . Then the prob-ability function is:
P (n, t |ν) = (νt )
ne−νt
n! , (1)
where the positive parameter ν, is the mean rate of earth-quake occurrence. Suppose that in a given seismic source n0
events occurred in t0 years, which is the time length of the
catalogue. The likelihood function is:
l(ν) = P (n0, t |ν) =
(νt0)n0e−νt0
n0!
. (2)
It is reminded that likelihood is the probability of the specific outcome to occur, that is the probability for exactly n0
earth-quakes to occur in the t0years covered by the catalogue, as a
function of the mean rate of occurrence.
The prior distribution for ν, f0(ν) is assumed to be uni-form. This is equivalent to stating that the mean rate of oc-currence can have any value, as long as it is not negative, with the same probability. From the Bayesian theory, its posterior distribution, will be:
Table 1. Probability of exceedance of magnitude 6.0 in 10, 20 and 75 years, no denotes the number of mainshocks with magnitude
M ≥6.0
mainshocks, M ≥ 6.0 Probability of exceedance in: Names of sources no 10 years 20 years 75 years
Source 1 Montenegro 2 0.171 0.305 0.694 Source 2 Dyrrachium 4 0.268 0.455 0.861 Source 3 Avlona 7 0.394 0.621 0.957 Source 4 Igoumenitsa 10 0.497 0.737 0.987 Source 5 Preveza 3 0.221 0.385 0.794 Source 6 Leukada 5 0.313 0.517 0.906 Source 7 Cephalonia 7 0.394 0.621 0.957 Source 8 Zante 7 0.394 0.621 0.957 Source 9 Pylos 6 0.354 0.572 0.937 Source 10 Mane 1 0.118 0.216 0.546 Source 11 Ionian Sea 1 3 0.221 0.385 0.794 Source 12 Ionian Sea 2 0 0.061 0.114 0.326 Source 13 Ionian Sea 3 2 0.171 0.305 0.694 Source 14 SW Crete 6 0.354 0.572 0.937 Source 15 SE Crete 1 0.118 0.216 0.546 Source 16 Libyan Sea 1 2 0.171 0.305 0.694 Source 17 Libyan Sea 2 1 0.118 0.216 0.546 Source 18 Karpathos 3 0.221 0.385 0.794 Source 19 Strabo 1 0.118 0.216 0.546 Source 20 Marmaris 6 0.354 0.572 0.937 Source 21 Piskope 1 0.118 0.216 0.546 Source 22 Ochrida 9 0.465 0.703 0.981 Source 23 Drosopighe 6 0.354 0.572 0.937 Source 24 Tripolis 5 0.313 0.517 0.906 Source 25 Cythera 4 0.268 0.455 0.861 Source 26 Leonidi 0 0.061 0.114 0.326 Source 27 NW Crete 0 0.061 0.114 0.326 Source 28 NE Crete 2 0.171 0.305 0.694 Source 29 Rhodos 3 0.221 0.385 0.794 Source 30 Philipoupole 1 0.118 0.216 0.546 Source 31 Kresna 4 0.268 0.455 0.861 Source 32 Drama 0 0.061 0.114 0.326 Source 33 Serres 1 0.118 0.216 0.546 Source 34 Ptolemais 3 0.221 0.385 0.794 Source 35 Volve 3 0.221 0.385 0.794 Source 36 Kozane 3 0.221 0.385 0.794 Source 37 Thessalia 5 0.313 0.517 0.906 Source 38 Cremasta 1 0.118 0.216 0.546 Source 39 Agrinio 1 0.118 0.216 0.546 Source 40 Maliakos 1 0.118 0.216 0.546 Source 41 Thebes 6 0.354 0.572 0.937 Source 42 Patra 1 0.118 0.216 0.546 Source 43 Aeghio 7 0.394 0.621 0.957 Source 44 Corinth 6 0.354 0.572 0.937 Source 45 Methana 1 0.118 0.216 0.546 Source 46 Melos 1 0.118 0.216 0.546 Source 47 Thera 2 0.171 0.305 0.694 Source 48 Cos 2 0.171 0.305 0.694 Source 49 Alikarnassos 4 0.268 0.455 0.861 Source 50 Denisli 1 0.118 0.216 0.546 Source 51 S. Euboikos Gulf 1 0.118 0.216 0.546 Source 52 Ikaria 1 0.118 0.216 0.546 Source 53 Samos 9 0.465 0.703 0.981 Source 54 Aydin 3 0.221 0.385 0.794 Source 55 Kyme 0 0.061 0.114 0.326
Table 1. continued
mainshocks, M ≥ 6.0 Probability of exceedance in: Names of sources no 10 years 20 years 75 years
Source 56 Chios 9 0.465 0.703 0.981 Source 57 Izmir 5 0.313 0.517 0.906 Source 58 Alashehir 1 0.118 0.216 0.546 Source 59 Skiathos 7 0.394 0.621 0.957 Source 60 Skyros 3 0.221 0.385 0.794 Source 61 Lesbos 5 0.313 0.517 0.906 Source 62 Demirci 5 0.313 0.517 0.906 Source 63 Gediz 4 0.268 0.455 0.861 Source 64 Athos 3 0.221 0.385 0.794 Source 65 Samothrace 6 0.354 0.572 0.937 Source 66 Hellespont 6 0.354 0.572 0.937 Source 67 Brussa 7 0.394 0.621 0.957
where c is a constant such that the resulting function can be a probability density function, that is:
+∞
Z
0
f00(ν)dν =1. (4)
Now, observe that because f00(ν)is independent of ν, the
factor k = c f0(ν)is constant, so that Eq. (3) can be rewritten as:
f00(ν) = kL(ν) = k(νt0)
n0e−νt0
n0!
. (5)
This expression is normalized for k = t0. Now consider the
posterior probability of n events occurring in t years. This will be the probability P (n, t |ν) weighted in respect to the posterior distribution of ν: P00(n, t ) = ∞ Z 0 P (n, t |ν)f00(ν)dv = ∞ Z 0 (νt )ne−νt n! t0(νt0)n0e−νt0 n0! dν. (6)
Integration yields (Benjamin, 1968):
P00(n t ) = (n + n0)! n!n0!
(t /t0)n
(1 + 1/t0)n+n0+1
. (7)
Applying Eq. (7), the posterior probability of no events occurring in t years is:
P (0, t) = (1 + t /t0)−n0−1. (8)
Therefore, the probability of exceedance of a selected lower magnitude, Mo, that is the probability of at least one
event of M ≥ Mooccurring in the next t years is:
132 T. M. Tsapanos et al.: Time independent seismic hazard analysis of Greece (a) n0 = 0 - 4 0.0 0.1 0.2 0.3 0.4 0.5 0.6 0.7 0.8 0.9 1.0 0 10 20 30 40 50 60 70 80 90 100 t (years) Probability 0 1 2 3 4 (b) n0 = 5 - 10 0.0 0.1 0.2 0.3 0.4 0.5 0.6 0.7 0.8 0.9 1.0 0 10 20 30 40 50 60 70 80 90 100 t (years) Pr obabilit y 5 6 7 9 10
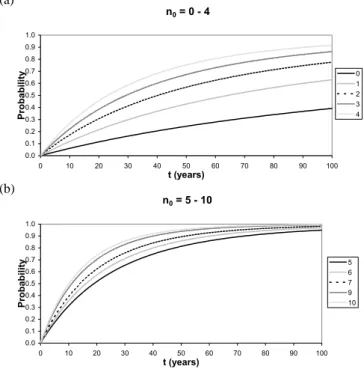
Fig. 2. Probabilities of exceedance of magnitude 6.0 in the range 1 to 100 years for (a) the Greek seismogenic sources with no=0 − 4
and (b) the Greek seismogenic sources with no=5 − 10.
From the above formula we computed the probabilities of exceedance of the magnitude Mo=6.0 in the 67 Greek
seis-mogenic sources at any time interval ranging from 1 to 100 years.
4 Results
The results obtained are shown in Table 1 and in Fig. 2. Ta-ble 1 includes the names of the seismic sources examined along with their corresponding code numbers (according to Papaioannou and Papazachos, 2000). In addition, Table 1 shows the number of shocks, no, with magnitude M ≥ 6.0
that were taken into account for the probability calculation, as well as the probability of exceedance in 10, 20 and 75 years. The first two time intervals are within the range usu-ally considered in the long-term earthquake prediction (e.g. Nishenko, 1985; Papazachos et al., 1987) while the time in-terval of 75 years is of engineering interest because it is al-most equal to the life time of the ordinary buildings. Also Papazachos et al. (1987) considered that the time interval of 20 years is more appropriate on the basis that the probability calculations are often more stable than they are for shorter intervals. In five of the seismic sources the number noof the
seismic events equals to 0, which is not true but means that events occurred only before 1845 when our data set begins. It was decided that this fact constitutes useful information, which could be input to the estimation of probabilities of oc-currence of actual earthquakes by means of the Bayes theo-rem. In fact, this information can set an upper limit to the
probability of occurrence of earthquakes, since it provides a lower limit to the time period during which no earthquakes occurred.
The source dependence of the exceedance probabilities listed in Table 1. We observed that all the sources belonged in one of 10 cases (where no =0, 1, 2, 3, 4, 5, 6, 7, 9 and
10). There is no source with no=8. We can grouped the 10
cases in those where no=0 − 4 (Fig. 2a), while in the other
group no=5 − 10 (Fig. 2b). It is interesting to observe that
the statistical behavior of the two groups is different, where the group no=0 − 4 shows lower probability values than the
other group with no ≥5. In general Fig. 2 allows for a
bet-ter visual inspection of the geographical probability distribu-tion. It is clear that the source 4 (Igoumenitsa) has the highest probability to experience an earthquake with M ≥ 6.0 in the next 10, 20 and 75 years. The second highest probability is estimated for Ochrida (source 22), Samos (source 53), and Chios (source 56), while high probabilities are also assessed for the sources 3, 7, 8, 43, 59 and 67.
Plots of the probabilities of exceedance for time periods ranging from 1 to 100 years (Fig. 3) shows that in about one third of the seismic sources, namely in those with code num-bers 3, 4, 6, 7, 8, 9, 14, 20, 22, 23, 41, 43, 44, 53, 56, 57, 59, 62, 65, 66 and 67, very high probabilities were found for an earthquake occurrence of magnitude M ≥ 6.0 in the next 100 years, while in the rest sources probability varies from low to high.
5 Discussion
The hazard computation in the present study assumes a ran-dom (Poisson) distribution of earthquakes in time, which is a good approximation with long, quasi-random time windows of earthquake occurrence. It is considered as a conservative assumption appropriate for building design.
Papazachos et al. (1987), based on the assumption that the repeat time of earthquakes follow the Gaussian distribution, presented a map of conditional probabilities for the occur-rence of shallow earthquakes with M ≥ 6.5 in the period 1986–2006. Results of that study are only partly compara-ble with those obtained by us because in our data set we also took into account strong earthquakes that occurred in the last fifteen years (1986–1999), a time interval which is not con-sidered by Papazachos et al. (1987) because in their study they dealt with data up to 1986. They also used a model which has a memory. For this reason contradictory results were obtained. For example, according to Papazachos et al. (1987) the source 43 (Aeghio) was of high probability (0.80–1.00), while for the time span of 20 years we calcu-lated relatively high (0.62) probability. This is due to the method used, as well as to the fact that the strong Aeghio earthquake (Mw = 6.4) of 15 June 1995 occurred after the
presentation of the results of Papazachos et al. (1987) and before the performance of our calculations. Our method ap-plied is based on the memoryless Poisson model. In other words the probabilities estimated before and after, for
in-(a)
Probability of exceedance Μ≥≥≥≥6.0 in 10 years
0.0 0.2 0.4 0.6 0.8 1.0 0 20 40 60 Source P ro b ab ilit y (b)
Probability of exceedance Μ≥≥≥≥6.0 in 20 years
0.0 0.2 0.4 0.6 0.8 1.0 0 20 40 60 Source P ro b ab ilit y (c)
Probability of exceedance Μ≥≥≥≥6.0 in 75 years
0.0 0.2 0.4 0.6 0.8 1.0 0 20 40 60 Source P ro b ab ilit y
Fig. 3. Distribution of the probability of exceedance of magnitude 6.0 in (a) 10, (b) 20 and (c) 75 years examined in the 67 seismogenic sources.
stance, the event of 1995 in Aeghion area (source 43) are al-most the same. A small test is applied for this source and the earthquake of 1995. We considered all shocks from 1845– 1985 (the time span for which Papazachos et al. took for the study of 1987) with magnitudes M ≥ 6.0. The prob-ability we found for these 140 years is 0.654. Taking into account and the event of 1995 and re-evaluated the probabil-ities now for 150 years (1845–1999) we found a probability 0.621, which is in accordance with what method describes; almost equal probabilities before and after a strong event. Nevertheless, some of the areas determined by Papazachos et al. (1987) of being of very high probability are identical with the sources 4, 6, 7, and 31 determined in the present study as the most likely to experience an earthquake in the next 20
years. Moreover, Papazachos and Papaioannou (1993) based on a time dependent model, investigated the long-term earth-quake prediction for the time interval 1993–2002. Although their approach is not based on the memoryless Poisson pro-cess some of their results are in good agreement with the results obtained in the present study (e.g. sources 4, 56, 67). The Bayesian approach as was indicated can be applied to any hazard analysis. A method recently elaborated by Pa-paioannou and Papazachos (2000) for seismic hazard assess-ment in Greece, based on both time dependent and time inde-pendent models, can not be adopted for comparison purposes given that intensities instead of magnitudes were applied.
The results obtained in the present paper are strongly sen-sitive to the seismic zonation adopted. In fact, the geograph-ical extent of the seismic sources is very small and therefore, a change in the zonation results in the shift of some earth-quake events from one seismic source to another, thus influ-encing the number of events incorporated in each source and consequently the seismic hazard. This becomes more real-istic if we take in account the error in the epicenter of the earthquakes (see Sect. 2) and apply this error especially to those earthquakes which occurred very close to the bounds of adjacent sources. In order to avoid this inconsistency sup-plementary information were considered (e.g. macroseismic observations). Thus we secured the place (source) of the oc-currence of an earthquake. Another bad influence could be the error in the determination of the earthquakes magnitude, whereas an error of ±0.2 magnitude units, could change the number of earthquakes in each source which exceeding the lower magnitude threshold considered. We must notice here that it is more important to look at the relative levels of proba-bility with respect to adjacent sources, than the absolute level in any single source. It seems that a physical interaction ex-ists between these sources, where the occurrence of a strong
(M ≥6.0) earthquake in one can disturb the stress field in the adjacent sources. In this way the time-independent ap-proach seems more appropriate for the present study. Objec-tive seismic zonation is still a major problem in the complex seismotectonic environment of Greece with important conse-quences in the reliable assessment of the seismic hazard.
Acknowledgements. The authors like to express their sincere thanks
to R. Console and the unknown reviewer for the fruitful criticism of the paper.
References
Algermissen, S. T., Perkins, D. M., Issherwood, W., Gordon, D., Reagor, G., and Howard, C.: Seismic risk evaluation of the Balkan region, Proc. Sem. Seismic Zoning Maps, UNESCO, Skopje 1975, 2, 68–171, 1976.
Benjamin, J. R.: Probabilistic models for seismic forces design, Struct. Div., ASCE 94, 5T5, 1175–1196, 1968.
Campbell, K. W.: Bayesian analysis of extreme earthquake occur-rences, Part I. Probabilistic hazard model, Bull. Seismol. Soc. Am., 72, 1689–1705, 1982.
134 T. M. Tsapanos et al.: Time independent seismic hazard analysis of Greece Campbell, K. W.: Bayesian analysis of extreme earthquake
occur-rences, Part II. Application to the San Jacinto fault zone of south-ern California, Bull. Seismol. Soc. Am., 73, 1099–1115, 1983. Chou, I. H., Zimmer, W. J., and Yao, J. T. P.: Likelihood of strong
motion earthquakes, Bureau of Engineering Research, University of New Mexico, Technical Report CE 27, 71, 1971.
Ferraes, S. G.: The Bayesian probabilistic predictions of strong earthquakes in the Hellenic arc, Tectonophysics, 111, 339–354, 1985.
Ferraes, S. G.: Bayes theorem and probabilistic prediction of inter-arrival times for strong earthquakes felt in Mexico city, J. Phys. Earth, 34, 71–83, 1986.
Jones, L. and Molnar, P.: Frequency of foreshocks, Nature, 262, 677–679, 1976.
Gardner, J. K. and Knopoff, L.: Is the sequence of earthquakes in Southern California with aftershocks removed, Poissonian? Bull. Seismol. Soc. Am., 64, 1363–1367, 1974.
Lamarre, M., Townshed, B., and Shah, H. C.: Application of the bootstrap method to quantify uncertainty in seismic hazard esti-mates, Bull. Seismol. Soc. Am., 82, 104–119, 1992.
Makropoulos, K. C. and Burton, P. W.: Seismic hazard in Greece, II Ground acceleration, Tectonophysics, 117, 259–294, 1985. Margaris, V. N., Theodooulidis, N. P., Papaioannou, Ch. A., and
Papazachos, B. C.: Strong motion duration of earthquakes in Greece, Proc. XXII Gen. Ass. E.S.C., 2, 865–871, 1990. Mortgat, C. P. and Shah, H. C.: A Bayesian model for seismic
haz-ard mapping, Bull. Seismol. Soc. Am., 69, 1237–1251, 1979. Nishenko, S. P.: Seismic potential for large and great interplate
earthquakes along the Chilean and southern Perouvian margins of south America: a quantitative reappraisal, J. Geophys. Res., 90, 3589–3615, 1985.
Papadopoulos, G. A.: An alternative view of the Bayesian proba-bilistic prediction of strong shocks in the Hellenic arc, Tectono-physics, 132, 311–320, 1987.
Papadopoulos, G. A.: Statistics of historical earthquakes and associ-ated phenomena in the Aegean and surrounding regions, In: The Engineering Geology of ancient Works, Monuments and Histor-ical Sites, Presentation and protection, (Eds) Marinos, P. G and koukis, G. C., Proc. Intern. Symp. organized by Greek National Group of IAEG, Athens, 19–23 September 1988, 1279–1283, 1988.
Papadopoulos, G. A.: Deterministic and stochastic models of the seismic and volcanic events in the Santorini volcano, Thera and the Aegean World Proc. of the 3rd Intern. Congr., (Ed) Hardy, D.A., 2 151–158, 1990.
Papadopoulos, G. A. and Kijko, A.: Maximum likelihood estima-tion of earthquake hazard parameters in the Aegean arc from mixed data, Tectonophysics, 185, 277–294, 1991.
Papaioannou, Ch. A.: Attenuation of seismic intensities and seismic hazard in the area of Greece, Ph. D. Thesis, Univ. of
Thessa-loniki, ThessaThessa-loniki, 200 pp., 1984.
Papaioannou, Ch. A. and Papazachos, B. C.: Time-independent and time-dependent seismic hazard in Greece based on seismogenic sources, Bull. Seismol. Soc. Am, 90, 22–33, 2000.
Papazachos, B. C.: Seismicity of the Aegean and surrounding area, Tectonophysics, 178, 287–308, 1990.
Papazachos, B. C. and Papaioannou, Ch. A.: Long-term earthquake prediction in the Aegean area based on a time and magnitude predictable model, Pageoph, 140, 593–612, 1993.
Papazachos, B. C., Papadimitriou, E. E., Kiratzi,, A. A., Papaioan-nou, Ch. A., and Karakaisis, G. F.: Probabilities of occurrence of large earthquakes in the Aegean and the surrounding area during the period 1986–2006, Pageoph., 125, 597–612, 1987.
Papazachos, B. C., Margaris, V. N., Theodoulidis, N. P., and Pa-paioannou, Ch. A.: Seismic hazard assessment in Greece based on strong motion duration, Proc. 10th W. C. E. E., 1, 425–430, 1992.
Papazachos, B. C., Papaioannou, Ch. A., Margaris, V. N., and Theodoulidis, N. P.: Regionalization of seismic hazard in Greece based on seismic sources, Natural Hazards, 8, 1–18, 1993. Papazachos, B. C., Comninakis, P. E., Karakaisis, G. F. Karakostas,
B. G., Papaioannou, Ch. A., Papazachos, C. B., and Scordilis, E. M.: A catalogue of earthquakes in Greece and surrounding area for the period 550B.C.–1999, Publ. of Geophys. Laboratory, Univ. of Thessaloniki, 2000.
Pisarenko, V. F., Lyubushin, A. A., Lysenko, V. B., and Golubeva, T. V.: Statistical estimation of seismic hazard parameters: max-imum possible magnitude and related parameters, Bull. Seism. Soc. Am., 86, 691–700, 1996.
Pisarenko V. F. and Lyubushin, A. A.: Statistical estimation of max-imal peak ground acceleration at a given point of seismic region, J. Seismology, 1, 395–405, 1997.
Shebalin, N. V., Reisner, G. I., Drumea, A. V., Aptekman, J. V., Sholpo, V. N., Stepaneks, N. Y., and Zacharova, A. J.: Earth-quake origin zones distribution of maximum expected seismic in-tensity for the Balkan region, Proc. Sem. Seismic Zoning Maps, UNESCO, Skopje 1975, 2, 68–171, 1976.
Stavrakakis, G. N.: Contribution of Bayes statistics on the estima-tion of the seismic risk of the broad area of Crete island and the simulation of the expected strong ground motions, Ph. D. Thesis, Univ of Athens, Athens, 266 pp., 1985.
Stavrakakis, G. N. and Tselentis, G. A.: Bayesian probabilistic pre-diction of strong earthquakes in the main seismogenic zones of Greece, Boll. Geofis. Teor. Applic., 113, 51–63, 1987.
Stavrakakis, G. N. and Drakopoulos, J.: Bayesian probabilities of earthquake occurrences in Greece and surrounding areas, Pa-geoph, 144, 307–319, 1995.
Tsapanos, T. M. and Burton, P. W.: Seismic hazard evaluation for specific seismic regions of the world, Tectonophysics, 194, 153– 169, 1991.