HAL Id: hal-00296013
https://hal.archives-ouvertes.fr/hal-00296013
Submitted on 30 Aug 2006
HAL is a multi-disciplinary open access
archive for the deposit and dissemination of
sci-entific research documents, whether they are
pub-lished or not. The documents may come from
teaching and research institutions in France or
abroad, or from public or private research centers.
L’archive ouverte pluridisciplinaire HAL, est
destinée au dépôt et à la diffusion de documents
scientifiques de niveau recherche, publiés ou non,
émanant des établissements d’enseignement et de
recherche français ou étrangers, des laboratoires
publics ou privés.
Optical properties of humic-like substances (HULIS) in
biomass-burning aerosols
A. Hoffer, A. Gelencsér, P. Guyon, G. Kiss, O. Schmid, G. P. Frank, P.
Artaxo, M. O. Andreae
To cite this version:
A. Hoffer, A. Gelencsér, P. Guyon, G. Kiss, O. Schmid, et al.. Optical properties of humic-like
substances (HULIS) in biomass-burning aerosols. Atmospheric Chemistry and Physics, European
Geosciences Union, 2006, 6 (11), pp.3563-3570. �hal-00296013�
www.atmos-chem-phys.net/6/3563/2006/ © Author(s) 2006. This work is licensed under a Creative Commons License.
Chemistry
and Physics
Optical properties of humic-like substances (HULIS) in
biomass-burning aerosols
A. Hoffer1,*, A. Gelencs´er2, P. Guyon1, G. Kiss2, O. Schmid1,**, G. P. Frank1, P. Artaxo3, and M. O. Andreae1 1Max Planck Institute for Chemistry, Department of Biogeochemistry, Mainz, Germany
2Air Chemistry Group of the Hungarian Academy of Sciences, Veszpr´em, Hungary
3Instituto de Fisica, Universidade de Sao Paulo, Sao Paulo, Brazil
*now at: Air Chemistry Group of the Hungarian Academy of Sciences, Veszpr´em, Hungary
**now at: GSF – Research Center for Environment and Health, Institute for Inhalation Biology, Neuherberg/Munich, Germany
Received: 1 July 2005 – Published in Atmos. Chem. Phys. Discuss.: 23 August 2005 Revised: 7 August 2006 – Accepted: 26 August 2006 – Published: 30 August 2006
Abstract. We present here the optical properties of
humic-like substances (HULIS) isolated from the fine fraction of biomass-burning aerosol collected in the Amazon basin dur-ing the LBA-SMOCC (Large scale Biosphere atmosphere experiment in Amazonia – SMOke aerosols, Clouds, rainfall and Climate) experiment in September 2002. From the iso-lated HULIS, aerosol particles were generated and their scat-tering and absorption coefficients measured. The size dis-tribution and mass of the particles were also recorded. The value of the index of refraction was derived from “closure” calculations based on particle size, scattering and absorption measurements. On average, the complex index of refraction at 532 nm of HULIS collected during day and nighttime was 1.65–0.0019i and 1.69–0.0016i, respectively. In addition, the imaginary part of the complex index of refraction was calcu-lated using the measured absorption coefficient of the bulk HULIS.
The mass absorption coefficient of the HULIS at 532 nm was found to be quite low (0.031 and 0.029 m2g−1for the day and night samples, respectively). However, due to the
high absorption ˚Angstr¨om exponent (6–7) of HULIS, the
specific absorption increases substantially towards shorter wavelengths (∼2–3 m2g−1 at 300 nm), causing a relatively
high (up to 50%) contribution to the light absorption of our Amazonian aerosol at 300 nm. For the relative contribution of HULIS to light absorption in the entire solar spectrum, lower values (6.4–8.6%) are obtained, but those are still not negligible.
Correspondence to: A. Hoffer
1 Introduction
During large-scale biomass burning events, vast amounts of aerosol are emitted into the atmosphere. The carbonaceous components of this aerosol are of utmost importance, since they make the dominant part of the particulate mass (PM) (Artaxo et al., 2002; Decesari et al., 2005). These aerosols scatter and absorb the incident light, affecting the energy transfer through the atmosphere, and thereby the Earth’s en-ergy budget and climate. During the burning process, de-pending on the oxygen supply, black carbon (BC) can be formed. Generally, higher amounts of BC are emitted from flaming fires than from smoldering fires. Besides the soot (or BC) particles, high amounts of carbonaceous compounds (in-cluding brown carbon or HULIS) can be found in the aerosol from biomass burning. Some information on the absorption characteristics of the HULIS in continental urban and back-ground aerosols is available (Havers, 1998), but the impor-tance of HULIS for the radiation transfer in the atmosphere is highly uncertain, in part since its index of refraction has not been measured yet. Recently Kirchstetter and coworkers (2004) reported the optical parameters of the organic carbon from biomass burning aerosol using a filter-based method. Since the specific absorption cross section of BC is the high-est among the carbonaceous constituents of the aerosols, its contribution to the atmospheric absorption by aerosols is considerable. Brown carbon (including HULIS), on the other hand, is expected to be a weaker absorber, but because of its higher abundance, its contribution to the absorption may also be important. In this study we present experimentally de-termined optical properties of humic-like substances isolated from biomass-burning aerosol.
3564 A. Hoffer et al.: Optical properties of humic-like substances
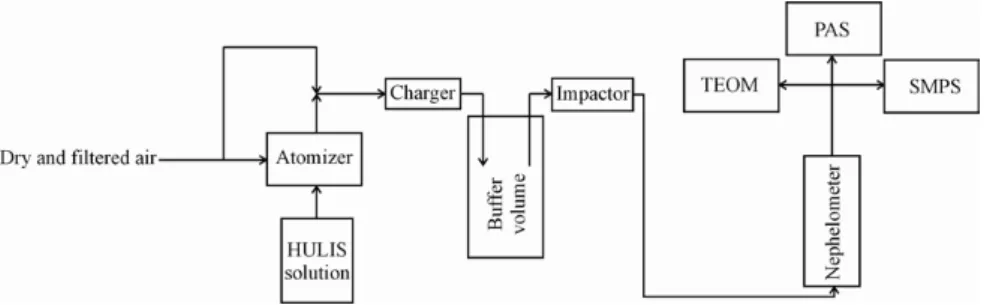
Fig. 1. Experimental setup for the measurement of the optical properties of HULIS aerosol.
2 Method
2.1 Sampling, collection and preparation
The samples were collected at a tropical pasture site in Rondˆonia, Brazil, during the LBA-SMOCC campaign in September 2002, which corresponds to the most active biomass burning period in this region. Information about the sampling site can be found elsewhere (Andreae et al., 2002, 2004). Sampling was performed with a dichotomous virtual impactor (Solomon et al., 1983) mounted on a 10 m high tower. The samples were collected on Pallflex quartz filters, preheated at 600◦C for at least 10 h. The air was sampled with a total flow of 16.3 m3h−1, and split inside the instru-ment at a 9:1 ratio in order to separate fine and coarse par-ticles, respectively, with a 50% aerodynamic diameter (Dp)
cutpoint of 2.5 µm (Solomon et al., 1983). Aerosols were collected separately during day and night, so that each filter corresponds to either daytime or nighttime aerosol to allow some investigation of diel effects. The typical sampling time for a given filter was about 10 h during daytime and about 12 h during nighttime.
For this investigation, we used 26 samples from the biomass burning period and extracted about 3/8 of each filter for the HULIS isolation. From these we isolated 6 daytime (labeled as A1, B1, C1 and A2, B2, C2) and 6 night-time HULIS samples (labeled as D1, E1, F1, and D2, E2, F2). In order to have sufficient HULIS mass for subsequent mea-surements, the HULIS extracts labeled with A1, B1, C1 and D1, E1, F1 were combined into one daytime and nighttime sample, respectively. For the combined daytime (A1, B1, C1) and nighttime (D1, E1, F1) samples 10.8 mg and 20.3 mg HULIS were obtained, respectively. The A2, B2, C2 and D2, E2, F2 samples were dedicated to other experiments.
The HULIS were isolated with the one-step procedure de-scribed by Varga et al. (2001) from the filters containing the fine fraction of the aerosol (Dp<2.5 µm). First, the
water-soluble aerosol components were extracted by placing the filters for 24 h in MilliQ water. Then the extract was filtered through a Millipore membrane filter of 0.45 µm pore size and the pH was adjusted to pH=2 with hydrochloric acid.
The separation of HULIS from other dissolved components was performed on an Oasis HLB (1 g) column conditioned with methanol and activated with hydrochloric acid prior to the application of the samples. The HULIS fraction was then eluted with methanol and dried at room temperature.
2.2 Measurement setup and procedure
Figure 1 shows the measurement setup for determination of the optical parameters of the isolated HULIS. For particle generation by a TSI 3076 atomizer, the HULIS extracts were redissolved in acetonitrile (∼0.3 g/l) containing 7% MilliQ
water to ensure complete dissolution. Then the particles
were dried (RH∼26%) and diluted by mixing the atomizer output flow with dry, filtered air. Subsequently, the aerosol
was neutralized by a bipolar charger (63Ni) and passed
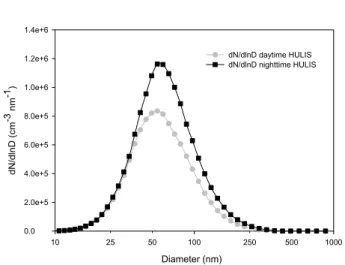
through an impactor (1 µm cutoff diameter) as required for measuring the size distribution of submicron particles with a scanning mobility particle sizer (SMPS; Grimm Model 5.400). The size distributions of the laboratory-generated HULIS particles were lognormally distributed with a geo-metric mean diameter and standard deviation of 53.5±1.5 nm and 1.749±0.009 for the daytime samples, respectively, and 57.4±0.8 nm and 1.739±0.007 for the nighttime samples, re-spectively. A typical number size distribution of the HULIS particles generated from the daytime and nighttime samples is plotted in Fig. 2. For this size range, the performance deterioration of the SMPS due to particle diffusion is neg-ligible and the sizing accuracy is about 3% (Kinney et al., 1991; Heim et al., 2004). For spherical particles, the aerosol volume can be determined from the number concentration (assuming 10% uncertainty) and the volume of the aerosol particles in each size bin (9% = three times the sizing uncer-tainty). For each size bin, the number concentration and the aerosol size are determined by two different devices, namely the CPC and the flow conditions of the SMPS column, re-spectively. Hence, both parameters are independent of each other, i.e. the overall uncertainty in aerosol volume is 13.5%, the quadrature sum of 10 and 9%.
The particulate mass was recorded by a Tapered Element Oscillating Microbalance (TEOM, Rupprecht & Patashnick,
Table 1. Optical (at 532 nm) and physical parameters of HULIS isolated from biomass burning aerosol. Index of refraction, real part Index of refraction, imaginary part Mass absorption coeff. (m2g−1) Mass scattering coeff. (m2g−1) Density (g cm−3) HULIS – day 1.653 0.0019 i 0.031 1.96 1.569 HULIS – night 1.685 0.0016 i 0.029 2.53 1.502
Model 1400a), which was operated at a filter temperature of 30◦C. At this temperature no evaporative losses were
ex-pected for the aged (at least slightly aged) HULIS that was collected at ambient temperatures near or above 30◦C.
The densities of the generated HULIS aerosol particles were calculated from the size distribution and the TEOM measurements. The number concentration of the aerosol was determined for each size bin, and the volume of the aerosols in the size bins was calculated. The calculated volumes were summed up and divided by the mass measured by the TEOM. Assuming a 5% uncertainty for the TEOM, the accuracy of the HULIS density is 14.4%.
The scattering coefficient was measured at a wavelength of 545 nm by an integrating nephelometer (Radiance Research, Model: M903) with an integrated temperature and RH sen-sor. Since this device is non-destructive and has negligible loss of submicron particles (less than 3%), it was operated upstream of the other aerosol devices. The nephelometer
was calibrated with CO2 (Anderson and Ogren, 1998) and
the systematic error due to angular truncation of the view-ing volume in the near forward (0 to 9 degree) and back-ward directions (170 to 180 degree) were corrected based on Mie calculations. Assuming that the angular radiation characteristics of the light source of the Radiance Research 903 nephelometer is similar to the TSI 3563 nephelometer we can estimate the non-Lambertian error to be about –4% for the HULIS particle size distributions encountered here (geometric mean volume diameter ∼140 nm; Anderson and Ogren, 1998) and this uncertainty results in a 1% error in the calculation of the real part of the refractive index. There-fore the non-Lambertian effects are neglected for the purpose of this study. The absorption coefficient was determined at 532 nm by a photoacoustic spectrometer (PAS) described by Schmid et al. (2005). The uncertainty of the absorption co-efficient measured by the PAS is 5%. This was confirmed by calibration with NO2gas (Arnott et al., 2000), and verified
for soot and biomass burning aerosol by comparison with an optical extinction instrument (Schnaiter et al., 2005). Since the operating wavelengths of the PAS and nephelometer are very close to each other (within 13 nm), we neglected the wavelength dependence of the measured parameters within the 13 nm range, therefore we referred our measurements to 532 nm. The experiments were carried out at RH∼26%. One should recall that the isolated HULIS was redissolved in an acetonitrile-water mixture of 13:1. It is critical to make sure
Diameter (nm) 25 50 250 500 10 100 1000 dN/dln D (cm -3 nm -1) 0.0 2.0e+5 4.0e+5 6.0e+5 8.0e+5 1.0e+6 1.2e+6 1.4e+6 dN/dlnD daytime HULIS dN/dlnD nighttime HULIS
Fig. 2. A typical number size distribution of generated HULIS par-ticles obtained from the combined daytime and nighttime samples.
that all solvents volatilize from the particles under these con-ditions. Therefore, we checked whether the particles were in-deed dry in the measurement unit by measuring the size dis-tribution of the generated HULIS particles with and without drying the sheath air in the SMPS system. The calculated val-ues of the densities were basically the same. If the particles had contained solvents, which would have been lost in the dry sheath air, the densities of the particles would have had to be different. Furthermore, according to our best knowledge, acetonitrile and water do not make an azeotropic mixture, which would affect the drying process.
In addition to these on-line experiments, the absorption spectra of aqueous HULIS solutions were recorded by a Shi-madzu UV-160A spectrophotometer from 300 to 700 nm in a 4 cm cell against water. For this purpose, the HULIS samples B2 (daytime) and E2 (nighttime) were used.
2.3 Calculation of Refractive Index
The complex index of refraction is derived from Mie “clo-sure” calculations based on particle size, scattering and ab-sorption measurements. The Mie code used was a modified version of that described by Guyon et al. (2003). Using the measured particle size distribution, the Mie code first takes the refractive index of water (1.33–0i) and calculates the corresponding scattering and absorption coefficients. These
3566 A. Hoffer et al.: Optical properties of humic-like substances
Fig. 3. SEM picture of particles generated by the TSI atomizer from a homogeneous solution of HULIS, which was isolated from the fine fraction of biomass burning aerosol from the Amazon basin.
values are then compared to the observed scattering and ab-sorption coefficients and the imaginary and real part of the re-fractive index are then increased stepwise until the calculated and measured optical coefficients agree to within 0.5%. The only noteworthy difference to the original code described by Guyon et al. (2003) is that in the present study the size dis-tribution is fixed (determined by the SMPS) and does not need to be re-adjusted with refractive index as required for the optically determined size distribution used by Guyon et al. (2003).
In order to obtain information about the morphology of the generated aerosol, we collected particles on gold coated Nuclepore filters for SEM analysis. As shown in Fig. 3, the particles are indeed spherical and thus the application of the Mie code is justified.
In order to estimate the uncertainty of the calculation of the index of refraction we performed a sensitivity study where different input parameters (scattering and absorption coeffi-cient, the number concentration and sizing accuracy) were individually varied, and the so obtained index of refraction was compared with the original one. For these estimations we used 5% uncertainty in the measurement of the absorp-tion and scattering coefficient, and 10% uncertainty in the determination of the number concentration, furthermore 3% uncertainty in the sizing accuracy. The measurement errors in the real part of the index of refraction were 3.7% and that in the imaginary part were 12.5 % (obtained from the quadra-ture sum of the average effects of individual errors).
3 Results
3.1 Absorption properties of HULIS
Table 1 summarizes the experimentally determined optical and physical properties of the HULIS isolated from pyro-genic fine aerosol. Since the fire properties between day and night were different (more smoldering during night and more flaming during daytime) different (optical) properties might be expected for daytime and nighttime HULIS. But contrary to this expectation, it can be seen from these data that there is no statistically significant diel variation in either particle density or the real and imaginary part of the refractive index of the HULIS.
In the literature the imaginary part of the refractive index of BC was found to vary from 0.45 to 1 (Reid et al., 2005, and references therein). However, it is important to note that for biomass-burning aerosol a significantly lower imaginary part is obtained than for pure BC, indicating that soot represents only a minor fraction relative to organic compounds in pyro-genic aerosol. Recently, Guyon et al. (2003) reported 1.41-0.013i for the complex refractive index of ambient aerosols affected by biomass burning. Based on field measurements, D. Chand (personal communication, 2005) obtained 1.47– 1.53 for the real part and 0.01–0.02i for the imaginary part of the refractive index of the very same dry biomass burning aerosol that we used for our experiments. It should be kept in mind that their values refer to the entire fine aerosol, includ-ing its black carbon fraction, whereas our data refer only to the HULIS fraction, a specific subset, which contains most of the light-absorbing organic compounds (Havers, 1998).
For one nighttime sample (E2) we also determined the spectrally resolved imaginary part of the index of refrac-tion of the HULIS with a spectrophotometric method. We recorded the absorption spectra of the HULIS redissolved in water in a 4-cm cell, in order to minimize the baseline noise. Considering the HULIS solution as a bulk material, the index of refraction can be calculated using the equa-tion: −I m(m)=αλ/4π , where α is the absorption coeffi-cient (m−1)and λ is the wavelength (m) (Bohren and Huff-man, 1983; Gelencs´er, 2004). Assuming that the index of refraction is volume additive and the bulk density of HULIS is 1.5 g cm−3, the imaginary part of the index of refraction at 532 nm was calculated to be 0.00184±0.0002 in the HULIS concentration range of 2.37×10⁻²and 7.11×10⁻³g l−1.
In order to validate our on-line method described in Fig. 1, we calculated the scattering coefficient of pure, dry ammo-nium sulfate for the measured size distribution (using the in-dex of refraction given in the literature) and compared with the measured scattering coefficient. We found good agree-ment between the calculated and measured values (<10% difference). Furthermore we measured the index of refrac-tion for water-soluble nigrosin (Aldrich) both with our spec-trophotometric (imaginary part only) and on-line method. The difference in the real part of the refractive index between
the on-line and literature value was about 4 %. With the spec-trophotometric method we obtained almost the same imagi-nary part (0.255) reported in the literature (0.26) by (Pinnick and Auvermann, 1979). But the imaginary refractive index of nigrosin measured with the on-line method (0.1795) was different from that measured in aqueous solution. One ex-planation for this discrepancy might be some water uptake by the nigrosin particles (Pinnick, personal communication). Since there were no diel variations in the imaginary part of the refractive index of HULIS particles, it is obvious that the same holds for the calculated mass absorption coefficients. Its value of 0.03 m2g−1at 532 nm is quite low, at least rel-ative to those of BC reported in the literature (Liousse et al., 1993). One should recall, however, that the mass ab-sorption coefficient obtained for the fine fraction of biomass burning aerosol is not high either (compared to that of the BC), the average value being 0.37 m2g−1at 532 nm (Chand
et al., 2005). Secondly, the mass absorption coefficient of the HULIS increases sharply towards shorter wavelengths, as indicated in Fig. 4 based on the spectrophotometric mea-surements.
In our experiments, the maximum of the number size dis-tribution of the particles was at about 50–60 nm (diameter). Since for slightly absorbing particles (1.67–0.0017i) the cal-culated mass absorption coefficient increases above 100 nm, our value may be considered as a lower limit for absorbing organic aerosol (HULIS) present in ambient fine aerosol.
The relatively high value of the mass scattering coeffi-cients implies that HULIS efficiently scatter light in the vis-ible range. The high value of the single scattering albedo obtained in our measurements (0.98) confirms this finding. Contrary to the absorption properties, the scattering proper-ties seem to be different in HULIS isolated from day and night aerosol samples. The higher mass scattering coeffi-cient of the nighttime HULIS is due to the larger size of the nighttime particles. On the other hand it is known that HULIS may both be a primary aerosol component and be produced in photochemical processes, and the properties of these two components may well be different. The average mass scattering coefficient of biomass burning aerosol from the same sampling site in 2002 September was reported to be 5.3 m2g−1(Chand et al., 2005). Note that the density of the HULIS particles, an important parameter in calculations dealing with the role of HULIS in cloud formation, does not show diel variation.
3.2 Contribution of HULIS to light absorption in the visible range
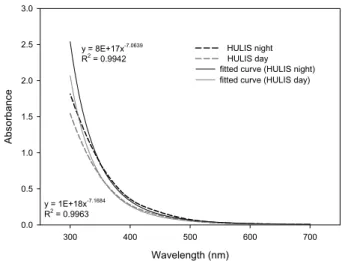
Figure 4 shows the absorption spectra of HULIS isolated from day and night aerosol samples. Fitting power-law func-tions to the measured spectra reveals that the ˚Angstr¨om expo-nents are similar, and that in both cases absorption is overes-timated by the power-law relationship below about 350 nm. The ˚Angstr¨om exponent (˚a) for absorption can be
calcu-Wavelength (nm) 300 400 500 600 700 Ab so rb an ce 0.0 0.5 1.0 1.5 2.0 2.5 3.0 y = 8E+17x-7.0639 R2 = 0.9942 y = 1E+18x-7.1684 R2 = 0.9963 HULIS night HULIS day fitted curve (HULIS day) fitted curve (HULIS night)
Fig. 4. The absorption spectra of HULIS isolated from day and night aerosol samples measured with a Shimadzu UV-160A spec-trophotometer.
lated for any range using the following equation (Reid et al., 2005):
˚aλ1,λ2 = −ln(A1/A2)/ln(λ1/λ2),
where A1 and A2 are the absorbances measured at
wave-lengths λ1and λ2, respectively. Using this equation we
ob-tain 6.4 and 6.8 for the absorption ˚Angstr¨om exponents of HULIS in day and night samples, respectively, in the wave-length range of 300–700 nm. Since ˚a has a marked influ-ence on the calculated absorption properties at shorter wave-lengths, in our calculations we used two extreme values: 6 and 7. It is important to note that Kirchstetter et al. (2004) obtained similar results (5.9, derived from their data) for the acetone soluble organic carbon in the range between 350 and 650 nm.
In this section the relative contribution of HULIS to light absorption in the visible will be estimated for typical con-ditions observed in the biomass burning period in Rondˆonia during the SMOCC campaign. For the calculations, the ab-sorption parameters of HULIS isolated from daytime sam-ples are used. Based on our measurements, the absorption coefficient of HULIS generated in the lab is 0.031 m2g−1at 532 nm (see Table 1). Using the power-law relationship, the mass absorption coefficient of HULIS can be estimated for any wavelength, keeping in mind that this value is a lower limit for the ambient HULIS particles for two reasons: 1) The absorption cross section increases with particle size and our measurements were performed for 50 nm particles, while for atmospheric conditions bigger particles are more real-istic (Rissler et al., 2006). 2) The wavelength dependence of absorption is enhanced in the aerosol phase compared to the bulk phase value measured here (infinitely large diame-ter) (Bond, 2001). According to our preliminary measure-ments we assumed an organic mass-to-carbon ratio of 1.9
3568 A. Hoffer et al.: Optical properties of humic-like substances Wavelength (nm) 300 400 500 600 700 Ma ss abso rpt io n coeff icient of HUL IS -C (m 2 g -1) 0 1 2 3 4 Mass a bsorpt ion coef ficient of soot (m 2 g -1) 4 6 8 10 12 14
Fig. 5. The estimated wavelength-dependence of the (carbon) mass absorption coefficient of soot (upper line) and HULIS (lower trace: ˚a=6, upper trace ˚a=7).
for HULIS in order to calculate the HULIS-contribution to the absorption on a carbon mass basis. The same mass-to-carbon ratio was found for the same fraction of the WSOC from a rural site (Kiss et al., 2002). We also assumed that the mass-to-carbon ratio of BC equals to 1.
Figure 5 shows the wavelength dependence of the mass absorption coefficient of BC and that of the HULIS between 300 and 700 nm, using lower and upper estimates of the ab-sorption ˚Angstr¨om exponents of 6 and 7 as realistic lower and upper bounds, respectively. The mass absorption coeffi-cient of soot was taken from the literature using the data re-ported by Schnaiter et al. (2003). We used the value of 1.056 derived from the data reported in this article for the ˚Angstr¨om exponent of diesel soot. We assumed that the average fine TC concentration during the biomass-burning dominated part of
the LBA-SMOCC campaign is 42.7 µg m−3 (Hoffer et al.,
2005), and that 10% of the TC is BC with the same optical properties as reported for Diesel soot reported by Schnaiter and coworkers (2003). Furthermore, based on our prelimi-nary chemical analysis of biomass burning aerosols from the LBA-SMOCC campaign we assumed that 35% by mass of TC represents the HULIS carbon fraction. The relative con-tribution of HULIS-carbon to the absorption can now be cal-culated using the mass absorption coefficients and the mass concentrations of soot and HULIS.
As we can see from Fig. 6, the contribution of HULIS to light absorption of Amazonian biomass burning aerosol is only a few percent at 532 nm, and decreases continuously to-wards longer wavelengths. Near the photochemically most active range, however, the absorption of organic compounds becomes significant relative to that of BC. For instance, at 300 nm, 35–50% of absorption may be attributed to HULIS. It should be noted that HULIS may be formed in photochem-ical reactions (Gelencs´er et al., 2003; Hoffer et al., 2005), and since light-absorbing HULIS may also initiate the formation of OH and HO2radicals (Anastasio et al., 1994) a positive
Wavelength (nm) 300 400 500 600 700 Ab so rp tion b y HU LIS (%) 0 10 20 30 40 50 60
Fig. 6. Estimated relative contribution of HULIS to light absorption in biomass burning aerosol (lower trace: ˚a=6, upper trace ˚a=7).
feedback mechanism is set up which could make the process particularly effective in the troposphere.
When integrating the contribution of HULIS to light ab-sorption across the solar spectrum to asses their significance for the atmospheric radiation budget, lower total contribu-tions are obtained. For a scale height of 3000 m, assuming the same concentrations and composition of biomass burn-ing aerosol as before, the fraction of solar energy (between 300 and 700 nm) absorbed by organic compounds (HULIS) is 8.5 and 11.5% for ˚a=6 and 7, respectively. In the 300– 1200 nm range, the corresponding values are 6.4 and 8.6%. It is noteworthy that, even if we take 4 as the most conser-vative estimate for the ˚Angstr¨om exponent of the HULIS, their contribution to absorption is still about 5% in the visi-ble range, and about 3.9% in entire tropospherically relevant solar spectrum (300–1200 nm).
4 Conclusions
The absorption properties of the humic-like substances (HULIS) isolated from biomass burning aerosols were the same in day and nighttime samples. While the single scat-tering albedo of pure HULIS particles of about 50–60 nm di-ameter is high, about 0.98 at 532 nm, they still absorb light rather effectively in the UV and visible range. Hence, due to the strong spectral dependence of light absorption by HULIS (absorption ˚Angstr¨om exponent ∼6.5) and due to the ele-vated amount of HULIS in biomass burning aerosol, a sig-nificant fraction of the light is absorbed by HULIS at shorter wavelengths. For instance, during the biomass burning pe-riod in the LBA-SMOCC campaign, up to 50% of the light absorption (at 300 nm) by aerosols in our study region in the Amazon basin is caused by (water-soluble) HULIS. Since the intensity maximum of the tropospherically relevant solar spectrum is at higher wavelengths, however, the contribution
of the HULIS to the absorption over the entire spectrum is about 7%. Consequently the HULIS could have an active role in the radiative transfer and in photochemical processes. In addition, HULIS could at least partially account for the up to now unexplained fraction of light absorption observed in the troposphere.
Acknowledgements. This work was carried out within the frame-work of the Smoke, Aerosols, Clouds, Rainfall, and Climate (SMOCC) project, a European contribution to the Large-Scale Biosphere-Atmosphere Experiment in Amazonia (LBA). The authors gratefully acknowledge financial support by the European Commission (contract No. EVK2-CT-2001-00110 SMOCC) and by the Max Planck Society. We are thankful to all members of the LBA-SMOCC and LBA-RACCI Science Teams for their support during the field campaign, in particular J. von Jouanne and A. Camargo for their support in setting up the sampling location. We are thankful to the Hungarian Science Foundation (OTKA T/F043578, OTKA PF63770) for its financial support and to K. Gall´o-B´ekefi for the preparation of the HULIS samples. We are thankful to Joachim Huth and Patience Gwaze for the SEM images. Edited by: D. Rosenfeld
References
Andreae, M. O., Rosenfeld, D., Artaxo, P., Costa, A. A., Frank, G. P., Longo, K. M., and Silva-Dias, M. A. F.: Smoking rain clouds over the Amazon, Science, 303, 1337–1342, 2004.
Anastasio, C., Faust, B. C., and Allen, J. M.: Aqueous-Phase Pho-tochemical Formation of Hydrogen-Peroxide in Authentic Cloud Waters, J. Geophys. Res.-Atmos., 99, 8231–8248, 1994. Anderson, T. L. and J. A. Ogren.: Determining aerosol radiative
properties using the TSI 3563 integrating nephelometer, Aerosol Sci. Technol., 29(1), 57–69, 1998.
Andreae, M. O., Artaxo, P., Brandao, C., Carswell, F. E., Cic-cioli, P., da Costa, A. L., Culf, A. D., Esteves, J. L., Gash, J. H. C., Grace, J., Kabat, P., Lelieveld, J., Malhi, Y., Manzi, A. O., Meixner, F. X., Nobre, A. D., Nobre, C., Ruivo, M., Silva-Dias, M. A., Stefani, P., Valentini, R., von Jouanne, J., and Waterloo, M. J.: Biogeochemical cycling of carbon, wa-ter, energy, trace gases, and aerosols in Amazonia: The LBA-EUSTACH experiments, J. Geophys. Res.-Atmos., 107, 8066, doi:10.1029/2001JD000524, 2002.
Arnott, W. P., Moosm¨uller, H., and Walker, J. W.: Nitrogen diox-ide and kerosene-flame soot calibration of photoacoustic instru-ments for measurement of light absorption by aerosols, Rev. Sci. Instrum., 71, 4545–4552, 2000.
Artaxo, P., Martins, J. V., Yamasoe, M. A., Procopio, A. S., Pauliquevis, T. M., Andreae, M. O., Guyon, P., Gatti, L. V., and Leal, A. M. C.: Physical and chemical prop-erties of aerosols in the wet and dry seasons in Rondo-nia, AmazoRondo-nia, J. Geophys. Res.-Atmos., 107(D20), 8081, doi:10.1029/2001JD000666, 2002.
Bohren, C. F. and Huffman, D. R.: Absorption an Scattering of Light by Small Particles. Wiley Interscience, New York, 1983.
Bond, T. C.: Spectral dependence of visible light absorption by carbonaceous particles emitted from coal combustion, Geophys. Res. Lett., 28, 4075–4078, 2001.
Chand, D., Guyon, P., Artaxo, P., Schmid, O., Frank, G. P., Rizzo, L. V., Mayol-Bracero, O. L., Gatti, L. V., and Andreae, M. O.: Optical and physical properties of aerosols in the boundary layer and free troposphere over the Amazon Basin during the biomass burning season, Atmos. Chem. Phys., 6, 2911–2925, 2006, http://www.atmos-chem-phys.net/6/2911/2006/.
Decesari, S., Fuzzi, S., Facchini, M. C., Mircea, M., Emblico, L., Cavalli, F., Maenhaut, W., Chi, X., Schkolnik, G., Falkovich, A., Rudich, Y., Claeys, M., Pashynska, V., Vas, G., Kourtchev, I., Vermeylen, R., Hoffer, A., Andreae, M. O., Tagliavini, E., Moretti, F., and Artaxo, P.: Characterization of the organic com-position of aerosols from Rondˆonia, Brazil, during the LBA-SMOCC 2002 experiment and its representation through model compounds, Atmos. Chem. Phys., 6, 375–402, 2006,
http://www.atmos-chem-phys.net/6/375/2006/.
Gelencs´er, A., Hoffer, A., Kiss, G., Tomb´acz, E., Kurdi, R., and Bencze, L.: In-situ formation of light-absorbing organic matter in cloud water, J. Atmos. Chem., 45, 25–33, 2003.
Gelencs´er, A.: Carbonaceous Aerosol. Springer, Dordrecht, 2004. Guyon, P., Boucher, O., Graham, B., Beck, J., Mayol-Bracero, O.
L., Roberts, G. C., Maenhaut, W., Artaxo, P., and Andreae, M. O.: Refractive index of aerosol particles over the Amazon trop-ical forest during LBA-EUSTACH 1999, J. Aerosol. Sci., 34, 883–907, 2003.
Havers, N., Burba, P., Lambert, J., and Klockow, D.: Spectroscopic characterization of humic-like substances in airborne particulate matter, J. Atmos. Chem., 29, 45–54, 1998.
Heim, M., Kasper, G., Reischl, G. P., and Gerhart, C.: Performance of a new commercial electrical mobility spectrometer, Aerosol Sci. Technol., 38, 3–14, doi:10.1080/02786820490519252, 2004.
Hoffer, A., Gelencs´er, A., Blazs´o, M., Guyon, P., Artaxo, P., and Andreae, M. O.: Diel and seasonal variations in the chemical composition of biomass burning aerosol, Atmos. Chem. Phys., 6, 3505–3515, 2006,
http://www.atmos-chem-phys.net/6/3505/2006/.
Kinney, P. D., Pui, D. Y. H., Mulholland, G. W., and Bryner, N. P.: Use of the Electrostatic Classification Method to Size 0.1 Mu-M Srm Particles – a Feasibility Study, J. Res. Natl. Inst. Stand. Technol., 96, 147–176, 1991.
Kirchstetter, T. W., Novakov, T., and Hobbs, P. V.: Evidence that the spectral dependence of light absorption by aerosols is affected by organic carbon, J. Geophys. Res.-Atmos., 109, D21208, doi:10.1029/2004JD004999, 2004.
Kiss, G., Varga, B., Galambos, I., and Ganszky, I.: Charac-terization of water-soluble organic matter isolated from atmo-spheric fine aerosol, J. Geophys. Res.-Atmos., 107(D21), 8339, doi:10.1029/2001JD000603, 2002.
Liousse, C., Cachier, H., and Jennings, S. G.: Optical and thermal measurements of black carbon aerosol content in different en-vironments – variation of the specific attenuation cross-section, sigma, Atmos. Environ., 27(8), 1203–1211, 1993.
Pinnick, R. G. and Auvermann, H. J.: Response Characteristics of Knollenberg Light-Scattering Aerosol Counters, J. Aerosol. Sci., 10, 55–74, 1979.
3570 A. Hoffer et al.: Optical properties of humic-like substances O., Eleuterio, D. P., Holben, B. N., Reid, E. A., and Zhang, J.:
A review of biomass burning emissions part III: intensive optical properties of biomass burning particles, Atmos. Chem. Phys., 5, 827–849, 2005,
http://www.atmos-chem-phys.net/5/827/2005/.
Rissler, J., Vestin, A., Swietlicki, E., Fisch, G., Zhou, J., Artaxo, P., and Andreae, M. O.: Size distribution and hygroscopic prop-erties of aerosol particles from dry-season biomass burning in Amazonia, Atmos. Chem. Phys., 6, 471–491, 2006,
http://www.atmos-chem-phys.net/6/471/2006/.
Schmid, O., Artaxo, P., Arnott, W. P., Chand, D., Gatti, L. V., Frank, G. P., Hoffer, A., Schnaiter, M., and Andreae, M. O.: Spectral light absorption by ambient aerosols influenced by biomass burn-ing in the Amazon Basin. I: Comparison and field calibration of absorption measurement techniques, Atmos. Chem. Phys., 6, 3443–3462, 2006,
http://www.atmos-chem-phys.net/6/3443/2006/.
Schnaiter, M., Horvath, H., Mohler, O., Naumann, K. H., Saathoff, H., and Schock, O. W.: UV-VIS-NIR spectral optical properties of soot and soot-containing aerosols, J. Aerosol. Sci., 34, 1421– 1444, 2003.
Schnaiter, M., Schmid, O., Petzold, A., Fritzsche, L., Klein, K. F., Andreae, M. O., Helas, G., Thielmann, A., Gimmler, M., Mohler, O. M., Linke, C., and Schurath, U.: Measurement of wavelength-resolved light absorption by aerosols utilizing a UV-VIS extinc-tion cell, Aerosol Sci. Technol., 39, 249–260, 2005.
Solomon, P. A., Moyers, J. L., and Fletcher, R. A.: High-volume dichotomous virtual impactor for the fractionation and collection of particles according to aerodynamic size, Aerosol Sci. Tech-nol., 2, 455–464, 1983.
Varga, B., Kiss, G., Ganszky, I., Gelencs´er, A., and Krivacsy, Z.: Isolation of water-soluble organic matter from atmospheric aerosol, Talanta, 55, 561–572, 2001.