HAL Id: hal-00022869
https://hal-insu.archives-ouvertes.fr/hal-00022869
Submitted on 31 May 2006
HAL is a multi-disciplinary open access archive for the deposit and dissemination of sci-entific research documents, whether they are pub-lished or not. The documents may come from teaching and research institutions in France or abroad, or from public or private research centers.
L’archive ouverte pluridisciplinaire HAL, est destinée au dépôt et à la diffusion de documents scientifiques de niveau recherche, publiés ou non, émanant des établissements d’enseignement et de recherche français ou étrangers, des laboratoires publics ou privés.
Thermal constraints on the emplacement rate of e large
intrusive complex : the Manaslu Leucogranite, Nepal
Himalaya.
Catherine Annen, Bruno Scaillet, R.S.J. Sparks
To cite this version:
Catherine Annen, Bruno Scaillet, R.S.J. Sparks. Thermal constraints on the emplacement rate of e large intrusive complex : the Manaslu Leucogranite, Nepal Himalaya.. Journal of Petrology, Oxford University Press (OUP), 2006, 47, pp.71-95. �10.1093/petrology/egi068�. �hal-00022869�
Thermal Constraints on the Emplacement Rate of a Large
Intrusive Complex: The Manaslu Leucogranite, Nepal
Himalaya.
C. ANNEN
1*, B. SCAILLET
2AND R. S. J. SPARKS
31 SECTION DES SCIENCES DE LA TERRE, UNIVERSITE DE GENEVE, 13 RUE DES MARAICHERS, 1205 GENEVE, SWITZERLAND
2 INSTITUT DES SCIENCES DE LA TERRE D’ORLEANS, UMR 6113 CNRS-UO, 1A RUE DE LA FEROLLERIE, 45071 ORLE´ANS CEDEX 2, FRANCE
3 DEPARTMENT OF EARTH SCIENCES, UNIVERSITY OF BRISTOL, WILLS MEMORIAL BUILDING, QUEENS ROAD, BRISTOL BS8 1RJ, UK
KEY WORDS : granite emplacement; heat transfer modelling; High Himalayan Leucogranite; Manaslu; thermal aureole
The emplacement of the Manaslu leucogranite body (Nepal, Himalaya) has been modelled as the accretion of successive sills. The leucogranite is characterized by isotopic heterogeneities suggesting limited magma convection, and by a thin (<100 m) upper thermal aureole. These characteristics were used to constrain the maximum magma emplacement rate. Models were tested with sills injected regularly over the whole duration of emplacement and with two emplacement sequences separated by a repose period. Additionally, the hypothesis of a tectonic top contact, with unroofing limiting heat transfer during magma emplacement, was evaluated. In this latter case, the upper limit for the emplacement rate was estimated at 3-4 mm/year (or 1-5 Myr for 5 km of granite). Geological and thermobarometric data, however, argue against a major role of fault activity in magma cooling during the leucogranite emplacement. The best model in agreement with available geochronological data suggests an emplacement rate of 1 mm/year for a relatively shallow level of emplacement (granite top at 10 km), uninterrupted by a long repose period. The thermal aureole temperature and thickness, and the isotopic heterogeneities within the leucogranite, can be explained by the accretion of 20–60 m thick sills intruded every 20 000–60 000 years over a period of 5Myr. Under such conditions, the thermal effects of granite intrusion on the underlying rocks appear limited and cannot be invoked as a cause for the formation of migmatites.
INTRODUCTION
The melting of continental crust can be achieved via two fundamental mechanisms: either by advective heating resulting from basalt underplating or intrusion (Huppert & Sparks, 1988; Bergantz, 1989; Raia & Spera, 1997) or via thickening of crust rich in heat-producing elements (England & Thompson, 1984), assisted or not by shear heating (Le Fort, 1975; England et al., 1992; Harrison et al., 1998) or isothermal decompression (Harris & Massey, 1994). The Himalaya range is a collisional belt characterized by the production of crustal melts without the involvement of basalt (Le Fort et al., 1987). Thus, it is a place where models belonging to the second category can be investigated.
Study of the High and North Himalayan Leucogranites (HHL and NHL) has been pivotal for understanding the structural and thermal evolution of thickened crust in collisional settings. The HHL are generally located on top of a high-grade metamorphic unit—the Precambrian Higher Himalayan Crystallines (HHC)—which forms the backbone of the range, and below a thick Paleozoic to Mesozoic sedimentary sequence, termed the Tethyan Sedimentary Series (TSS). The HHC is truncated at its base by the Main Central Thrust (MCT), a 10 km thick shear zone that has accommodated part of the Himalayan Miocene–Pliocene shortening. The top of the HHC is defined by the South Tibetan Detachment (STD), a low-dipping extensional, ductile to brittle crustal-scale shear zone that is believed to have been episodically active since the Miocene, perhaps in response to gravitational instability of the Himalayan topographic front (Burg et al., 1984; Royden & Burchfiel, 1985). The HHC is believed to have been extruded by simultaneous motion along the MCT and STD (Hodges et al., 1992). The HHL may be related to the development of either the MCT or STD and their dating has been used to constrain the age of fault movement (Guillot et al., 1994; Coleman, 1998; Dezes et al., 1999; Murphy & Harrison, 1999). Geochronological data show that most of the HHL were produced in the time interval 24–19 Ma (Harrison et al., 1999b). The onset of the India–Tibet collision is dated at _55Ma in the west of the range (Rowley, 1996; Guillot et al., 2003), with a probable younging eastward because of the obliquity of convergence between India and Tibet. The time lag of 20–30 Myr between crustal thrust stacking and crustal melting is significantly shorter than results from numerical simulations of the thermal evolution of the thickened crust, which predict that melting occurs some 50 Myr after thickening (England & Thompson, 1984). Therefore, modelling studies on the thermal evolution of the Himalayan orogenic belt have looked for either additional sources of heat, or alternative mechanisms of crustal melting, to explain the time lag and its relationship to the tectonometamorphic evolution of the orogen, in particular the well-known inverted metamorphic gradient that affects the HHC (Molnar et al., 1983; Pinet & Jaupart, 1987; England et al., 1992; Henry et al., 1997; Harrison et al., 1998, 1999a). Alternative mechanisms include shear heating (England et al., 1992; Harrison et al., 1998), accretion of radiogenic crustal layers (Huerta et al., 1999; Guillot & Allemand, 2002), thermal conductivity contrast between the crystalline basement and its sedimentary cover (Pinet & Jaupart, 1987), large-scale fluid infiltration that lowers the melting point of overthrust terranes (Le Fort, 1975), slab break-off during collision (Kohn & Parkinson, 2002) and fast decompression of hot metamorphic rocks (Harris & Massey, 1994). Although differing in many respects, most recent models propose that both compressional and extensional faults exert a central role in the orographic development of the orogen (Harris & Massey, 1994; Grujic et al., 1996; Nelson et al., 1996; Beaumont
et al., 2001; Vannay & Grasemann, 2001). Recent studies suggest that exhumation of HHC results from the competing effects of the ductile extrusion of a crustal channel (HHC), bounded by low-angle normal (STD) and thrust (MCT) faults. Focused surface denudation (erosion) is localized at the southern edge of the Tibetan Plateau (i.e. the Himalaya). This hypothesis requires that both MCT and SDT detachments were simultaneously active. Several geophysical surveys have indicated the presence of partial melt in the Tibetan middle crust, immediately north of the Himayalan range (Pham et al., 1986; Brown et al., 1996; Nelson et al., 1996), which has led to the suggestion that the Himalaya range could correspond to the southward extrusion of the partially molten crust underlying southern Tibet, and that contemporary melting beneath south Tibet could be the continuation of the dynamical processes that formed the HHL during the Miocene (Wu et al., 1998; Hodges et al., 2001; Beaumont et al., 2004). This channel flow model seeks to unify geological, geochronological and geophysical observations gathered in the Himalayan–Tibetan area (Hodges et al., 2001; Beaumont et al., 2004). Interest in the tectonic exhumation concept has also been triggered by the suggestion that production of high reliefs, following the India–Tibet collision, could have affected global climate (Raymo & Ruddiman, 1992). Abrupt changes in world seawater chemistry in the Miocene (Edmond, 1992; Harris et al., 1995), as well as the sedimentary record of the Bengal Fan (France-Lanord et al., 1993), have been explained by Miocene land exposure and subsequent erosion of HHC and HHL rocks. Because Himalayan metamorphism and magmatism are essentially Miocene in age, their exhumation during the Miocene requires a fast mechanism of rock uplift. Tectonic unroofing of thermally weakened (i.e. partially melted) crust is commonly advocated (Hodges et al., 1998; Searle & Godin, 2003). However, the mechanisms leading to crustal melting, as well as the role of partial melt in the development of the Himalayan orogen, are still controversial (Harrison et al., 1999a). It is still unclear to what extent crustal melting is related to crustal faults and, if so, whether it is the cause or the consequence of crustal-scale compressional (MCT) or extensional (STD) faulting. Both the orogenic wedge (e.g. Harris & Massey, 1994) and channel flow (e.g. Beaumont et al., 2004) models require that motions on both the MCT and STD were broadly contemporaneous with the formation of the HHL. Although available timing constraints are consistent with this idea, it is not the only possibility (Murphy & Harrison, 1999). Models that do not invoke normal faulting can also reproduce the principal tectono-metamorphic and geochronological constraints of the Himalaya (Harrison et al., 1998). In this study, we model the thermal evolution of individual leucogranite bodies to constrain emplacement rates of the HHL plutons. From inferred emplacement rates, the residence time of anatectic melts in their source regions can be constrained. The study also sheds light on the potential role of extensional faulting on crustal magmatism, as coeval STD slip and HHL emplacement should affect the cooling regime of the HHL. Our model only concerns the period of pluton emplacement. We combine these results with fluid dynamic considerations to constrain the conditions under which HHL cooling could be achieved in a purely conductive regime. The geochemical characteristics of the HHL suggest emplacement with no large-scale convection within the magma bodies (Deniel et al., 1987). Modelling the thermal evolution of the HHL plutons is relevant to the following Himalayan issues. (1) We explore heat advection within the Himalayan crust to test whether the increase in degree of migmatization observed up-section in the HHC (i.e. the so-called inverse
metamorphism) could be a result of HHL intrusion, as has been proposed in Bhutan by Davidson et al. (1997).
(2) The HHL have been alternatively interpreted as plutons emplaced in situ close to their level of production (Visona & Lombardo, 2002), and as intrusive bodies in cold upper crust detached from their source, with vertical transport distances of ~8–10 km (Copeland et al., 1990; Inger & Harris, 1992; Guillot et al., 1995b; Scaillet et al., 1996; Walker et al., 1999). The level of pluton intrusion has a major impact on its subsequent thermal evolution (Davidson et al., 1992), and our modelling results aim to distinguish between these hypotheses.
(3) Our model provides a framework for interpreting geochronological data for the HHL, which have been difficult to date accurately. Progress has been made with ion probe studies (Harrison et al., 1999b). However, the accessory minerals used for dating can be inherited (Copeland et al., 1988), so even these methods are not straightforward (Harrison et al., 1999b).
General modelling approach
Our thermal models place constraints on the emplacement of granite intrusions. We apply the model results to the Manaslu leucogranite, the best known of the HHL (Le Fort et al., 1987; France-Lanord et al., 1988; Guillot et al., 1995a). As a result of the highly dissected nature of the Himalaya range, field observations provide a continuous record of the nature of the host rocks of the HHL, both above and beneath the intrusions, down to levels where crustal melting occurred. These data, combined with the wealth of geological, petrological and geochemical data summarized below, place tight constraints on key parameters that affect the thermal evolution of the cooling plutons, including the P–T–H2O conditions of the magma and its surroundings during injection and the country
rock properties.
Geological and geophysical data indicate that many granitic plutons, including the HHL, are tabular, lowaspect ratio bodies fed by thin vertical conduits (Le Fort, 1981; Scaillet et al., 1995a; McCaffrey & Petford, 1997; Cruden, 1998; Searle, 1999; Petford et al., 2000; Haederle & Atherton, 2002). Field observations combined with detailed isotopic studies suggest that the HHL are an amalgamation of numerous accreted intrusions (Deniel et al., 1987), as has been inferred for many other plutons (Evans et al., 1993; Wiebe & Collins, 1998; Glazner et al., 2004). The basic modelling concept is the successive emplacement of numerous thin sills, which grow into a large granite intrusion. The intrusions are sufficiently wide in comparison to their thickness that a 1-D model can be justified. We have modelled the heat transfer between the growing intrusion and its country rocks. Our objective is to constrain the thermal regime that leads to the emplacement of a lensoid igneous body several kilometres wide in the upper crust that, once solidified, is characterized by two critical features: (1) a strong Sr-isotopic heterogeneity that precludes wholesale convection causing magma mixing and homogenization; (2) a thin, no more than 100m thick, top contact aureole.
THE MANASLU LEUCOGRANITE AND ITS HOST ROCKS Bottom and top host rocks
Fig. 1. Generalized geological map of the Manaslu area in central Nepal, after Colchen et al. (1986), and NE–SW cross-section of the High Himalayan range showing the main geological units discussed in the text (adapted from Colchen et al., 1986). Only the main lithological units are shown, together with the position of the Main Central Thrust (MCT). On the map, other tectonic contacts (STD) are omitted for clarity. On the cross-section, two positions for the South Tibetan Detachment (STD) are shown: STD (1) is according to Guillot et al. (1993) (i.e. below the pluton); STD(2) is according to Searle & Godin (2003) (above the pluton). M, Manaslu peak; A, Annapurna peak.
The Manaslu pluton is exposed in central Nepal, covers an area of 400 km2 and has an estimated volume of 3000 km3 (Le Fort et al., 1987). It is a laccolithic-shaped body with a thickness of up to 5–6 km and a lateral extent of 30–40 km (Fig. 1). The Manaslu pluton is located on top of the HHC, which is here divided into three sub-units of variable thickness: FI, FII and FIII (Colchen et al., 1986). The basal unit, FI (thickness 2–10 km), is made of alternating metapelitic and metagreywacke gneisses metamorphosed within kyanite (bottom) to sillimanite (top) grades. FI is truncated at its base by the Main Central Thrust (Fig. 1). Migmatization is prominent in F1 and increases upsection
(Barbey et al., 1996; Coleman, 1998). U–Pb geochronology on monazite and zircon gives migmatization ages of 18–22_5Ma for FI migmatites (Hodges et al., 1996; Coleman, 1998). The FI unit is overlain by the FII unit of calcic gneisses; this is up to 3.5 km thick but displays strong lateral variations in thickness (Fig. 1). The FIII unit is made of variably migmatized porphyritic orthogneisses, 1 km thick, that are interpreted as the metamorphosed equivalent of Cambro-Ordovician metaluminous to weakly peraluminous granites occurring in the Lesser Himalaya (Le Fort, 1986). U–Pb dating of monazite suggests that the age of migmatization of the FIII orthogneisses is older than the FI migmatites, at around 36 Ma, or early Oligocene (Hodges et al., 1996; Coleman, 1998). Themobarometric studies have shown that peak metamorphic pressures at the base of the HHC (close to the MCT) are in the range 8–10 kbar, and decrease regularly upsection down to about 5 kbar at the top of the HHC (Pecher, 1989; Coleman & Hodges, 1998; Guillot, 1999; Macfarlane, 1999). Peak temperature varies between 580 and 700°C within the HHC in this area (Pecher, 1989; Coleman & Hodges, 1998; Guillot, 1999; Macfarlane, 1999).
Temperatures up to 800°C have been estimated along other transects, such as in the Langtang section, some 75 km west of Manaslu (Inger & Harris, 1992), whereas other studies suggest a maximum temperature of 750°C even in rocks that are partially melted (Ayres & Harris, 1997; Harris et al., 2004). However, these thermobarometric constraints provide only minimum temperatures, as the metamorphic grade increases northward. Thus, peak temperatures reached in the source region of the HHL, which is presumably located beneath the HHL or further north, must be somewhat higher than those recorded in more distal (i.e. southward) sections of the HHC thrust sheet. Overlying the HHC is the Tethyan (or Tibetan) sedimentary series (TSS), which forms a near-continuous, weakly to non-metamorphosed, Paleozoic to Mesozoic (up to the Cretaceous) sequence, in which MgO-poor limestones dominate over sandstones and shales (Colchen et al., 1986). The top of the granite is in contact with progressively higher stratigraphic units westward, from lower Paleozoic levels up to Upper Triassic shales in the middle part of the lens (Fig. 1). The restored thickness of the sedimentary sequence in the area of the Manaslu pluton reaches 11 km (Colchen et al., 1986). However, these thermobarometric constraints provide only minimum temperatures, as the metamorphic grade increases northward. Thus, peak temperatures reached in the source region of the HHL, which is presumably located beneath the HHL or further north, must be somewhat higher than those recorded in more distal (i.e. southward) sections of the HHC thrust sheet. Overlying the HHC is the Tethyan (or Tibetan) sedimentary series (TSS), which forms a near-continuous, weakly to non-metamorphosed, Paleozoic to Mesozoic (up to the Cretaceous) sequence, in which MgO-poor limestones dominate over sandstones and shales (Colchen et al., 1986). The top of the granite is in contact with progressively higher stratigraphic units westward, from lower Paleozoic levels up to Upper Triassic shales in the middle part of the lens (Fig. 1). The restored thickness of the sedimentary sequence in the area of the Manaslu pluton reaches 11 km (Colchen et al., 1986). However, Tertiary folding or nappe emplacement prior to granite intrusion is believed to have significantly increased the overburden depth at the time of granite emplacement (Guillot et al., 1995a).
Top contact
The exact location of the STD is contentious in the Manaslu area (Coleman, 1996; Searle & Godin, 2003). Some workers (Caby et al., 1983; Pecher, 1989, 1991; Coleman, 1998) consider that the STD lies structurally below the Manaslu pluton, which has a top intrusive contact, whereas others (Searle & Godin, 2003) consider that the STD lies above the granite, as most often observed, and view the top contact of the granite as a tectonic one. For Guillot and collaborators (Guillot, 1993; Guillot et al., 1993, 1995a), the normal shearing observed at the Manaslu top contact is local and related to the ballooning effect of the intrusion process. Given the importance of this contact for the purpose of thermal modelling, we review the observations pertinent to these alternative interpretations. Le Fort (1981), Colchen et al. (1986) and Guillot et al. (1993, 1995a) reported that the top of the pluton develops a thin metamorphic aureole whose thickness depends on the lithology of the local host rocks. At limestone contacts, the aureole only extends 2–3m and is marked by clusters of radiating wollastonite (Colchen et al., 1986). At sandstone or shale contacts, the aureole is 30–50m thick, and the sedimentary rocks are transformed into muscovite–garnet quartzite and biotite–muscovite–garnet–staurolite micaschists, respectively (Colchen et al., 1986). Thermobarometric studies of the contact metamorphic conditions yielded P-T conditions of 3–4 kbar/550 ±40°C for the top of the pluton and 5–6 kbar/580 ± 40°C for the base, in agreement with P-T conditions estimated for the top part of the HHC (Guillot, 1999; Macfarlane, 1999). The difference in barometric estimates between the top and the bottom of the pluton is in good agreement with the lithostatic pressure difference of ~2 kbar, corresponding to the structural thickness of the pluton of 5–6 km (Guillot et al., 1995a). In addition, Ar–Ar ages of minerals in the top aureole (Guillot et al., 1994) are similar to the ages of the nearby leucogranite (Copeland et al., 1990). However, Searle & Godin (2003), working on the northwestern part of the Manaslu area, observed a 400m thick shear zone of high-strain mylonites structurally above the pluton, with the upper part displaced to the north. This shear zone is reported to wrap around the northern contact of the pluton, although Searle & Godin (2003) explored only three valley transects west of the pluton, and extrapolated the shear zone eastward to the area in which Guillot et al. (1995a) worked. We have no reasons to dismiss the general structural interpretation of Searle & Godin (2003). However, the field and petrological observations of the topmost contact by Guillot et al. (1993, 1995a) cannot be discounted either: in particular, the very thin aureole described in the limestone layers, the presence of host rock xenoliths in the granite (see photo 54 of Colchen et al., 1986), and the age correspondence between the leucogranite and its host rock all suggest that in this area, the intrusive relationship of the granite has been locally preserved and that the P-T conditions derived by Guillot et al. (1995a, 1995b) reflect the conditions of aureole metamorphism. In the eastern area, where the contact aureole has been studied, the STD does not occur at the granite contact, suggesting that the tectonic boundary is located further north than shown in the map of Searle & Godin (2003). Geochronological data constrain fault movement along the STD in the interval 14–17 Ma (Harrison et al., 1999a), making the STD younger that the Manaslu crystallization age of 19–24Ma (Coleman, 1998; Harrison et al., 1999b). In addition, although detailed structural studies of large HHL are scarce, those available, including at Manaslu, have shown that the large plutons are, in general, characterized by the absence of strong penetrative deformation, which led early workers to infer the late
kinematic character of the pluton intrusion with respect to the regional deformation (Le Fort, 1981). Magmatic lineations in the HHL plutons trend E–W (Guillot et al., 1993; Scaillet et al., 1995a), and not N–S, as would be expected if intrusions occurred during a regional phase of N–S extension.
In this study, we have considered two possible geometric relationships between the Manaslu granite and its top contact, either intrusive or faulted, to evaluate whether different models relating STD motion to HHL emplacement are supported by thermal constraints.
Conditions during magma intrusion
The HHL are characterized by the occurrence of magmatic muscovite, in addition to tourmaline and biotite (e.g. Le Fort et al., 1987). Experimental work by Benard et al. (1985) on the Manaslu granite shows that at 3 kbar, muscovite is not stable in fluorine-poor HHL compositions under magmatic conditions. Scaillet et al. (1995b) defined a stability field for muscovite at 4 kbar.
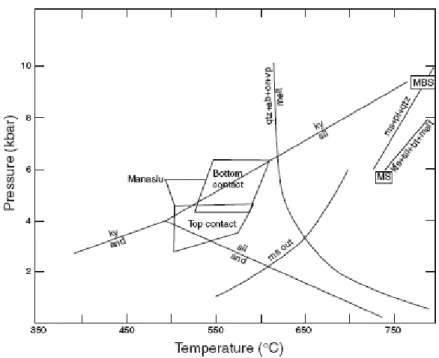
The stability curve of pure OH–muscovite intersects the wet haplogranite solidus in the pressure range 3–4 kbar (Fig. 2). Therefore, if devoid of fluorine, crystallization of muscovite in HHL constrains a minimum emplacement pressure of ~3-5 kbar. However, HHL do have some fluorine, which will extend the magmatic stability field of muscovite to lower pressures (Pichavant et al., 1988). HHL muscovites have 0.5–0.9 wt % F (Scaillet, unpublished data) which would allow crystallization of muscovite down to 2.8 kbar (Pichavant et al., 1988), matching the pressure constraint derived by Guillot et al. (1995a, 1995b) for the top aureole. For T and melt H2O content, petrological and
experimental data show that the magma was near the liquidus on emplacement, with intrusion temperatures of 750–800°C and 5–7 wt % dissolved H2O (Montel, 1993;
Scaillet et al., 1995b, 1996).
The High Himalayan Crystallines, in particular the metapelites and metagreywacke of FI, are believed to be the protholiths of the HHL, based on a variety of geological and geochemical arguments (Deniel et al., 1987; Le Fort et al., 1987; France-Lanord et al., 1988; Harris & Inger, 1992; Inger & Harris, 1993; Guillot & Lefort, 1995; Harris et al., 1995; Searle et al., 1997). Harris & Inger (1992) proposed, based on trace element modelling, that the HHL were produced by dehydration melting of muscovite-bearing metasediments, with melt fractions <10 wt %. This hypothesis is supported by the experimental work of Patino Douce & Harris (1998), who showed that dehydration melting experiments on Himalayan metapelites (muscovite + plagioclase + quartz assemblage) in the pressure range 6–10 kbar yield melts that are virtually indistinguishable from the HHL (Fig. 2). We note that, in addition, the temperature and water contents of the experimental melts are the same as those inferred from near-liquidus phase equilibria of HHL (Scaillet et al., 1995b). These results support the view that the magma migrated upward with limited, if any, chemical or thermal modifications. There is field evidence that the HHL magmas moved upward through narrow dykes (Le Fort, 1981; Inger & Harris, 1992; Scaillet et al., 1996; Walker et al., 1999), some of which connect to the base of the pluton, such as in the Garwhal Himalaya (Searle et al., 1993; Scaillet et al., 1995a).
Fig. 2. P–T diagram showing the locations of the main dehydration melting reactions (MS, muscovite schist and MBS, muscovite–biotite schist) involving muscovite, obtained for two Himalayan metapelites by Patino Douce & Harris (1998), together with the P–T conditions inferred for the top and bottom contact aureoles of Manaslu (Guillot et al., 1995a). Melting conditions of HHL are inferred to occur in the pressure range 6–10 kbar, whereas emplacement of HHL takes place at 3–4 kbar. Also shown are the haplogranite wet solidus (qz + ab + or + 3vp) after Luth (1976) and the muscovite out (ms-out) curve of Chaterjee & Johannes (1974). Note that both curves intersect at around 3 kbar, in agreement with phase equilibria constraints for the HHL (Benard et al., 1985; Scaillet et al., 1995b).
Age constraints
Although homogeneous in terms of their major element compositions (Le Fort et al., 1987), the HHL have Rb–Sr and 87Sr–86Sr heterogeneities that have prevented accurate dating using the Rb–Sr system, and which are believed to reflect heterogeneity in the source region (Vidal et al., 1982; Deniel et al., 1987; Inger & Harris, 1993; Guillot & Le Fort, 1995). Rb–Sr heterogeneities indicate that the granites were not well mixed internally and that conditions for large-scale magma convection (which would homogenize the magma) were not reached (Deniel et al., 1987). Using U–Pb monazite ages, Coleman (1998) proposed that magmatic activity in the area of Manaslu occurred in two main pulses at 18 and 22Ma. Harrison et al. (1999b) determined 158 Th–Pb ages for monazite from 12 samples of the Manaslu granite. Based on the peak of the age distribution obtained for each sample, Harrison et al. (1999b) defined crystallization ages ranging from 19.0 ± 0.4 to 24.0 ± 0.8Ma. The histogram of all the Th–Pb monazite ages shows two distinct peaks, one around 19.3 ± 0.3Ma and the other centred at 22.9 ± 0.6 Ma. The oldest ages correspond to samples from near the top of the body, whereas the
youngest are from samples at the bottom. These results led Coleman (1998) and Harrison et al. (1999b) to conclude that the Manaslu granite was emplaced in two magma pulses separated in time by 4 Myr. The lack of intermediate ages between 19.6 and 22.0 Ma might, however, reflect a lack of sampling in the middle part of the intrusion. The age distribution shows a tail towards older ages which falls within the interval 24–37Ma, and an even older interval, between 100 and 600 Ma. The older interval can be ascribed to inheritance from a 500–600Ma crustal protolith, probably generated during the Cambro-Ordovician thermal event that produced the Lesser Himalayan granites and their metamorphosed equivalents in the HHC.Harrison et al. (1999b) interpreted the 24–37 Ma population as reflecting Eo-Himalayan metamorphism, i.e. the metamorphic phase that affected the HHC during the early stages of crustal stacking. However, this population might also record incipient stages of magma intrusion. We conclude that the time interval of laccolith growth of 5 Myr should be viewed as a minimum value.
THE NUMERICAL MODEL
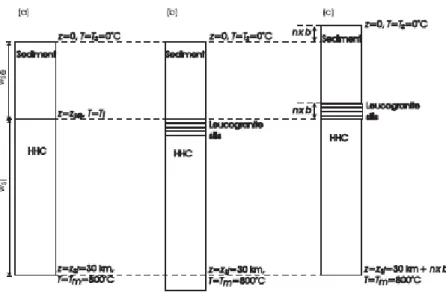
We simulated the growth of a laccolith-shaped granite body by the successive emplacement of discrete sills at magmatic temperature. In the Manaslu pluton, the youngest ages are stratigraphically located below the oldest (Harrison et al., 1999b) and so, in our model, each successive sill is emplaced below the previous one. The room for the sills is made by uplifting the overlying sediments or by moving the sequence below the sills downward. This latter case is an approximation for isostatic equilibration. In terms of computation, these two kinds of room accommodation correspond to two different bottom boundary conditions. For a room accommodation by isostatic equilibration, the bottom temperature is constant and at a fixed depth (Fig. 3b), whereas for a room accommodation by overlying sediments uplifting, the bottom temperature is also fixed but its depth is moving downwards relative to the surface level (Fig. 3c). We verified that the results were not sensitive to our assumptions about room accommodation. Two main models were tested. In the first one, magma sills are regularly injected throughout the entire magmatic event leading to the emplacement of 5 km of granite. In the second model, the same thickness of magma is emplaced in two pulses separated by a repose period of 4 Myr, as proposed by Harrison et al. (1999b). The sills are accreted in the same way as in the first model until the body is 2.5 km thick, then magma injection stops. After 4 Myr of no magmatism, intrusions resume and the remaining 2.5 km are emplaced at the same rate as in the first pulse. It should be noted that the thickness of the Manaslu granite has been estimated to reach 8 km in some areas (Guillot et al., 1995a), so that the 5 km total thickness is conservative.
Fig. 3. One-dimensional model of emplacement of a large igneous body by discrete sill accretion. (a) Initial conditions; (b) and (c) after the intrusion of n sills. In (b) the volume of the sills is accommodated by ‘isostasy’ (sagging) and the bottom boundary T = 800°C is at a fixed depth (z = 30 km); in (c) the volume of the sills is accommodated by roof uplift: the bottom boundary T = 800°C is at 30km + nb, with b the sill thickness. For abbreviations see Table 1.
The media, i.e. the granite and the country rock layers, are discretized and the temperature evolution is computed using the finite difference expression of the equation of heat balance :
where p is density, Cp is specific heat capacity, T is temperature, t is time, k is thermal
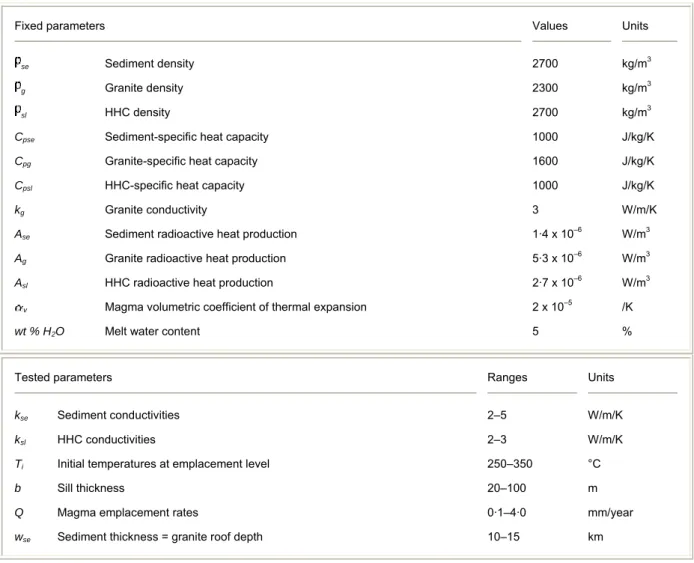
conductivity, L is latent heat of fusion or crystallization, and A is radioactive heat production. Values of these parameters used in the model are given in Table 1.
Fixed parameters Values Units se Sediment density 2700 kg/m3 g Granite density 2300 kg/m 3 sl HHC density 2700 kg/m 3
Cpse Sediment-specific heat capacity 1000 J/kg/K
Cpg Granite-specific heat capacity 1600 J/kg/K
Cpsl HHC-specific heat capacity 1000 J/kg/K
kg Granite conductivity 3 W/m/K
Ase Sediment radioactive heat production 1·4 x 10–6 W/m3
Ag Granite radioactive heat production 5·3 x 10–6 W/m3
Asl HHC radioactive heat production 2·7 x 10–6 W/m3
v Magma volumetric coefficient of thermal expansion 2 x 10
–5 /K
wt % H2O Melt water content 5 %
Tested parameters Ranges Units
kse Sediment conductivities 2–5 W/m/K
ksl HHC conductivities 2–3 W/m/K
Ti Initial temperatures at emplacement level 250–350 °C
b Sill thickness 20–100 m
Q Magma emplacement rates 0·1–4·0 mm/year
wse Sediment thickness = granite roof depth 10–15 km
Table 1: Model input parameters
Models were tested for sill thicknesses from 5 to 1000 m. Preliminary results showed that only thin sills produced results consistent with the geological observations (small aureole size). Additionally, Deniel et al. (1987) found that the scale length of the Rb–Sr heterogeneities was 100m. Thus, most simulations were run with sills of thickness 50m. The convergence of the results was tested for different node spacing. For models with sills 50m thick or more, the node spacing was 25 m. For thinner sills, the node spacing was equal to the thickness of the sill. The top of the intrusion was emplaced at a pressure of 3–4 kbar (Guillot et al., 1995a). We tested our model with granite top depth, i.e. depths of the first intruded sill, at 10, 12.5 and 15 km. We assumed that the granite magma temperature at 30 km depth was 800°C and that the adiabatic drop between 30 km and the emplacement level is about 20°C, resulting in a modelled leucogranite emplacement temperature of 780°C. We also ran some tests with an emplacement temperature of 750°C to check the influence of lower temperature on the results. We did not consider temperatures lower than 750°C because melt fractions in partially melted
Himalayan metapelites are below 5 wt % in the temperature range 720–750°C (Patino Douce & Harris, 1998) and it is unlikely that such partial melts will easily move out of their source but, instead, will remain trapped within it.
Conductivities
Heat transfer in a material is governed by the material heat diffusivity, k:
Density and specific heat capacity change only slightly with rock composition. Conductivity strongly depends on rock composition and on pore water or air content (Robertson, 1988). Rock conductivity is especially sensitive to quartz content, because of its high conductivity (7.69W/m/K). Depending on quartz content, sedimentary and felsic igneous rocks have conductivities ranging from 1.5 to >6W/m/K (Robertson, 1988). If the mode of the rock is known, its conductivity can be estimated as follows (Robertson, 1988):
where n1, n2, n3 are fractional volumes of mineral phases 1, 2, 3 and k1, k2, k3 are
conductivities of mineral 1, 2, 3. Conductivities decrease with increasing temperature (Robertson, 1988; Chapman & Furlong, 1992; Clauser & Huenges, 1995), but this decrease is poorly constrained and might be balanced by an increase in radiative heat transfer (Jaupart & Provost, 1985). The average HHL leucogranite quartz content is 32% (Le Fort et al., 1987). At the pressure of emplacement (3–4 kbar), porosity is assumed to be negligible. We estimate a granite conductivity of 3.2W/m/K at room temperature, in agreement with data for other gneisses and granites (Roy et al., 1968; Wenk & Wenk, 1969; Jaupart & Provost, 1985; Robertson, 1988). The quartz content of Himalayan metasedimentary rocks varies from <20% to >70% (France-Lanord, 1987), corresponding to conductivities in the range of 2–6W/m/K (Robertson, 1988). The TSS are characterized by an alternation of limestones, sandstones and shales (Colchen et al., 1986). Sandstones should have the highest conductivity, because of their high quartz content, followed by limestones and then shales. Conductivities of representative Himalayan metapelites of the HHC have room temperature conductivities in the range 3.2–5.3 W/m/Kwith an average of 3.7 ± 0.8W/m/K (Table 2). The conductivity of calcite is lower than that of quartz (3.57W/m/K at room T ) and is taken as the value for limestone. At 10 km depth, the conductivity of shale is estimated to be around 1.7W/m/K (Gueguen & Palciauskas, 1992). Forty-seven per cent of the TSS is made of limestones, 23% of sandstones and the remaining 30% of shales (Colchen et al., 1986), suggesting an average conductivity of 3.6W/m/K. Limestones are dominant at the base of the pile
(Paleozoic), shales are more abundant upsequence, and sandstones are more or less evenly distributed throughout (Colchen et al., 1986).
Table 2: HHC metasediment and Manaslu leucogranite modal mineralogy and conductivities
ki Density NA410 NA411 MS MBS HS-1 HS-2 Manaslu
(W/m/K) (g/cm3) vol % vol % vol % vol % vol % vol % wt %
Quartz 7·69 2·65 63 36 43 38 35 40 32
Mica 0·4 3 11 40 24 42 30 35 10
Plagioclase 2 2·7 25 21 28 11 15 30 37
KFd 2·4 2·55 — — — — — — 21
k (W/m/K) 5·3 3·2 3·9 3·2 3·0 3·7 3·2
All conductivities are calculated using equation (3). ki is the mineral conductivity. Metasediment
compositions are from: NA410, NA411: Colchen et al. (1986); MS, MBS: Patiño Douce & Harris (1998); HS-1, HS-2: (Harris & Inger, 1992); the Manaslu leucogranite composition is from Guillot et al. (1995a). The modal compositions of NA410 and NA411 are calculated by mass balance using the bulk-rock compositions listed by Colchen et al. (1986), and the mineral compositions of Patiño Douce & Harris (1998).
The TSS is thus more conductive at its base than at its top. Local conductivity variations are expected at the contact with the granite, depending on the local lithology. Although realistic values for TSS conductivities are in the range of 2.5–4W/m/K, we have tested thermal conductivities of TSS spanning a large range of 2–5W/m/K in order to constrain the role of this parameter better. Hydrothermal convection can increase heat transfer and the apparent conductivity. A minimum permeability, K, is required for the onset of convection. According to the theory of fluid convection in a porous medium (Turcotte & Schubert, 1982),
where µf, αf, af and cpf are the fluid viscosity, density, volumetric coefficient of thermal
expansion and specific heat capacity; kse and wse are the sediment conductivity and thickness. Assuming conservative values of Ra (Rayleigh number) = 4π2, µ
f = 1.33 ·x 10 -4 Pa s, k
se = 2W/m/K, αf ¼ 10-3/K, pf = 1000 kg/m3, cpf = 4200 J/kg, wse = 10 000m and
ΔT = 500°C, we obtain a minimum value for log K of -16.3. The log of rock permeability at 10 km depth can be estimated from experimental data (Shmonov et al., 2003) at -18.1 or from geothermal data at -17.2 (Ingebritsen & Manning, 1999). We conclude that permeabilities will be too low for hydrothermal convection to occur. The absence of
mineralization and veining close to the HHL plutons also suggests that there was no pervasive hydrothermal system surrounding the granite.
Boundary and initial conditions
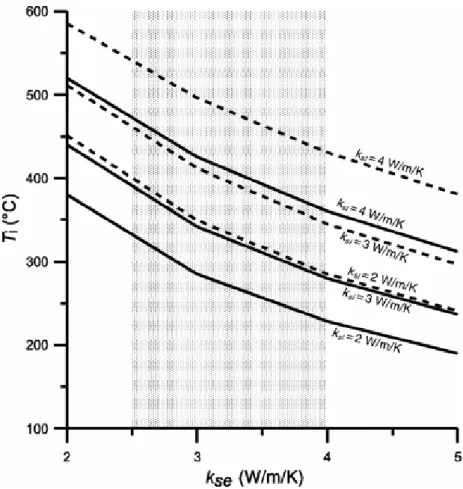
The top boundary condition at the Earth’s surface is a fixed temperature of 0°C. The bottom boundary condition is a magmatic temperature of 800°C, located at a depth of 30 km (Fig. 3). The initial temperature in the crust is determined by the geothermal gradient. A geothermal gradient at equilibrium can be calculated, where surface heat flux balances the heat flux from the base of the HHC and the internal heat production. The equations describing this steady-state geothermal gradient are given in the Appendix. The equilibrium geothermal gradient and the consecutive crust total heat content are controlled by the HHC and sediment conductivities (Fig. 4).
Fig. 4. Equilibrium temperature Ti at the HHC–sediment interface for different sediment conductivities kse and HHC
conductivities ksl. Ti is calculated with the equation in the Appendix for a steady-state geothermal gradient. The grey
shaded area indicates the range of realistic values for the sediment conductivities. The continuous and dashed curves are for HHC–sediment interfaces at 10 and 12·5 km depth respectively.
Because, in an active orogenic belt, the geothermal gradient is probably not at equilibrium, we tested the model with initial temperature at emplacement level Ti of 250, 300 and 350°C. In this case, the initial geothermal gradient is linear between the magmatic temperature at depth (Tm = 800°C at 30 km) and the temperature, Ti, at the
granite emplacement level, and between Ti and the surface temperature (0°C). With a linear geothermal gradient, the temperature of the crust evolves with time and tends toward the equilibrium geothermal profile, which is controlled by rock conductivities. As discussed later, this drift toward the equilibrium profile affects the results. The results presented below show that the thermal evolution during granite emplacement is governed by the equilibrium temperature at the locus of intrusion.Most results are in fact weakly dependant on the initial temperature. This, in turn, shows that they are not strongly dependent on the extent of thermal disequilibrium of the geotherm because of orogenic process.
Latent heat of crystallization and metamorphism
The latent heat released during crystallization is derived from phase equilibrium experiments performed on HHL at 4 kbar (Scaillet et al., 1995b). Closed-system
crystallization is assumed and the cumulated latent heat is calculated by estimating quartz,plagioclase and alkali feldspar proportions as a function oftemperature and H2O
in the melt. The role of accessory phasessuch as micas and tourmaline, which amount to less than 5% ofthe minerals, is neglected.
Because the HHL are highly evolved magmas, it follows that their curves of crystallization and, thus, of latent heat release are highly non-linear with temperature (Scaillet et al., 1997).Based on fits to experimental data, the expressions for HHLlatent heat used in the modelling are
where L(T) is cumulated latent heat in J/kg; T is in K. The term dT is a correction for
pressures different from 4 kbar and is equalto –15(P – 4) with P in kbar. The latent heat releasedby the magma cooling from temperature T1 to T2 is L(T2) –L(T1). As T2 depends
on the latent heat released, the solutionto equation (1) is found numerically by iteration. To evaluate the effect of latent heat of metamorphic reactionson the aureole size and temperature, some runs have been performedby including the latent heat absorbed by muscovite and biotite dehydration between 400 and 600°C using a latent heat of 600 J/kg/K (Furlong et al., 1991).
Comparison with nature: convection and thermal aureole
The constraints imposed by observations on the HHL are the absenceof large-scale convection within the magma body and a thermalaureole less than 100 m thick. We
carried out a parametric studyto determine the conditions that are consistent with these characteristics.
Convection within an individual sill will happen on short time-scalebefore it crystallizes. We considered the convection extendingto more than two sill thicknesses. We assume that the conditions for convection are reached in the leucogranites when the Rayleigh number, Ra, exceeds 3000 (Sparks et al., 1984):
where is density, v is the volumetric coefficient of thermal expansion, T is
temperature difference between thetop and bottom of the fluid layer, wm is the thickness
of the magmatic layer, and µ is magma viscosity. The melt viscosityof HHL has been experimentally determined between 800 and 1100°C, between 3 and 8 kbar, for H2O
contents between 3·98 and6·66 wt % (Scaillet et al., 1996) :
whereµ0 is melt viscosity in Pa s, T is in K and XH2O is theH2O content expressed as a
weight percentage of the melt. Inour model, the H2O content is 5 wt %.
Below the liquidus, the presence of crystals modifies the magmabulk viscosity (Roscoe, 1952; Lejeune & Richet, 1995):
where is crystal fraction, m is the critical crystal fraction beyond which flow is
prevented, and n is aconstant. The form of equation (8) reflects the large increasesin viscosity that occur when crystallization is sufficient forthe crystals to develop a touching framework in the transition between a crystal-rich magma and a partially molten rock. Basedon experimental and empirical evidence (Marsh, 1981; Lejeune& Richet, 1995), we take m = 0·6 and n = 2·5as typical values. The viscosity becomes infinite as tends
to 0·6. The model results are not sensitive to the shapeof the viscosity curve because, in the case of the HHL, thecurve of crystallization is close to the eutectic and increases from 0 to 0·75 over a temperature range of about 20°C.The crystal fraction at any given temperature between the solidus and the liquidus is estimated from the experimental resultsof Scaillet et al. (1995b) and has been given by Scaillet etal. (1997).
The modelling is based on the assumption that large-scale convectionwithin the granite would have homogenized Rb–Sr. Thisassumption is supported by the results of Jellinek
contrasts, even at low Reynolds number. Moreover, as discussed above, the magma has an eutectic behaviour. Asa consequence, rapid changes of viscosity occur over a verynarrow temperature window and the viscosities become relativelylow just above the eutectic temperature; thus, the sluggishconvection regime is expected to be confined to very restrictedconditions.
Application of equation (6) using a characteristic HHL magmaviscosity of 105 Pa s and a
T of 2°C, using the input parameterslisted in Table 1, shows that Ra exceeds 3000 for
any sill thicker than 20 m. For instance, for a sill 100 m thick, Ra = 3·7 x 105, which indicates that convection can be attained in relatively thin HHL sills, even when the thermal gradient across the magma layer is very small. In this paper, we distinguish between small-scale convection in an individual sill and large-scale convection on a scale of more than two sill thicknesses. In all our models,the time-scale for a thin sill to come to thermal equilibration with its surroundings is much shorter than the repose periodbetween intrusions. Thus, it is possible for individual sillsto convect during their cooling, but large-scale convection does not develop. Bergantz and Dawes (1994) argued that with a realistic set of parameters and assumptions, convective models of heat transfer in magma do not give fundamentally different results from purely conductive models. Thus, local convection should not increase significantly the heat transfer. The possibleslight increase of heat transfer that would be related to small-scale convection is accounted for by the wide range of thermal conductivitythat we explored. The other observation we used to constrain the magma emplacementrate is the thermal aureole thickness, wt. In the model, wt was defined as the thickness of country rock
whose temperaturehas exceeded 400°C during the magmatic event.
The two constraints (absence of large-scale convection and a narrow thermal aureole) were tested independently. No assumption was made about the size of the thermal aureole when the conditionsfor the absence of convection were explored and, similarly, no assumption was made about the occurrence of convection whenwe studied the size of the thermal aureole.
Model limitations
We developed a one-dimensional model, which allowed us to testa large set of
parameters. Such a detailed parameter study wouldnot have been possible with a two-dimensional model. However,using a one-dimensional model implies that on long time-scales,the temperatures might be overestimated because horizontal heatloss is
neglected. This time-scale can be approximated as follows(Turcotte & Schubert, 1982):
Fora body that is 10 km wide, the time-scale for lateral heat flowis about 4·5 Myr. If the time-scale of the granite emplacementis no more than 5 Myr, as suggested by Harrison
et al. (1999b), the lateral heat flow can be neglected. At lower granite emplacement
individual sills cooling on time-scalesmuch shorter than 4·5 Myr and thus that the lateral heatflow is insignificant.
Conductivity anisotropy is not captured by our one-dimensional model. We have modelled the country rock as homogeneous but,as stressed above, the sediments and crystalline basement surrounding the HHL are layered and probably have conductivity variations.
The heat advected by the fluids exsolved by the crystallizinggranite is not included in the model. Fluid advection would increase the size and temperature of the thermal aureole. Thus,the results we obtained are conservative.
RESULTS
The thermal evolution of the system
To constrain the conditions that give rise to a thin thermalaureole and the absence of large-scale convection, we made a parametric study on rock conductivities, magma emplacement rates, emplacement depths, initial temperatures and individual sill thicknesses. Early sills injected into cold crust solidify and transfer their heat to the country rock. The consecutive temperatureevolution in the growing granitic body and in the surroundingcrust is the result of a competition between the sensible andlatent heat advected by the magma, and the heat dissipated toward the surface by conduction. Thus, the parameters that control the thermal evolution of the system are the magma emplacement rate and rock thermal conductivity. If more heat is advectedthan can be conducted away, the temperatures increase in thegranite and country rocks, resulting in the growth of a contact thermal aureole. Eventually, newly injected sills equilibrate at temperatures above the leucogranite solidus. The intruding sills do not completely solidify any more and a zone of granitecontaining residual melt starts to accumulate. If the conditions described by equation (6) are satisfied, the magma convects and the intrusions begin to amalgamate and homogenize.
Conditions for convection
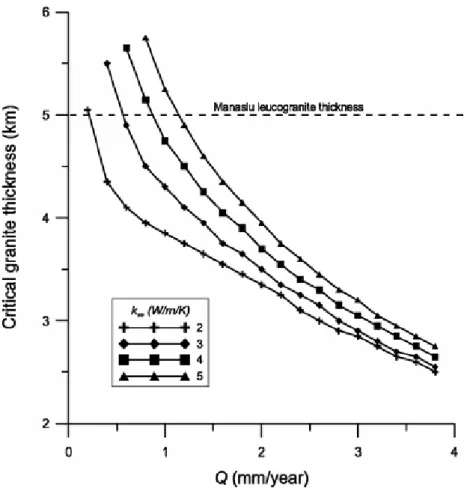
We define a critical granite thickness, which corresponds tothe total granite thickness that is accreted before large-scaleconvection initiates. We first illustrate how magma emplacementrate and country rock conductivity influence the critical granitethickness (Fig. 5).
Fig. 5. Critical granite thickness that needs to be emplaced before conditions for convection are reached as a function of magma emplacement rate (Q), for different overlying sediment conductivities (kse). The critical emplacement rate for
the Manaslu ( 5 km thick) is defined by the intersection of the curves with the dashed line. The sill thickness is 50 m, the granite conductivity is 3 W/m/K, the HHC conductivity is 2 W/m/K, the initial HHC–sediment boundary is at 12·5 km, and the initial geothermal gradient is linear with the HHC–sediment interface temperature Ti = 300°C.
For the Manaslu body, no large-scale convection happened; thus, the critical thickness was larger than the thicknessof the body. For the calculation conditions shown in Fig. 5—agranite roof at 12·5 km depth and no repose period—emplacementrates decrease with sediment conductivity. An average TSS conductivityof 4 W/m/K or less constrains the maximum emplacement rate to <0·8 mm/year; this value corresponds to the emplacementof 5 km of granite in 6·25 Myr.
In the parametric study, we use the critical emplacement rate,Qc, which is the maximum
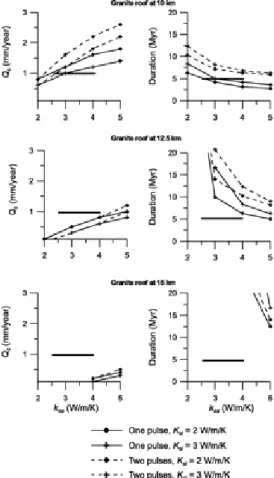
emplacement rate allowing 5 km of leucograniteto be emplaced without onset of large-scale convection. Figure 6 shows the relationships between Qc and the sediment
conductivities,with and without the repose period, for injection depths of10, 12·5 and 15 km and for HHC conductivities of 2 and 3 W/m/K. As shown before, high sediment conductivities allow fast cooling and high Qc. High Qc is also favoured by low HHC
conductivities, because less heat comes from depth, and by shallowinjection depth (Fig. 6). The initial temperature, Ti, at thelocus of magma emplacement does not influence Qc
significantly.With a shallow granite roof depth (10 km), a 4 Myr period ofrepose allows
the crust is cooling down during the repose period. At greater depths, the difference in emplacementrate between the two models is small (Fig. 6). According tothese results, the emplacement rate of the Manaslu granite isestimated to be less than 1·6 mm/year if emplacement is continuous and <2·3 mm/year with a 4 Myr repose. The granite emplacement duration is obtained by dividing 5 km by the emplacement rate. To this duration, 4 Myr must be added in the case of a repose period. Thus, although each magma pulse emplacement rate is higher in the case of two magma pulses, the averaged emplacement rate is lower and the emplacement durationis longer (Fig. 6).
Fig. 6. Critical emplacement rate for convection (Qc), and total emplacement duration, corresponding to a critical
granite thickness of 5 km, for different sediment conductivities kse, HHC conductivities ksl, and initial HHC–sediment
interface depths. Continuous lines: sills are regularly injected during the emplacement of 5 km of granite; dashed lines: sills are emplaced in two magmatic pulses separated by a repose period of 4 Myr as suggested by Harrison et
al. (1999b). The thick horizontal line marks the range of realistic sediment conductivities and Manaslu emplacement
rates or duration inferred from geochronological data (Harrison et al., 1999b). These results are for a leucogranite injection temperature of 780°C. The maximum difference in Qc for a lower injection temperature of 750°C is 0·2
mm/year.
According to Harrison et al. (1999b), the age difference between the Manaslu top and bottom is 5 Myr. Figure 6 suggests thatthis emplacement duration is consistent with the absence ofconvection if the emplacement depth is shallow (granite roofat 10 km). For a granite roof at 12·5 km, emplacement durations of 5 Myr are possible only with unrealistic sedimentconductivities (>4·5 W/m/K). At depths of 15 km ormore, forming a 5 km thick pluton in 5 Myr results in convection, using reasonable values of sediment
conductivities. This suggeststhat the preservation of isotopic heterogeneities within the thickest HHL is not consistent with a deep intrusion level, assuming a static overlying column. Although we have not tested initial temperatures, Ti, at the locus of magma
intrusion hotter than 350°C, the above results do not substantiate the case for in situ partial melting to construct the plutons. Intrusion in a deep environment (i.e. middle crust) will make it very difficult to avoid convection and mixing within thick HHL laccoliths.
The thermal aureole
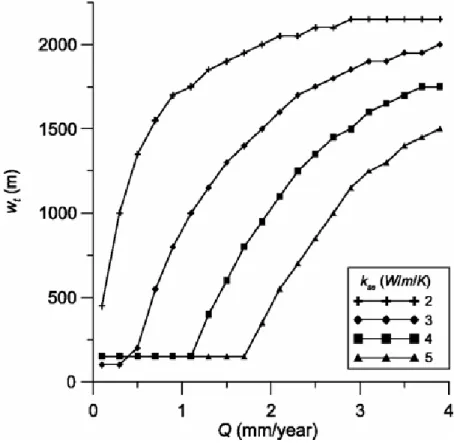
Fig. 7. Top thermal aureole thickness wt, defined as the thickness of country rock heated above 400°C, as a function
of the magma emplacement rate Q, for different sediment conductivities kse. The total accumulated granite thickness
is 5 km; the granite top is at 10 km, the sill thickness is 50 m, the granite conductivity is 3 W/m/K, the HHC conductivity is 2 W/m/K, and the initial geothermal gradient is linear with HHC–sediment interface temperature Ti =
300°C. Here wt is calculated with a precision of 50 m, which is why the curves are not smooth.
Figure 7 shows the width of the thermal aureole, wt, in thegranite overlying sediments
for a granite roof at 10 km andsill thickness of 50 m, for a total granite thickness of 5 km. Note that in Fig. 7, part of the results involves emplacement rates that are above the critical emplacement rate for convection as discussed above. As our model of heat transfer is conductiveonly, the aureole thicknesses shown in Fig. 7 are minimum values. For most emplacement rates and country rock conductivities investigated,the thickness of the thermal aureole depends on both of thoseparameters (Fig. 7). For instance, at an emplacement rate of1 mm/year, any sediment conductivity lower than 4 W/m/K yieldsan
aureole thickness of at least 1 km. However, there is a domainat low emplacement rates and/or high country rock conductivities, where the aureole thickness is nearly independent of emplacement rate and only depends slightly on conductivities (Fig. 7). Undersuch conditions, heat is conducted away through the rocks overlyingthe granite sufficiently rapidly to balance the heat advectedby magma input and conducted through the formerly emplaced granite pile. We define a critical emplacement rate, Qa, for the
growth of the thermal aureole. Below Qa, the thermal aureole reaches its maximum
thickness after the first sill emplacement, and its size depends on the individual sill thickness (Fig. 8) andnot on the total thickness of granite. Qa is strongly dependenton
country rock conductivity (Fig. 9). Qa is smaller than Qc,the critical emplacement rate for
convection (Fig. 6). Whatever the initial temperature, the system tends toward an equilibrium geothermal gradient and Qa can be higher if the equilibriumtemperature at
the granite emplacement depth is low. The equilibrium temperature in the system is controlled by the HHC, granite and sediment conductivities, and by the emplacement depth of the granite (Fig. 4). Thus, high values of Qa are favoured by shallow
emplacement depth, low HHC conductivities and high overlyingsediment conductivities (Fig. 9). Figure 4 shows that there is a domain at high HHC conductivities, and low sediment conductivities, where the equilibrium temperature is above 400°C. In this domain, the thermal aureole cannot remain thin.
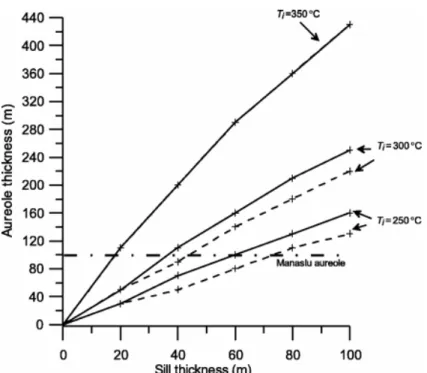
Fig. 8. The thermal aureole thickness for conditions below the critical emplacement rate, as a function of sill thickness for different HHC–sediment interface temperatures Ti. Continuous lines: the latent heat of sediment metamorphism is
neglected; dashed lines: the sediment latent heat of metamorphism is 600 J/kg/K between 400°C and 600°C (Furlong
et al., 1991). HHC and sediment conductivities are 2 and 3·5 W/m/K respectively. The horizontal dot-dashed line
marks the maximum aureole thickness overlying the Manaslu leucogranite. The aureole thickness is calculated with a precision of 5 m.
Fig. 9. Critical emplacement rate Qa limiting the aureole growth and corresponding emplacement duration for different
sediment conductivities kse, HHC conductivities ksl, and initial HHC–sediment interface depths. The bold horizontal line
marks the range of realistic sediment conductivities and the Manaslu emplacement rate or duration inferred from geochronological data (Harrison et al., 1999b). These results are for a leucogranite injection temperature of 780°C. The maximum difference in Qa for an injection temperature of 750°C is 0·2 mm/year.
We found that for Qa to be above 0·1 mm/year (the lowesttested emplacement rate), the
magma injection depth must be <15 km. For emplacement at 12·5 km depth, critical emplacement rates of more than 0·1 mm/year are possible, but require unrealistically high sediment conductivities. For 10 km depth and for sediment conductivities in the range 3–4 W/m/K, it is possible to build a 5 km thick lens with a corresponding small contact aureole (Fig. 9). For this range of sediment conductivity, greater depths of intrusion increase the period of pluton growthto at least 10 Myr, i.e. significantly beyond the geochronologicallyconstrained interval of 5 Myr. Below Qa, the aureole thicknessis
two to six times the sill thickness, depending on the initial crustal temperature (Fig. 8). Our computation suggests that to form a thermal aureole less than 100 m thick, the typical sill thickness should be <60 m, which is about the scale-length of the Rb–Sr heterogeneity at Manaslu (Deniel et al.,1987).
We have computed the temperature in the country rock at every1 m over a distance to the contact of 50 m. The thermal aureolepeak temperature is a maximum at the contact with the granite and decreases further away (Fig. 10). The slope of this temperature decrease is steeper with thin sills. Below Qa, the aureole peak temperature is not
sensitive to the country rock conductivity, or to the injection depth, but depends on the initial countryrock temperature, magma temperature and the sill thickness (Fig. 11).Our results suggest that the peak temperature of 550 ±40°C inferred from thermobarometric studies on the Manaslu top aureole (Guillot et al., 1995a) is consistent with an initial country rock temperature at the onset of injection of no morethan 300°C, in agreement with previous estimates (Copelandet al., 1990), and a sill thickness of <50 m.
Fig. 10. Profiles of the peak temperature in the top thermal aureole as a function of distance to the contact, for different sill thickness b, for injection temperatures of 780°C (continuous lines) and 750°C (dashed lines). The sediment latent heat of metamorphism is 600 J/kg/K between 400°C and 600°C (Furlong et al., 1991). Initial temperature Ti is 250°C, emplacement depth is 10 km, Kse is 3·5 W/m/K, emplacement rate is below Qa (0·5
mm/year).
Fig. 11. Peak temperatures in the sediments at distance of 1 m from the granite contact for different sill thickness and
Ti. (a) The latent heat of sediment metamorphism is neglected. (b) The sediment latent heat of metamorphism is 600
J/kg/K between 400°C and 600°C (Furlong et al., 1991). The emplacement rate is below Qa (0·5 mm/year). The
continuous lines are for a sill intrusion temperature of 780°C, the dashed lines are for a sill intrusion temperature of 750°C. The peak temperatures range inferred from thermobarometry (Guillot et al., 1995) is shown by the grey shaded area.
Tectonic unroofing and tectonic boundary
A tectonic top contact implies that the thermal aureole thickness is not a relevant constraint on the emplacement rate because of the renewal of the country rock. We modelled the processof tectonic unroofing by keeping the roof temperature, Ti, constant
during emplacement as a consequence of fault movement. In thismodel, the maximum emplacement rate for 5 km of leucogranite to emplace without onset of large-scale convection, Qc, is independentof the overlying sediment conductivity. Qc depends on Ti
and not on the emplacement depth. As expected, Qc is higher than in the case of a
statically heating roof (Fig. 12).
Fig. 12. Critical emplacement rate for convection Qc and total emplacement duration, corresponding to a critical
granite thickness of 5 km, in the case of unroofing, for different HHC conductivities ksl, and temperatures Ti. The
sediment temperature at the granite contact is kept constant and equal to Ti. Qc with or without a repose period is the
same. In the case of a repose period, the duration of the repose period must be added to the total duration time (dashed lines).
Qc is about the same, with or without a repose period; thus, allowing for the repose
period adds only 4 Myr to the total emplacement time(Fig. 12). The highest Qc is 3·4
mm/year with Ti = 250°C. In this latter case, the Manaslu granite could have been
emplaced in 1·3 Myr if its emplacement was not interrupted. In the case of a 4 Myr repose period, the total duration is atleast 5·3 Myr.
Thermal effects of HHL intrusion
Figure 13a shows the temperature profile in the crust afterthe emplacement of 5 km of granite between 10 and 15 km depth at a rate of 1 mm/year. The case for tectonic unroofing is shownin Fig. 13b. In the case of tectonic unroofing, the emplacementlevel is deeper (12·5 km) and the emplacement rate is higher (2·5 mm/year). However, because the constraintsof no large-scale convection apply in both cases, the maximum temperatures allowed in the granite body and the bottom contact temperature are the same. In the HHC, close to the bottom granitecontact, the temperature reaches 700°C when the magma is intruded. However, this peak in temperature is transient and
restricted to a few tens of metres close to the contact. On a larger scale, the HHC temperature equilibrates at 600°C in the proximity of the granite (Fig. 13). Under the lithostatic pressure at 15 km depth and below (pressure > 4 kbar), thistemperature is below the metapelite solidus temperature (Clemens & Vielzeuf, 1987; Patiño Douce & Harris, 1998). The dehydration melting temperature of pelites (about 700°C)is reached more than 8 km below the granite bottom contact. Thus, our results suggest that the increase in migmatizationtoward the thickest HHL cannot be the effect of HHL cooling.
Fig. 13. Profiles of crustal temperature after the emplacement of 5 km of leucogranite at a rate close to Qa (continuous
line). The dashed line shows the initial geothermal gradient. (a) The leucogranite roof is allowed to heat; depth of emplacement is 10 km, Q is 1 mm/year, and the sediment conductivity is 4 W/m/K. (b) The roof of the leucogranite is at a fixed temperature of 250°C (unroofing case); the emplacement depth is 12·5 km, Q is 2·5 mm/year. Sills are 15 m thick and the HHC conductivity is 2 W/m/K in both (a) and (b).
Cooling of the leucogranite
The temperature evolution at depths of 10, 11 and 12·5km during the emplacement of the granite and until 3 Myr afterthe end of intrusion is plotted in Fig. 14.
Fig. 14. Temperature evolution in the system at 10, 11 and 12·5 km depth. The leucogranite intrusion starts at 24 Ma and stops at 19 Ma according to geochronological data (Harrison et al., 1999b). The curve for 10 km corresponds to the temperature evolution of the first emplaced sill. The apparent thickening of the curves is due to temperature oscillations corresponding to sill emplacement at or close to the plotted level. The magma is injected at 750°C with an emplacement rate of 1 mm/year. The grey shaded area represents the closure temperature of muscovite.
The leucograniticbody extends from 10 to 15 km. We assumed here that the firstsill was injected at 24 Ma at an emplacement rate of 1 mm/yearand that intrusion stopped at 19 Ma. The temperature evolutionat 10 km depth corresponds to the temperature evolution of thefirst emplaced sill. The thickening of the 10 and 12·5km curves at 23 and 21·5 Ma, respectively, correspondsto temperature oscillation because of the injection of sillsat or close to this level.
The Ar40–Ar39 data for the top of Manuslu granite indicatea closure age of muscovite in the range of 17·1 ± 0·1 to 18·4 ± 0·1 Ma (Copeland etal., 1990), suggesting that the
upper part of the granite cooled below 357 ± 38°C, 1–2 Myr after the end ofintrusion. The temperatures we computed for the top of the graniteare in good agreement with the Ar–Ar data. For the lowerpart of the body, Ar–Ar ages range from 14·7 ±0·2 to 16·6 ± 0·1 Ma. At this time,our computed temperatures at 12·5 km depth, in the middleof the body, are above the muscovite closure temperature (Fig. 14). This discrepancy can be explained if the granite emplacementrate was less than the modelled rate of 1 mm/year, or if granitecooling was accelerated by the post-emplacement slip of theSTD.
DISCUSSION
The emplacement of the Manaslu granite
Heat transfer modelling provides constraints on the upper limitof emplacement rates for the HHL. Geochronological data suggestthat the emplacement of the Manaslu intrusion took place overno more than 5–6 Myr. If the intrusion rate was steady,then these data suggest that the intrusion rate could not havebeen lower than 1 mm/year. Our modelling suggests that manyparameter ranges, consistent with the observations of no convection and a thin thermal aureole, fall below this lower limit. However, model results with shallow emplacement (roof at 10 km) are at, or above, 1 mm/year, and are, therefore, consistent with the geochronological data. The thickness and temperature of the Manaslu thermal aureole can be explained by the intrusion of sills 20–60 m thick, in broad agreement with the size of individual magma batches inferred from Rb–Sr systematics (Deniel et al., 1987). A 1 mm/year emplacement rate implies that the average time interval between injections was of theorder of 20 000–60 000 years. Two magma pulses separatedby a repose period of 4 Myr, as proposed by Harrison et al. (1999b), permit a higher emplacement rate for each pulse. However,when the repose time is included in the total emplacement duration, this duration is more than 5 Myr. Thus, a better fit between the thermal results and the geochronological data is found witha continuous emplacement, rather than with a repose period.
If the top contact is not tectonic, for the leucogranite toavoid large-scale convection and thermal aureole growth, themodel requires the HHC conductivity to be lower than that of the sediments, in contrast to the conclusions of Jaupart & Provost (1985) and Pinet & Jaupart (1987). Those workers proposed a model of heat refraction at a high conductivity HHC–low conductivity sediment interface; heat focusing causes partial melting at this interface. Such an approach assumes that melt generation and leucogranite emplacement have occurred at thesame crustal level, as it seems to have done along some transects such as in the Everest–Makalu area (Visona & Lombardo, 2002; Searle et al., 2003). However, in order to avoid convection, in situ models are
constrained to produce HHL at small ratesand to allow the first-intruded magma layer to cool before the next sill is intruded. The latter condition seems particularly difficult to realize, as melting driven by thermal refractionis likely to be a continuous process, and the melt fraction should increase with time. We conclude that such models, although conceptually viable, are not applicable to the HHL whenever they exhibit isotopic heterogeneities.
Because of the slow accretion rate, the amount of heat available at any time at the intrusion locus to establish a hydrothermal convective system is small. Stable isotope studies on the Manaslugranite (France-Lanord et al., 1988) also indicate that therehas not been any large-scale hydrothermal interaction of thegranite with meteoric water.