HAL Id: hal-02356470
https://hal.archives-ouvertes.fr/hal-02356470
Submitted on 28 Aug 2020
HAL is a multi-disciplinary open access
archive for the deposit and dissemination of
sci-entific research documents, whether they are
pub-lished or not. The documents may come from
teaching and research institutions in France or
abroad, or from public or private research centers.
L’archive ouverte pluridisciplinaire HAL, est
destinée au dépôt et à la diffusion de documents
scientifiques de niveau recherche, publiés ou non,
émanant des établissements d’enseignement et de
recherche français ou étrangers, des laboratoires
publics ou privés.
Distributed under a Creative Commons Attribution| 4.0 International License
flow-bearing structures based on multi-scale
investigations applied to the Lez karst aquifer
Amélie Dausse, Véronique Léonardi, Hervé Jourde
To cite this version:
Amélie Dausse, Véronique Léonardi, Hervé Jourde. Hydraulic characterization and identification of
flow-bearing structures based on multi-scale investigations applied to the Lez karst aquifer. Journal
of Hydrology: Regional Studies, Elsevier, 2019, 26, pp.100627. �10.1016/j.ejrh.2019.100627�.
�hal-02356470�
Contents lists available atScienceDirect
Journal of Hydrology: Regional Studies
journal homepage:www.elsevier.com/locate/ejrh
Hydraulic characterization and identification of flow-bearing
structures based on multi-scale investigations applied to the Lez
karst aquifer
Amélie Dausse
*
,1, Véronique Leonardi, Hervé Jourde
HydroSciences Montpellier (HSM), Univ. Montpellier, CNRS, IRD, Montpellier, FranceA R T I C L E I N F O Keywords:
Hydraulic tests Multi-scale analysis Heterogeneity scale
Fractured and karstic carbonate rocks Karstified bedding-planes
A B S T R A C T
Study Region: The Lez aquifer is a Mediterranean karst system located in southern France, which supplies groundwater to the Montpellier urban area.
Study Focus: Multi-scale hydrodynamic investigations were carried out in a fractured and karstic aquifer in order to identify the flow-bearing structures and evaluate their hydraulic properties. The study is based on an extensive dataset developed from several hydraulic tests, performed at different spatial and temporal scales. The scales ranged spatially from a few meters to more than 15 km and temporally from a few minutes to a few months.
New Hydrological Insights for the Region: The data analysis shows that the hydraulic connectivity at both local and regional scales is mainly due to sub-horizontal flow-bearing structures, in which a conduit network has developed. This structure appears mainly to be located at the interface between two stratigraphic units, at the transition between Jurassic and Cretaceous limestones (Kimmeridgian-Berriasian interface). At the regional scale, this flow-bearing structure plays a major role in large-scale connectivity since a compartmentalization of the Lez aquifer appears where the continuity of this structure disappears. The hydraulic properties estimated appear to be strongly dependent on the investigated geological structures and on the different hydrogeological methods used for the borehole, local and regional scale of investigations.
1. Introduction
Karst aquifers, which are generally very productive, constitute important groundwater resources for approximately a quarter of the global population (Ford and Williams, 2007). These aquifers can be conceptualized by three levels of porosity: the primary porosity of the rock matrix; the secondary porosity of fractures, which includes various fracture types or joints at several scales (cracks, joints including bedding-planes and faults); and the third porosity resulting from the dissolution of the bedrock along the fracture or joint surfaces (Worthington, 1999;Ford and Williams, 2007). The permeability of the system is generally dominated by the second and third porosity types (Worthington et al., 2000;Worthington and Ford, 2009). In fractured rocks, flow channeling generally occurs at fracture and fracture-network scales (de Dreuzy et al., 2012) but this process may be stronger in karstic reservoirs (Worthington and Ford, 1995). This behavior may be enhanced by the presence of complex networks of enlarged fractures due to wall dissolution, and to the development of karst conduits over several kilometers (Palmer, 1991; Worthington, 1999). Groundwater
https://doi.org/10.1016/j.ejrh.2019.100627
Received 5 December 2018; Received in revised form 30 July 2019; Accepted 10 September 2019
⁎Corresponding author.
E-mail address:[email protected](A. Dausse).
1Present address: G360 Institute for Groundwater Research, University of Guelph, N1G 2W1 Guelph, ON, Canada.
Available online 06 November 2019
2214-5818/ © 2019 The Authors. Published by Elsevier B.V. This is an open access article under the CC BY license (http://creativecommons.org/licenses/BY/4.0/).
quality and quantity in karst aquifers are therefore highly variable due to the strong heterogeneity and anisotropy of the fractured and karstic networks (Worthington, 2011). The management of these groundwater resources are thus particularly challenging and require detailed characterization of hydraulic heterogeneity, which are extremely variable and difficult to determine (Bakalowicz, 2011).
In fractured-karstic reservoirs, the degree of detail in the hydraulic heterogeneity depends on the spatial extent of the in-vestigation and on the specificity of the hydraulic experiments (Shapiro et al., 2015). For instance, hydraulic tomography provides important details of spatial hydraulic heterogeneity but requires multiple cross-hole hydraulic tests, which are generally made at a limited scale of investigation to allow monitoring of hydraulic responses (Ackerer and Delay, 2010;Wang et al., 2017;Fischer et al., 2017). However, hydraulic tomography still remains a challenge to be conducted at regional scale (i.e., aquifer/watershed scale) due to, for instance, the technical difficulty to investigate significant volumes of the aquifer, a limited number of observation wells distributed over the entire system, or simply to an impossibility to provide responses at each observation well during sequential pumping tests. At regional scale, groundwater flow and hydraulic property estimates in karstic systems are classically investigated with spring-discharge hydrographs (Baedke and Krothe, 2001;Kovács et al., 2005;Fiorillo, 2014), by hydraulic head data analyses (Sauter, 1991;Renard and Jeannée, 2008;Galvão et al., 2016) or, more rarely, by long-term pumping test analysis (Maréchal et al., 2008).
To obtain more details on hydraulic heterogeneity and connectivity at larger scale, which could be helpful to improve ground-water management, another approach consists in a multidisciplinary framework. This requires consequently intensive investigations to identify and characterize the relevant flow structures such as faults, joints, bedding-planes and karstic features. Such investigations can be made by measurements at several scales of investigation in order to connect all the information and provide a consistent interpretation. At the borehole scale, flowing fractures or karstic features can be localized and characterized through different methods such as temperature logging (Chatelier et al., 2011;Klepikova et al., 2011), packer testing (Quinn et al., 2012) or flowmeter testing (Paillet, 1998;Day-Lewis et al., 2000). At the local scales, cross-hole hydraulic tests, such as pumping tests, can be used to identify the flow pattern to provide information on reservoir geometry, in addition to its hydraulic properties (Gringarten, 2008). At the regional scale, water-level monitoring in several observation wells appropriately distributed across the system can be used, for instance, to identify potential compartments under different hydrological conditions (Guihéneuf et al., 2014). Even though such approach is challenging and requires numerous data, it remains necessary to identify geological structures relevant for groundwater flow at larger scales and estimates their hydraulic properties.
The objective of this study is to identify and characterize the properties of the main flow-bearing structures in a karst aquifer, based on geological information and a multi-scale hydraulic investigation. These intensive investigations were conducted in the Lez aquifer, a Mediterranean karst aquifer located in southern France, near the metropolitan area of Montpellier. Investigations were performed at regional scale (i.e., the watershed scale), local scale using an experimental site (i.e., the Terrieu experimental site) and borehole scale with specific measurements in some boreholes. Detailed knowledge of the aquifer characteristics remains of major importance for the Lez aquifer management, because groundwater is intensively pumped for water supply to the Montpellier me-tropolitan region. Such detailed information on reservoir heterogeneities may also be helpful for any future predictive modeling related to groundwater management and protection.
2. Study site: the Lez aquifer
This large karst system located in the Mediterranean basin, South East of France, is referred to as the Lez aquifer because it feeds the Lez spring. The Lez aquifer supplies some 30 million m3of water per year to the metropolitan area of Montpellier. The area is
characterized by a typical Mediterranean climate with dry summers and rainy autumns. The mean temperature is about 22 °C in summer, and about 5 °C in winter. The intense rainfall events in autumn are the main contributors to the annual recharge. Annual rainfall occurs primarily from September to December and to a lesser extent from March to May. The mean annual precipitation ranges from about 600 mm (dry years) to more than 1500 mm (wet years). Rainfall is also spatially variable with an increase from south to north due to the rising topography and the proximity of the Cevennes hills (Mazzilli, 2011). The recharge area of the Lez spring is estimated about 150 km2, corresponding to the surface area where limestone directly outcrops. The exact boundaries of the
aquifer area are poorly known, but it is estimated of more than 250 km2. In the following sections, the hydrogeological context of the
Lez aquifer, details concerning the Terrieu experimental site, and the strategy adopted for this study are presented. 2.1. Hydrogeological context
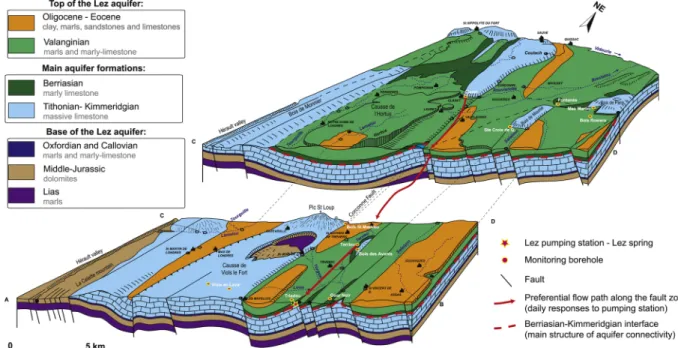
The Lez aquifer is composed mainly of Upper Jurassic and Early Cretaceous limestone. These sedimentary rocks overlie the Callovian–Oxfordian marls (Jurassic) and may locally be covered by a thick succession of Early Valanginian (Early Cretaceous) marls and marly limestone (Fig. 1a). The aquifer is divided by NE-SW normal faults related to the Pyrenean orogeny (Eocene) and later impacted by the oligocene extension phase (Séranne et al., 1995;Benedicto et al., 1999). The Matelles-Corconne fault, which is one of the main faults, divides the reservoir into two compartments. The western compartment contains the Upper Jurassic limestone at the outcrop while the eastern compartment primarily contains cretaceous formations of the Early Valanginian at the outcrop (Fig. 1a). The Lez aquifer shows a high degree of karstification developed during different geological periods, from the Middle Cretaceous to the current period (Leonardi et al., 2011). In particular, the possibility of deep karstification is attributed to the Messinian salinity crisis (about 5.5 My ago) when the sea-level of the Mediterranean Sea dropped by more than 1000 m due to the closing of the Gibraltar straights (Audra et al., 2004;Clauzon et al., 2005).
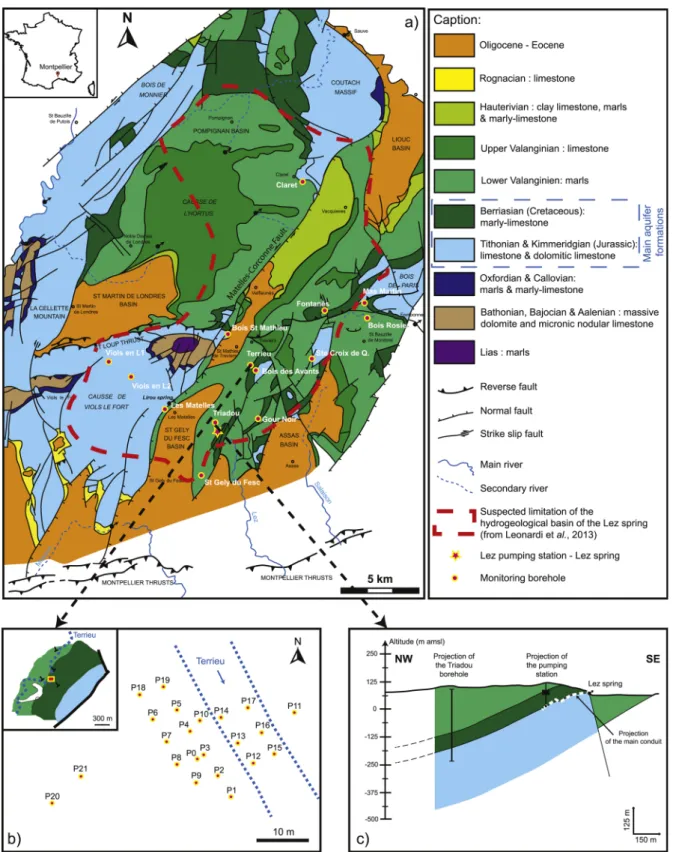
Fig. 1. a) Regional geological map with the position of the monitoring network of the Lez aquifer (modified fromMarjolet and Salado, 1975); b) Geological location of the Terrieu experimental site and spatial distribution of boreholes; c) Simplified geological cross-section through the Lez spring and the Triadou borehole (modified fromLeonardi et al., 2013).
An extensive fracture dataset was collected at different spatial scales from 2D patterns observed at the Lez aquifer. Data available come from the geological map at a scale of 1:250 000 (Tissier, 2009), from assembled aerial photographs at a scale of 1:25 000 (Durepaire, 1985) and from in situ outcrop measurements at the Terrieu experimental site (Drogue and Grillot, 1976; Jazayeri Noushabadi, 2009). Statistical analyses revealed different preferential orientations of the fracture sets depending on the scale of analysis (Leonardi et al., 2011;Dausse, 2015). At the regional scale (1:250 000), the main orientations of the faults are from N010 to N040, with over 50% of fractures oriented in this direction. At the 1:25 000 scale, the results are highly heterogeneous, depending on the selection of the geographic zones (Dausse, 2015). Three main fracture sets show the N040-N045 direction (the main re-presentative ones are related to the NE-SW direction of the Matelles-Corconne fault), the N-S direction and the E-W direction. At the local scale (i.e., the Terrieu experimental site), from Cretaceous limestone outcrops, two main families of fractures with the N070 and N140 directions have been identified (Wang et al., 2014). According to the scale of observation and to the locations chosen for fracture trace maps analyzed, the impact of the variability of the fracture networks is significant on the estimated apparent con-nectivity, ranging from well- to poorly-connected (Lei and Wang, 2016). The connectivity of fracture networks organizes the groundwater flow and could influence the karstification of the carbonate reservoir. The organization of the karstic networks is related to both the fracturing and the direction of the hydraulic gradient, whereas close to major faults, this organization is controlled by the juxtaposition of different units and by the tectonic regime (Leonardi et al., 2011). The karstic network is preferentially oriented along the NE-SW main faults, but in poorly-deformed areas, the network is mainly oriented in the NS-EW direction (Leonardi et al., 2011). Husson et al. (2018)demonstrated that the varying karstification distribution of the Lez aquifer can be related to the presence or absence of impervious formations covering the carbonate strata. In particular, carbonates located under impervious marly formations (Early Cretaceous) appear mostly preserved from dissolution processes and are less karstified (Husson et al., 2018).
The reservoir discharges into several seasonal overflowing springs. The main outlet, the Lez spring, is located near Saint-Clément-de-Rivière, about 15 km north of Montpellier. This spring is of a Vauclusian-type with a maximum discharge of approximately 15 m3
s−1. However, the discharge at the Lez spring is generally small or nil due to the active pumping management of the aquifer, which
also reduces downstream floods (Jourde et al., 2014). Since 1980, the water supply of the metropolitan area of Montpellier has been provided by the underground Lez pumping station installed 250 m upstream of the Lez spring (Fig. 1c). The water is pumped from the main karst conduit leading to the spring, around 50 m below the spring level (i.e., 15 m above mean sea level (amsl)). The maximum cumulative pumping rate is about 6120 m3h−1. The water levels at the Lez catchment are monitored through numerous observation
wells distributed from a few meters to several kilometers (i.e., 15 km) from the pumping station (Fig. 1a). One of these observation wells, the Triadou, is located 580 m upstream of the Lez pumping station (Fig. 1c), and was drilled to a depth of 330 m for the purpose of this work. Geophysical and hydraulic characterizations in this borehole are presented below in the section “Borehole scale in-vestigations”.
2.2. The Terrieu experimental site
The Terrieu experimental site is located at the east of the Matelles-Corconne fault, in the eastern compartment of the reservoir, 4.6 km north of the Lez spring (Fig. 1a). This site is located in a NE-SW monocline of the Early Cretaceous marly limestone and the Upper Jurassic limestone, dipping NW from 15 to 20°. It is composed of 22 shallow boreholes (about 60 m deep), with a diameter of 115 mm (except P0, P8, P21 with a 216 mm diameter), grouped in a network with a spacing of about 5 to 7 m over the 1500 m2
surface area of the site (Fig. 1b). Groundwater level usually fluctuates from 35 to 75 m above mean sea level (i.e., around 50 to 10 m below ground surface) depending on the hydrological conditions. Under exceptional meteorological conditions artesianism has been observed on the site. Most of the boreholes are not cased (except P18 and P19 with cased screen) and intersect two main lithologies. The upper part of the boreholes (length of about 30-40 m) crosscuts inter-bedded marly limestone, which corresponds to the Ber-riasian limestone. The lower part of the boreholes (length of about 20-30 m) crosscuts more massive limestone. This change of lithology may be attributed to the transition between Cretaceous (Berriasian) and Jurassic (Kimmeridgian) limestones.
Fracture analyses were conducted at the Terrieu site on the outcrops as well as in several boreholes from video logs (Drogue and Grillot, 1976;Jazayeri Noushabadi, 2009). At the outcrops, two main fracture directions were observed, N070 and N140 (Wang et al., 2014). From video-log investigations, the fractures oriented N070 are preferentially open (Jazayeri Noushabadi, 2009). This is consistent with the orientation of the observed karst conduits (Jazayeri Noushabadi et al., 2011). The karstification at this site appears moderately developed with a preferential karstification at the intersections between fractures and bedding-planes (Drogue and Grillot, 1976).
Various hydrogeological studies have been performed at the Terrieu experimental site. The first pumping tests conducted at the site in the 1980s has shown that the flow is preferentially oriented N070, which is well correlated with one of the main fracture orientations (Drogue and Grillot, 1976). The correlation with the fracture orientations has also been confirmed by numerous short-term (several minutes) pumping tests conducted at different pumping boreholes (Jazayeri Noushabadi et al., 2011; Wang et al., 2016). The pumping tests analyses provided transmissivity values ranging from 3.7 × 10⁻⁷to 2.0 × 10⁻²m2s−1. Single-borehole
electromagnetic flowmeter measurements from three boreholes (P2, P5, P16) estimated transmissivities ranging from 3.7 × 10⁻⁷to
1.6 × 10⁻⁴m2s−1(Lods, 2000). These estimates show a strong variability of the transmissivity at the site scale due to a strong
heterogeneity of the karst reservoir. In addition, the single-borehole flowmeter tests revealed only two or three main flow zones per borehole, which is also confirmed by temperature logging (Drogue, 1985;Malard et Chapuis, 1995;Jazayeri Noushabadi, 2009; Dausse, 2015). The strong anomalies in temperature loggings measured at some boreholes (i.e., P2, P8, P11, P12, P15, P20) suggested flow zones of higher permeability related to karstified fractures and karst conduits developed along a bedding-plane (Jazayeri Noushabadi et al., 2011). Because its extensive network of boreholes, the experimental site is also appropriate to conduct hydraulic
tomography studies. Recently, sequential short-term pumping tests (Wang et al., 2016,2017;Fischer et al., 2017) and sequential harmonic pumping tests (Fischer et al., 2018a,b) have been performed to characterize the spatial distribution of field transmissivity and imaging karstic features. The inversions of the hydraulic data were based on a two-dimensional conceptual model derived from field investigations (Jazayeri Noushabadi, 2009;Dausse, 2015).
2.3. Multi-scale investigations strategy
The multi-scale investigations of the Lez aquifer are based on an analysis of extensive dataset collected at different spatial scales, from a few meters to more than 15 km; and temporal scales, from a few minutes to a few months. Three main scales have been defined according to the methodology applied and spatial investigation: regional, local and borehole scales. The regional scale, presented in section3, mainly focuses on the large influence of the Lez pumping on water levels. Water levels have been monitored at several location using numerous observation boreholes distributed across the watershed, including the Terrieu boreholes. Daily and seasonal variations on water levels have been analyzed to extract hydraulic properties. At the Terrieu experimental site, which represents the local scale presented in section4, a cross-hole pumping test was performed to estimate local properties. Since high flow rate pumping at the Lez station have a large impact on the hydrodynamics of the Terrieu experimental site, the regional interferences observed during hydraulic tests at this site have been removed to analyze independently the hydrodynamic response to the local perturbation. This influence was thus filtered in order to provide a consistent interpretation of the long-term pumping test performed at local scale. In section5, the borehole scale investigations are presented. These includes specific measurements (i.e., packer tests, temperature and electrical conductivity logging) conducted in some Terrieu boreholes and the Triadou borehole, which has been implemented for this study. In addition to cuttings analysis, geophysical resistivity logging was performed at the Triadou borehole to characterize properly the geology with depth. In order to identify the main flow zones in this borehole and estimate their transmissivity, temperature and electrical conductivity logging as well as borehole flowmeter tests were realized.
3. Regional scale investigations
3.1. Materials and methods
For the water supply of the metropolitan area of Montpellier, the pumping rates vary daily according to the water demand and impact the aquifer over several kilometers. Discharge rates are continuously monitored with high-frequency measurements (1 minute timestep). Water level variations were recorded at high-frequency with pressure transducers (TD-Diver® and CTD-Diver®, Schlumberger) at the Lez station and in 14 observation boreholes distributed at different places over the karst catchment (red dots in Fig. 1a). The seasonal variations due to the long-term pumping, later referred to as “seasonal drawdowns”, were observed in most observation boreholes. Only a few of them are sensitive to daily variations, called “daily drawdowns”. Seasonal and daily variations were both used to characterize the hydrodynamic properties of the reservoir. The hydraulic properties were first derived by the classicalCooper and Jacob’s (1946)andTheis’ (1935)solutions for seasonal and daily responses, respectively. The limitations of applying the Theis’ solution or its Cooper-Jacob's approximation to model the Lez pumping responses are obvious based on their assumptions (e.g., fully penetrating well, homogeneous and confined aquifer of infinite extent), which cannot account for karst complexity. However, these reference models can be useful to estimate aquifer hydraulic properties using late-times drawdown data and may provide a good estimate of the effective transmissivity in heterogeneous media (Meier et al., 1998;Sánchez-Vila et al., 1999; Knudby and Carrera, 2006). The transmissivity estimates using these simple approaches for seasonal and daily responses are next validated using the radial composite model ofButler (1988), which allows to simulate consistently the global behavior of the regional drawdowns.
3.2. Results
3.2.1. Seasonal drawdowns analysis
The continuous water level monitoring in several boreholes demonstrates strong temporal and spatial variabilities (Fig. 2a). During the rainy periods, water levels react rapidly to rainfall, rising from a few meters to several tens of meters. When water level at the Lez spring is higher than the outlet altitude (i.e., 65 m amsl), the Lez spring starts flowing. However, the spring does not always discharge after significant rainfall events because of the Lez pumping influence, inducing strong decrease in water level. During dry periods (negligible or no rain), the pumping stops the natural flow at the Lez spring and decreases the water levels over several kilometers. The resulting drawdowns were analyzed over three months during the dry season (from June to August 2012). The different types of drawdowns were organized in five groups according to their behaviors (Fig. 2b, c and d). These responses do not appear dependent of the distance between the borehole and the pumping station (Fig. 1). Indeed, some boreholes displayed similar drawdown responses while they are located at different radial distances from the pumping station (seeFig. 2b and c). A summary is provided inTable 1with the different response categories detailed below.
Fig. 2b presents two categories of drawdown responses. One category groups boreholes with daily responses (i.e., Triadou, Claret, and Terrieu). All boreholes at the Terrieu site react similarly to the Lez pumping and thus can be considered as a single point at the regional scale. Interestingly, daily responses measured at the P20 Terrieu borehole have lower amplitudes once the water level decreases below 45 m amsl (see zoom atFig. 2a). The amplitude of the average daily drawdowns suddenly changes from 1.7 m to 0.3 m in this borehole. The second category groups boreholes with a similar trend and amplitude but without daily variations (i.e.,
Matelles and Bois de Saint Mathieu).Fig. 2c presents a borehole category with a similar shape compared to that of the Lez station, but without daily variations and with smaller amplitude (i.e., Gour Noir, Saint Gely, Sainte Croix de Quintillargues, Mas Martin, and Bois des Rosiers).Fig. 2d shows two other borehole categories. One is characterized by a different behavior (i.e., different inflexion) than that of the Lez station and groups Bois des Avants and Fontanès. Note that Bois des Avants presents a combined behavior: during the first four days, the response was impacted by daily pumping, then it changed to follow the general decrease in water level with a different shape. The last category represented by the two boreholes located at Viols en Laval (only one is shown) is characterized by almost no response to the pumping. Note that these last boreholes cross-cut only the Kimmeridgien limestone in the western com-partment of the Lez system (Fig. 1).
The late times drawdown responses were interpreted withCooper and Jacob’s (1946)method and the results are presented in Table 1. The values of transmissivity range from 3.8 × 10⁻³to 7.8 × 10⁻³m2s−1and are characterized by a geometric mean of
6.0 × 10⁻³m2s−1. This mean value is fully consistent with previous estimates at the Lez station, which range between 6.0 and
6.9 × 10⁻³m2s−1whichever period is considered (i.e., 1986, 1987, 1998, 2002, 2003, 2005, 2006) (Jourde et al., 2011). The
storativity values are more variable and range between 8.2 × 10⁻⁵and 6.3 × 10⁻², which is classically observed from the analysis of
pumping tests in heterogeneous reservoirs using this method (e.g.,Meier et al., 1998;Sánchez-Vila et al., 1999;Bodin et al., 2012) and can be related to the heterogeneous diffusivity of the karst aquifer.
3.2.2. Daily drawdowns analysis
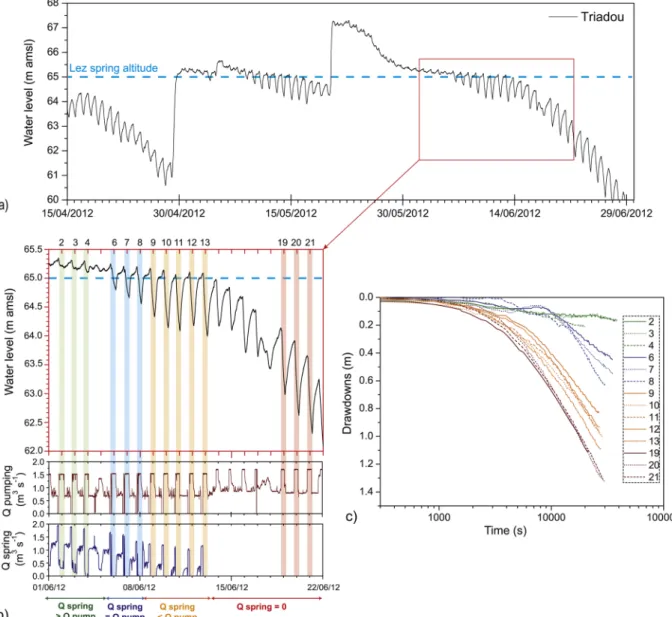
Daily water-level variations due to the pumping cycles can be clearly observed at the Triadou, Terrieu and Claret boreholes (Fig. 2b) and for few pumping cycles at the Bois des Avants borehole (Fig. 2c).Fig. 3a shows water levels at the Triadou borehole from April to July 2012. The Lez spring altitude (65 m amsl) is represented by the blue dotted line. When the water level is above that of the spring, the Lez spring discharges, but, when the water level is below that of the spring, the discharge stops (Fig. 3b). The variable drawdown responses are highlighted for 21 daily pumping cycles in June 2012 (Fig. 3b and c).
For similar durations and pumping rates at the Lez station, the variability of the daily drawdown shapes appears strongly cor-related to the natural flow discharge at the Lez spring (Fig. 3b). The slopes and amplitudes of the drawdowns were smaller when the natural discharge at the Lez spring was higher than the pumping rates (highlighted in green inFig. 3b and green curves in 3c). The
Fig. 2. a) Rainfall, borehole water levels and flow rate at the Lez spring from April to September 2012. During the 2012 dry period, the two dotted
lines limit the period during which the regional drawdown due to pumping (average Qpumping= 4134 m3h−1) at the Lez station were analyzed. b)
Typical hydrodynamic responses at the different boreholes that exhibit a drawdown similar to the drawdown at the Lez station pumping well (black line). c) Typical hydrodynamic responses at the different boreholes that exhibit similar shape responses but with smaller amplitude. d) Boreholes that exhibit complex drawdown responses and borehole without any influence from the pumping at the Lez station.
slopes and amplitudes of the drawdowns increased when the natural discharge at the Lez spring decreased (highlighted in blue and orange inFig. 3b, and blue and orange curves in 3c). Once the discharge at the Lez spring had stopped, the slope and the amplitude of the daily drawdowns stabilized, while the water level continued to decrease (highlighted in red inFig. 3b, and red curves in 3c). As illustrated inFig. 4, similar drawdown behaviors can be observed at the Terrieu and Claret boreholes that follow the drawdowns at the Lez pumping station. Bois des Avants borehole only presents daily responses under high water level conditions.
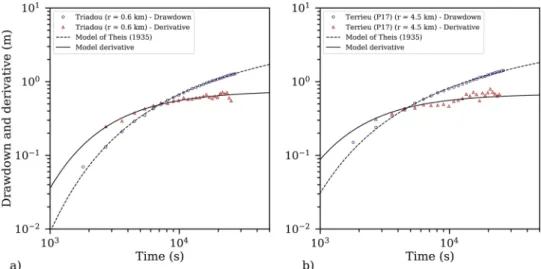
The hydrological conditions (i.e., high and low water levels) related to the Lez spring flow conditions (i.e., overflow or no overflow) have a strong impact on hydraulic responses due to the daily pumping tests at regional scale (Figs. 3 and 4).Drogue and Delaunay (1992)previously demonstrated that the singular evolutions of the hydraulic heads are related to the transition from a flow with pseudo-constant head (overflow) to a flow with variable head (no overflow) as a consequence of the pumping. When the discharge at the Lez spring is higher or equal to the pumping rate (green and blue cycles onFig. 3), the daily drawdowns appear strongly impacted by boundary effects due to the Lez spring, which do not allow proper application of classical radial flow solution such asTheis (1935)or the Cooper-Jacob’s approximation. Accordingly, pumping test analysis was performed only for the period during which the discharge at the Lez spring was lower than the pumping rate (i.e., Q spring < Q pumping; orange cycles) or when the discharge at the Lez spring was zero (red cycles). In these cases, the spring effect was negligible or nil and the drawdown derivatives obtained using the method ofBourdet et al. (1989)seem to tend to radial flow, even though the derivative may be not stabilized because of the short duration of the daily pumping (Fig. 5). BecauseTheis’ (1935)model can properly reproduce this behavior (Fig. 5), this solution was used to estimate the transmissivity. The use of a more complex model cannot be justified from this drawdown behavior, although the system is heterogeneous. Therefore, the interpretation usingTheis’ (1935)model was focused on six pumping periods without impact of the discharge flow at the Lez spring (orange and red cycles onFig. 3).Table 2presents the hydraulic properties estimated for these pumping cycles at the Triadou and Terrieu (P17) boreholes. The estimated transmissivities, which are relatively constant and similar for these boreholes, are characterized by a geometric mean of 1.0 × 10⁻¹m2s−1for the
Triadou borehole and 1.1 × 10⁻¹m2s−1for the Terrieu borehole. The estimated storativities are also relatively constant between the
different pumping cycles analyzed, but different between the boreholes. The geometric means of estimated storativity are 4.4 × 10⁻³
for the Triadou borehole and 5.5 × 10⁻⁵for the Terrieu borehole.
3.2.3. Radial composite flow model
The previous interpretations using the classical radial flow solution at early (i.e., daily responses analysis) and late times (i.e., seasonal responses analysis) highlighted some changes in the hydraulic properties with the duration of the pumping and therefore with the investigation scale. To consider this observation, hydrodynamic responses at the Lez aquifer were analyzed with a radial composite flow model. This interpretation has been performed using the semi-analytical solution ofButler (1988), which assumes nonuniform aquifer with a pumping well located at the center of a first domain embedded within an infinite second domain of different hydraulic properties. This simple configuration does not pretend to discretize the high level of heterogeneity of the karst
Table 1
Characteristics of the seasonal pumping responses at regional scale over 74 days of the pumping at the Lez station in June-August 2012 (at low water level conditions with no flow discharge at the Lez spring) with average pumping rate of 4134 m3h−1(1.15 m3s−1). “Distance” refers to the radial
distance between the Lez pumping station and each observation well and “Δs” refers to the maximum drawdowns during the analyzed period. The transmissivity (T) and storativity (S) were estimated from Cooper-Jacob’s method.
Drawdowns description compared to the pumping well
response Location Distance (km) Δs (m) T (m
2s−1) S (–) D = T/S (m2s−1)
Pumping well Lez pumping station 0 22.1 6.3 × 10⁻³ – –
Similar trend and amplitude + daily responses
observed Triadou 0.6 20.6 6.1 × 10
−3 6.3 × 10⁻² 0.1
Terrieu site (P20) 4.5 20.6 6.1 × 10⁻³ 1.1 × 10⁻³ 5.8
Claret Brissac 16 20.6 6.1 × 10⁻³ 8.2 × 10⁻⁵ 74.4
Similar trend and amplitude Les Matelles 4 17.7 7.8 × 10⁻³ 1.9 × 10⁻³ 4.1
Bois de Saint Mathieu 7 21.4 5.7 × 10⁻³ 4.7 × 10⁻⁴ 12.1
Similar shape but smaller amplitude Gour Noir 2 14.4 6.1 × 10⁻³ 9.0 × 10⁻³ 0.7
St Gely du Fesc 4 12.8 6.6 × 10⁻³ 2.3 × 10⁻³ 2.9
Ste Croix de Quintillargues 7 12.8 6.8 × 10⁻³ 8.0 × 10⁻⁴ 8.5
Mas de Martin 12.5 12.3 7.2 × 10⁻³ 2.6 × 10⁻⁴ 27.7
Bois des Rosiers 12.5 12.8 7.3 × 10⁻³ 2.4 × 10⁻⁴ 30.4
Drawdowns with different inflexion Bois des Avants 4 14.7 4.2 × 10⁻³ 1.8 × 10⁻³ 2.3
Fontanès 10 16.5 3.8 × 10⁻³ 2.8 × 10⁻⁴ 13.6
No drawdown response Viols en Laval 1 8.8 – – – –
Viols en Laval 2 6.7 – – – –
aquifer, but can properly reproduce the global behavior of the pumping responses (seeFig. 6).
Fig. 6shows, in log-log and semi-log plots, the measured drawdowns and the modeling using the composite model ofButler (1988)for the Lez pumping station, and the observation borehole Bois de Saint Mathieu. This observation borehole presents a similar behavior of the pumping well but without daily variations (seeFig. 2b). The drawdown derivative is represented in green for the data and with a continuous black line for the model. Note that the drawdown derivatives were noisy, especially at the Lez station, and has been strongly filtered to improve clarity. One can observe here that the radial composite flow model ofButler (1988)can properly describe the observed regional drawdown behavior in agreement with the transmissivities obtained from daily and late times sea-sonal responses analyses using Theis’ and Cooper-Jacob’s methods, respectively.
The estimated hydraulic parameters obtained with the composite model are presented inTable 3. A radius of 5 km was fixed for the first domain extension with the transmissivity T1of 5.0 × 10⁻¹m2s−1, close to the estimates obtained from daily drawdown
analyses usingTheis’ (1935)model. The second domain had a transmissivity T2of 6.0 × 10⁻³m2s−1corresponding to the geometric
mean of the transmissivity estimates obtained from late times analyses of the seasonal drawdowns using Cooper-Jacob's method. The storativity estimate of the first domain (S1) ranges from 7. 5 × 10⁻⁴to 6.5 × 10⁻³and the storativity estimate of the second domain
(S2) ranges from 5.0 × 10⁻⁵to 1.0 × 10⁻⁴.
Fig. 3. Influence of the hydrological conditions on the hydrodynamic response at the Triadou borehole: a) Hydrodynamic behavior of the Triadou
borehole from April to June 2012; b) Drawdown at the Triadou borehole in response to daily pumping rate variations at the Lez station (red line) and evolution of the natural discharge at the Lez spring (blue line); c) semi-log plot of the drawdown observed at the Triadou borehole for each pumping cycle (For interpretation of the references to colour in this figure legend, the reader is referred to the web version of this article).
Fig. 4. Semi-log plot of the drawdowns observed at the Lez pumping station and at the observation boreholes Triadou, Bois des Avants, Terrieu
(P15) and Claret Brissac in response to the daily pumping variations at the Lez station during high water levels (flow discharge at the Lez spring) and during low water levels (no discharge at the Lez spring).
Fig. 5. Diagnostic plots of daily drawdown monitored at a) Triadou and b) Terrieu (P17) boreholes and its logarithmic derivative for the daily
pumping cycle in June 20, 2012 (Fig. 3). The model ofTheis (1935)is represented by a black dashed line for the drawdown curve and by a continuous black line for the derivative curve.
Table 2
Characteristics of the daily pumping responses at the Triadou and Terrieu (P17) boreholes due to the regional pumping at the Lez station, with no impact of discharge flow at the Lez spring (orange and red cycles inFig. 3). The transmissivity (T) and storativity (S) were estimated fromTheis’ (1935)model.
Cycles Duration (h) Qave.(m3s−1) Δs (m) T (m2s−1) S (–)
Triadou Terrieu (P17) Triadou Terrieu (P17) Triadou Terrieu (P17) 9 8.5 0.81 0.83 0.89 1.2 × 10⁻¹ 1.3 × 10⁻¹ 5.4 × 10⁻³ 6.7 × 10⁻⁵ 10 8 0.85 0.99 1.10 1.1 × 10⁻¹ 1.2 × 10⁻¹ 5.1 × 10⁻³ 5.7 × 10⁻⁵ 11 7.25 0.82 0.95 1.10 9.4 × 10⁻² 1.2 × 10⁻¹ 5.1 × 10⁻³ 5.5 × 10⁻⁵ 12 7 0.82 0.92 0.98 9.9 × 10⁻² 1.1 × 10⁻¹ 5.0 × 10⁻³ 6.7 × 10⁻⁵ 13 7.5 0.93 1.08 1.22 1.2 × 10⁻¹ 1.2 × 10⁻¹ 4.4 × 10⁻³ 5.7 × 10⁻⁵ 19 6 0.90 1.11 1.24 9.6 × 10⁻² 1.0 × 10⁻¹ 3.6 × 10⁻³ 4.8 × 10⁻⁵ 20 7.25 0.90 1.30 1.42 9.5 × 10⁻² 1.0 × 10⁻¹ 3.5 × 10⁻³ 4.2 × 10⁻⁵ 21 7.75 0.90 1.32 1.47 9.7 × 10⁻² 9.5 × 10⁻² 3.6 × 10⁻³ 4.9 × 10⁻⁵ Geometric mean 1.0 × 10⁻¹ 1.1 × 10⁻¹ 4.4 × 10⁻³ 5.5 × 10⁻⁵
4. Local scale investigations
4.1. Materials and methods
A pumping test was performed at the Terrieu experimental site (Fig. 1b) at borehole P0 during four days in April 2013 with a discharge rate of 50 m3h−1. Fifteen observation boreholes and the pumping well were monitored with TD and CTD-Diver
trans-ducers. The test was performed under high water level conditions with an initial water level at about 66.5 m amsl. Under these conditions, the daily interferences related to the pumping at the Lez station were minimized (see previous section) but still visible and superimposed on the local pumping test (Fig. 7). Pre-test water-level measurements have been used to identify and correct the regional effects (i.e., regional pumping interferences and water-level trend). In order to remove the influence of these regional
Fig. 6. Log-log plots of drawdown and drawdown derivative at a) the Lez pumping station and b) at the observation borehole Bois de Saint Mathieu.
The radial composite flow model ofButler (1988)is represented by a black dashed line for the drawdown curve and by a continuous black line for the derivative curve. The semi-log plots of the drawdowns observed and modeled c) at the Lez pumping station and d) at the observation borehole Bois de Saint Mathieu is provided to compare with the Cooper-Jacob's approximation method applied previously.
Table 3
Hydraulic properties estimated with the radial composite flow model ofButler (1988)for the long-term pumping test at the regional scale (a fixed radius of extension for the first domain: R = 5000 m and average pumping rate of 4134 m3h−1(1.15 m3s−1) have been considered).
Domain 1 Domain 2
Wells r (km) T1(m2s−1) S1(–) D1(m2s−1) T2(m2s−1) S2(–) D2(m2s−1)
Lez pumping station 0 1.0 × 100 3.0 × 10⁻³ 333 6.0 × 10⁻³ 1.0 × 10⁻⁴ 60
Triadou 0.6 5.0 × 10⁻¹ 3.3 × 10⁻³ 153 6.0 × 10⁻³ 1.0 × 10⁻⁴ 60
Terrieu site (P20) 4.5 5.0 × 10⁻¹ 3.0 × 10⁻³ 168 6.0 × 10⁻³ 1.0 × 10⁻⁴ 60
Claret Brissac 16 5.0 × 10⁻¹ 7.5 × 10⁻⁴ 668 6.0 × 10⁻³ 5.0 × 10⁻⁵ 120
Les Matelles 4 5.0 × 10⁻¹ 4.0 × 10⁻³ 125 6.0 × 10⁻³ 1.0 × 10⁻⁴ 60
Bois de Saint Mathieu 7 5.0 × 10⁻¹ 2.7 × 10⁻³ 185 6.0 × 10⁻³ 6.0 × 10⁻⁵ 100
Gour Noir 2 5.0 × 10⁻¹ 5.5 × 10⁻³ 91 6.0 × 10⁻³ 1.0 × 10⁻⁴ 60
St Gely du Fesc 4 5.0 × 10⁻¹ 6.5 × 10⁻³ 77 6.0 × 10⁻³ 5.0 × 10⁻⁵ 120
Ste Croix de Q. 7 5.0 × 10⁻¹ 4.8 × 10⁻³ 104 6.0 × 10⁻³ 1.0 × 10⁻⁴ 60
Mas de Martin 12.5 5.0 × 10⁻¹ 3.2 × 10⁻³ 156 6.0 × 10⁻³ 5.0 × 10⁻⁵ 120
Bois des Rosiers 12.5 5.0 × 10⁻¹ 2.7 × 10⁻³ 185 6.0 × 10⁻³ 5.0 × 10⁻⁵ 120
Bois des Avants 4 5.0 × 10⁻¹ 5.7 × 10⁻³ 88 6.0 × 10⁻³ 5.0 × 10⁻⁵ 120
Fontanès 10 5.0 × 10⁻¹ 2.7 × 10⁻³ 185 6.0 × 10⁻³ 5.0 × 10⁻⁵ 86
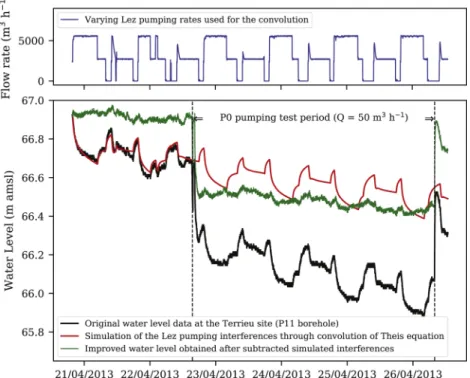
interferences, the superposition principle in time and space was used (Reilly et al., 1984;Olsthoorn, 2008). First, the responses to the Lez pumping variations observed a few days before the P0 pumping test were used to estimate the hydraulic properties withTheis’ (1935)solution for each observation well. Second, using the estimates of the hydraulic properties related to the Lez pumping and by convolution of theTheis’ (1935)solution with the flow rate variation at the Lez station (Olsthoorn, 2008), the theoretical responses to the Lez pumping cycles obtained in the Terrieu observation boreholes were predicted throughout the measured period, i.e., before and during the P0 pumping test. Third, the simulated interferences were subtracted from the data with a linear coefficient to correct the regional water level recession trend observed for this period (Fig. 7). This procedure made possible a drawdown derivative analysis in order to identify the flow regimes and thus improve the choice of the solution (Bourdet et al., 1989;Gringarten, 2008; Renard et al., 2009).
4.2. Results
The pumping test carried out at P0 in Terrieu induced significantly different drawdowns in all the nearby boreholes. The drawdown map clearly showed two main flow directions oriented at N070 and N160 (Fig. 8a). These features are well-known and were found consistently throughout the pumping tests conducted at the site. This is related to the structure of the reservoir, i.e., the main fracture directions, which control the flow around the boreholes (Drogue and Grillot, 1976;Jazayeri Noushabadi et al., 2011). Fig. 8b shows, in log-log plot, the drawdown and derivative curves obtained for the P4 borehole for the pumping test at P0, after removing most of the regional influences of the Lez pumping. At early times, the drawdown derivative reflects the behavior of the local main flow zone with a short radial flow response; then, the drawdown derivative decreases between 2 × 10³and 2 × 10⁴
seconds and then increases again. All the boreholes present the same kind of response characterized by a similar V-shape minimum on the drawdown derivative, typically associated with a double-porosity behavior (Gringarten, 1987;Renard et al., 2009). We thus considered that the flow regimes can be described through the double-porosity model ofMoench (1984). This model is based on the concept of a fractured system embedded within blocks of lower permeability, characterized by a matrix specific storage (Ssm) and a
matrix hydraulic conductivity (Km). The flow occurs from the fractures to the pumping well and the water stored in the matrix blocks
contributes to the flow in the fractures. A fracture skin is considered, which provides a resistance to flow from matrix to fractures (Moench, 1984). This transient analytical solution is derived for fully penetrating wells including wellbore storage and wellbore skin. Table 4presents the results obtained using the least-squares method to fit the model to the data (Fig. 8c). A constant fracture skin factor was set to fit the data using sf= 1. The transmissivity values obtained for the fractured system range from 2.7 × 10⁻³to
1.3 × 10⁻²m2s−1, and the storativity values range from 1.9 × 10⁻³to 1.3 × 10⁻¹. The block matrix presents variable hydraulic
conductivity ranging between 4.6 × 10⁻¹⁰ and 5.6 × 10⁻⁶m s−1 and specific storage ranging between 3.5 × 10⁻⁶ and
8.2 × 10⁻¹m−1. The diffusivity values estimated for the fracture system (D
f= Tf/Sf) are about 7000 times greater than for the
Fig. 7. Example of P11 water-level data processing (green curve) to improve the P0 pumping test analysis. The Lez pumping interference at the
Terrieu site (red curve) was simulated by convolving theTheis’ (1935)solution with the varying Lez pumping rates (blue curve), also accounting for the regional water-level trend with a linear coefficient correction, and then subtracted from the original data (black curve) (For interpretation of the references to colour in this figure legend, the reader is referred to the web version of this article).
matrix blocks (Dm= Km/Ssm).
5. Borehole scale investigations
5.1. Materials and methods
5.1.1. Methodology applied to the Terrieu boreholes
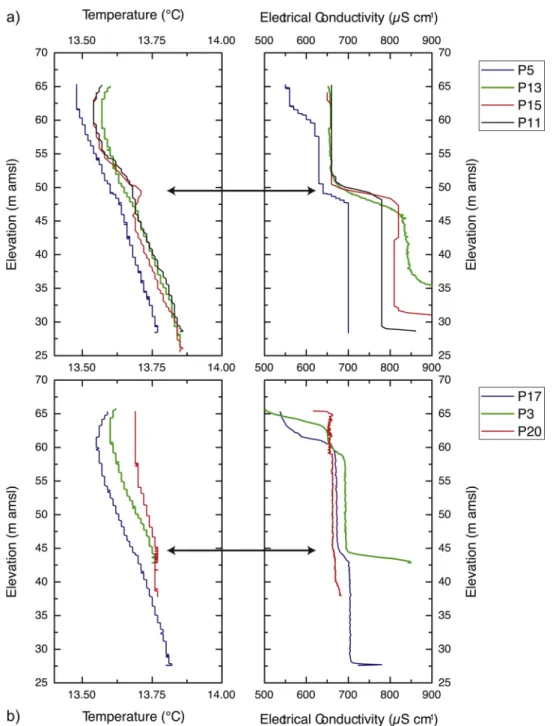
In order to locate the main flow zones along the boreholes, temperature and electrical conductivity loggings were performed under ambient conditions in several boreholes at the Terrieu site. Such logs may provide information on the location of the main flow zones if, at depth, fluid conductivity and temperature variations or anomalies are encountered that are likely to be related to water circulation in the borehole between the main flow zones (Drury, 1984;Keys, 1990;Chatelier et al., 2011;Klepikova et al., 2011). For a precise comparison, only the logs carried out at the same time are presented here (i.e., P3, P5, P11, P13, P15, P17, P20). The temperature was measured with an accuracy of ± 0.1 °C and the electrical conductivity was accurate to ± 1% of the reading. On average, the logs were made with 25 measurement points per meter.
To provide an estimate of the transmissivity of the main flow zones as well as of the surrounding fracture network and fissured matrix, 15 straddle-packer injection tests were made in P2, P5, P13 and P15 (Fig. 1b). To improve the estimate of the depth of the main flow zones in each borehole, borehole video logs were also used to control the borehole conditions before installing the packer system. Straddle packers were inflated at pressures from 7 to 12 bars depending on the water column above, in order to minimize the
Fig. 8. Hydrodynamic responses during the long-term pumping test at the Terrieu site: a) Map of drawdowns measured at different boreholes 80 h
after the beginning of the pumping test in P0; b) Diagnostic plot of drawdown monitored at P4 and its logarithmic derivative. The V-shape derivative is characteristic of double-porosity behavior. TheMoench (1984)model is represented by a black dashed line for the drawdown curve and by a continuous black line for the derivative curve; c) Drawdowns and fit obtained with theMoench’s (1984)solution using the least-squares method. Estimated parameters corresponding to the displayed matching curves are given inTable 4.
short-circuiting in the open borehole above and below the test interval. The hydraulic tests were conducted by injecting water into the 32 mm diameter inner pipes (NPS 1 ¼”) from a water tank at the surface to the 0.7 m interval by means of a pump. The injection rate was measured with a flow meter (with a range of 0.01 L s−1to 1.8 L s−1) and the water pressure was monitored inside, as well as
above and below the test interval, to identify potential short-circuiting. The injection reached quasi-steady state conditions after a few seconds or a few minutes, depending on the tested zone. A quasi-steady state was assumed to be reached when the pressure in the tested interval and the injection rate were both relatively constant. The transmissivity values were calculated by the Thiem’s method for steady-state flow in a confined aquifer (Bear, 1979;Quinn et al., 2012).
5.1.2. Methodology applied at the Triadou borehole
A 330 m deep borehole of 165 mm in diameter was drilled in the Valanginian, Berriasian and Kimmeridgian carbonates 580 m upstream of the Lez pumping station (Fig. 1c). In addition to cuttings analyses and video logs, rock resistivity measurements were carried out in the Triadou borehole to obtain a detailed characterization of the lithology and of the fractured zones (Fig. 11a and b). Many flow zones were first identified by air-lift during the drilling (black arrows inFig. 11b). In order to localize precisely and estimate the transmissivity of the main flow zones, single-borehole flowmeter tests in combination with temperature and electrical conductivity loggings were performed under both ambient and pumping conditions. Comparisons between the ambient and pumping flowmeter logs allow estimates of the transmissivity of the inflow zones (Paillet, 1998;Le Borgne et al., 2006;Lods, 2000). These measurements were carried out for a few hours on July 2, 2012, i.e., under low water level conditions. The vertical flowmeter profiles were obtained using a micro-impeller flowmeter, which can measure velocities to a minimum of 3 cm s−1. The flow profile under
pumping condition was conducted at approximately 16.8 m3h−1(280 L min−1) once the drawdown was relatively stable. The FLASH
program developed byDay-Lewis et al. (2011)was used for the analysis of the vertical flow logs. The model is based on an analytical solution for steady-state multi-layer (or discrete fractures) radial flow to a borehole (Paillet, 1998).
5.2. Results
5.2.1. At the Terrieu boreholes
The temperature and electrical conductivity logs obtained at the Terrieu site revealed at least one major flow zone.Fig. 9presents the temperature and electrical conductivity profiles in P3, P5, P11, P13, P15, P17, and P20 and shows variation from 13 °C to 14 °C for the temperature and from 500 to 900 μS cm−1for the electrical conductivity. These logs present one or two inflections with one
located near the water table at around 60 m amsl and the other located between 45 and 50 m amsl depending on the borehole location. The second inflection is more or less marked but appears in all the boreholes. This flow zone determined from the tem-perature and electrical conductivity logs can be visible through borehole video investigations, and confirms the presence of an active karst conduit in some boreholes (i.e., P0, P8, P11, P12, P15).
The 15 straddle-packer injection tests conducted in the boreholes P2, P5, P13 and P15 reveal a strong variability of the trans-missivity over five orders-of-magnitude, ranging from 7.2 × 10⁻⁸to 5.2 × 10⁻³m2s−1. All results are presented inTable 5. The
transmissivity values obtained for the major flow zone also show a variability ranging from 1.3 × 10⁻⁶to 5.2 × 10⁻³m2s−1
de-pending on the location of the borehole. Some previous estimates of the transmissivity from single-hole vertical flow measurements with an electromagnetic flowmeter (Lods, 2000) conducted in boreholes P2, P5 and P16 (seeTable 5), appear very consistent for this
Table 4
Computed hydraulic parameters with theMoench’s (1984)model for the long-term pumping test at the local scale in borehole P0 at Terrieu (fixed parameters for skin well: sw= 1, skin fracture sf= 1, aquifer thickness: e = 100 m, and slab blocks thickness: b = 10 m).
Fracture system Blocks parameters
Wells r (m) Tf(m2s−1) Sf(–) Dfracture(m2s−1) Km(ms−1) Ssm(m−1) Dblocks(m2s−1)
P0 0 2.7 × 10⁻³ 1.3 × 10−5* 207.35* 2.9 × 10−9 6.3 × 10⁻⁶ 4.6 × 10⁻⁴ P2 5.54 3.7 × 10⁻³ 2.0 × 10⁻³ 1.85 1.1 × 10⁻⁷ 3.1 × 10⁻⁴ 3.5 × 10⁻⁴ P3 1.44 4.7 × 10⁻³ 7.5 × 10−6* 623.38* 4.6 × 10−10 3.5 × 10⁻⁶ 1.3 × 10⁻⁴ P4 6.09 4.4 × 10⁻³ 1.3 × 10⁻¹ 0.03 5.6 × 10⁻⁶ 1.3 × 10⁻¹ 4.3 × 10⁻⁵ P5 11 6.5 × 10⁻³ 4.8 × 10⁻² 0.14 5.6 × 10⁻⁶ 7.5 × 10⁻² 4.6 × 10⁻⁵ P7 6.91 6.4 × 10⁻³ 6.6 × 10⁻² 0.10 5.6 × 10⁻⁶ 2.0 × 10⁻² 2.9 × 10⁻⁵ P8 3.78 1.3 × 10⁻² 1.1 × 10⁻¹ 0.11 5.6 × 10⁻⁶ 8.2 × 10⁻¹ 6.8 × 10⁻⁶ P9 5.5 2.8 × 10⁻³ 1.6 × 10⁻² 0.17 1.4 × 10⁻⁶ 3.5 × 10⁻² 4.1 × 10⁻⁵ P11 20.7 1.2 × 10⁻² 1.9 × 10⁻³ 6.51 1.1 × 10⁻⁷ 1.1 × 10⁻³ 1.1 × 10⁻⁴ P12 10.4 1.2 × 10⁻² 1.8 × 10⁻² 0.66 1.1 × 10⁻⁶ 8.6 × 10⁻³ 1.2 × 10⁻⁴ P13 8.3 4.3 × 10⁻³ 1.5 × 10⁻² 0.29 1.5 × 10⁻⁶ 7.4 × 10⁻² 2.1 × 10⁻⁵ P15 14.4 1.3 × 10⁻² 5.4 × 10⁻³ 2.37 2.9 × 10⁻⁷ 2.7 × 10⁻³ 1.1 × 10⁻⁴ P16 13.2 5.1 × 10⁻³ 1.5 × 10⁻² 0.34 1.6 × 10⁻⁶ 1.5 × 10⁻¹ 1.1 × 10⁻⁵ P17 14.5 3.4 × 10⁻³ 5.9 × 10⁻² 0.06 3.4 × 10⁻⁶ 9.2 × 10⁻² 3.7 × 10⁻⁵ P20 28.8 1.2 × 10⁻² 3.4 × 10⁻³ 3.48 2.3 × 10⁻⁷ 1.8 × 10⁻³ 1.3 × 10⁻⁴ P21 22 1.2 × 10⁻² 6.6 × 10⁻² 1.81 3.6 × 10⁻⁷ 2.7 × 10⁻³ 1.3 × 10⁻⁴ Geometric mean 6.3 × 10⁻³ 1.6 × 10⁻² 0.42 4.5 × 10⁻⁷ 7.1 × 10⁻³ 6.3 × 10⁻⁵
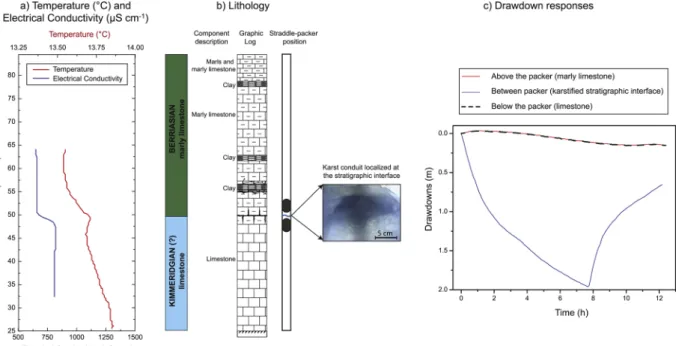
main flow zone. Interestingly, a passive observation at the P15 borehole using a straddle-packer system positioned in front of this main flow zone (i.e., karst conduit) shows a strong influence by the Lez pumping in the isolated interval while observations above and below the packer system did not show a significant one (Fig. 10). This main flow zone located at around 50 m amsl corresponds to the elevation of the stratigraphic interface between marly limestone and hard limestone, potentially related to the Berriasian-Kimmer-idian transition (Fig. 10b). Remember that the continuous water level monitoring at the P20 borehole (Fig. 2a) showed that the amplitude of daily drawdowns due to the Lez pumping strongly decreases at the Terrieu site when the water levels are below 45 m amsl corresponding to the elevation of this main flow zone (Fig. 9b).
5.2.2. At the Triadou borehole
Fig. 11shows the different logs registered at the Triadou borehole. Electrical resistivity log (Fig. 11a) shows clear lithology transitions with depth between the Valanginian, the Berriasian and the Kimmeridgian carbonates. The electrical resistivity increases
Fig. 9. Temperature and electrical conductivity logs in the P5, P13, P15, P11 boreholes at the Terrieu experimental site, made in June 2012 (a) and
because of decreasing clay content in these carbonate facies. The borehole crosses first 200 m of Early Valanginian marls and marly limestone, before crossing 70 m of Berriasian (Early Cretaceous) limestone and 60 m of Upper Jurassic limestone (Fig. 11b).
The temperature and electrical conductivity logs show inflections that are characteristics of the main flow zones (Fig. 11c and d). The vertical flowmeter profiles (Fig. 11e) are fully consistent with the temperature and electrical conductivity logs. Six important flow zones, which are numbered in theFig. 11, have been revealed by all the logs. In ambient condition, flow measurements were between 20 L min−1and 53 L min−1. The downward flow observed in this condition could be attributed to the Lez pumping that
significantly impacts the Triadou borehole (Fig. 3). Interestingly, two major outflows are located in the Berriasian limestone (zones 3 and 5) where one is located at the interface between the Berriasian and the Kimmeridgian limestones (Fig. 11). Under pumping conditions, these two major flow zones contribute to the flow by 65% of the total pumping rate. The estimated transmissivities using the FLASH program (Day-Lewis et al., 2011) range from 1.5 × 10⁻⁴to 5.1 × 10⁻⁴m2s−1(Table 5) where the transmissivity in zone
(5) is the highest one.
6. Discussion
6.1. Hydraulic properties of the Lez aquifer
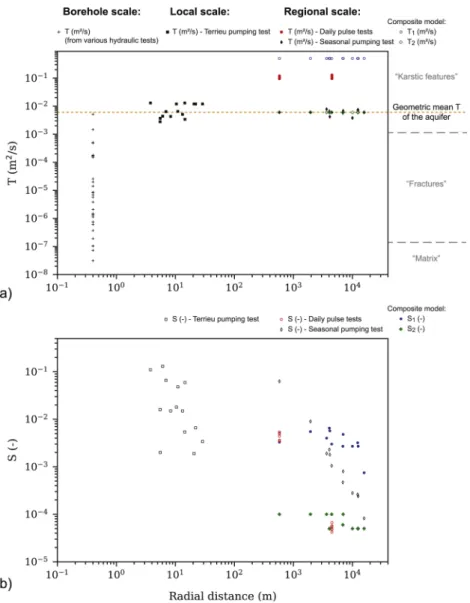
The numerous hydraulic tests performed at different spatial scales, from a few meters to more than 15 km, and temporal scales, from a few minutes to a few months, displayed a strong hydraulic property variability of the Lez karst aquifer (seeTables 1–5). The synthesis of these hydraulic properties is provided inFig. 12.
The transmissivity values obtained at the borehole scale are, as expected, strongly variable and range from 3.1 × 10⁻⁸to
5.2 × 10⁻³m2s−1. This large range is mainly due to the methods used, which allow to discretize and investigate low to high
permeability features corresponding to fissured matrix and fractured-karstic network, respectively. Straddle-packer injection tests
Table 5
Characteristics of the hydraulic tests at the borehole scale with the transmissivities obtained for the different tested zones in the boreholes of the Terrieu experimental site and the Triadou borehole. Data in bold represent the position and the transmissivity values of the main tested flow path. Details and complementary information about the different tests and analytical methods can be found inLods (2000)andDausse (2015).
Well Hydraulic tests Interpretation method Elevation of the tested zones (m amsl) T (m
2s−1)
P2 Terrieu Constant head injection tests (Lods,
2000) Lods’ (2000)solution* Full length 1.8 × 10
−4
Single-hole electromagnetic flowmeter
tests (Lods, 2000) Lods’ (2000)solution* 60.6 - 56.6 2.0 × 10
−5
46.6 - 45.6 1.6 × 10⁻⁴
Straddle-packer injection tests (Dausse,
2015) Thiem’s equation 59.9 - 59.2 2.6 × 10 −5** 59.6 - 58.9 6.1 × 10⁻⁷** 53.3 - 52.6 5.7 × 10⁻⁶ 52.3 - 51.6 1.4 × 10⁻⁶ 47.0 - 46.3 1.4 × 10⁻⁵** 42.8 - 42.1 1.0 × 10⁻⁷ 32.4 - 31.7 7.0 × 10⁻⁶**
P5 Terrieu Constant head injection tests (Lods,
2000) Lods’ (2000)solution* Full length 3.8 × 10
−6
Single-hole electromagnetic flowmeter
tests (Lods, 2000) Lods’ (2000)solution* 62.5 - 60.5 7.5 × 10
−7
49.5 - 48.5 7.4 × 10⁻⁷
48.5 - 47.5 2.1 × 10⁻⁶
Straddle-packer injection tests (Dausse,
2015) Thiem’s equation 62.5 - 61.8 1.9 × 10
−7**
49.2 - 48.5 1.3 × 10⁻⁶
48.5 - 47.8 1.1 × 10⁻⁶
P13 Terrieu Straddle-packer injection tests (Dausse,
2015) Thiem’s equation 47.0 - 46.3 1.5 × 10
−6
37.7 - 37.0 7.2 × 10⁻⁸
P15 Terrieu Straddle-packer injection tests (Dausse,
2015) Thiem’s equation 58.7 - 58.0 1.1 × 10
−7
50.8 - 50.1 3.1 × 10⁻⁸**
50.3 - 49.6 5.2 × 10⁻³**
P16 Terrieu Constant head injection tests (Lods,
2000) Lods’ (2000)solution* Full length 8.7 × 10
−6
Single-hole electromagnetic flowmeter
tests (Lods, 2000) Lods’ (2000)solution* 63.2 - 62.2 3.7 × 10
−7
56.2 - 52.2 8.2 × 10⁻⁶
Triadou Single hole pumping test (Dausse, 2015) Theis’ (1935)solution Full length 1.5 × 10⁻³
Single-hole spinner flowmeter tests
(Dausse, 2015) FLASH (Flow-Log Analysis of Single Holes) programbased on the solution ofPaillet (1998) (2): 37 - 32 1.7 × 10
−4
(3): -128 - -133 4.8 × 10⁻⁴
(4): -140 - -146 1.6 × 10⁻⁴
(5): -172 - -178 5.1 × 10⁻⁴
(6): -237 - -240 1.5 × 10⁻⁴
* Lods (2000): solution for steady-state radial flow included non-linear skin effects. ** Average values from 2 or 3 tests performed on the same zone.
cover a broad range of transmissivity values, with some low estimates related to the fissured rock matrix while the impeller flowmeter instrument detects higher-permeability zones, generally related to the fracture network or karstic features (Fig. 11). At the local scale (P0 pumping test), the transmissivities appear less variable compared to straddle-packer tests and range from 2.7 × 10⁻³ to
1.3 × 10⁻²m2s−1, with a geometric mean value of 6.3 × 10⁻³m2s−1. The geometric mean transmissivity value obtained by
pumping tests may correspond to the effective transmissivity of the investigated volume of the reservoir (Meier et al., 1998). Note that the transmissivity estimates can also be influenced by the location of the pumping well (e.g.,Jazayeri Noushabadi et al., 2011). At the regional scale, the transmissivity values obtained using the Cooper-Jacob’s method to analyze the long-term behavior (i.e., late times drawdown data of the seasonal pumping) also appear less variable and range from 3.8 × 10⁻³to 7.8 × 10⁻³m2s−1.
Inter-estingly, the geometric mean transmissivity value of 6.0 × 10⁻³m2s−1(Table 1) appears similar to the mean transmissivity value
Fig. 10. Main karstic flow paths into borehole P15: location of the preferential flow path using a) The temperature and electrical conductivity logs;
b) Lithology log from interpretation of drill cuttings (modified fromPitard, 1976) with position of the straddle-packer isolating the karst conduit at 50 m amsl; c) Drawdown responses in P15 above, between and below the straddle-packer in response to pumping at the Lez station.
Fig. 11. Geological and hydrogeological logs in the Triadou borehole. a) The resistivity log of the formation has a wide range of values between a
lithology rich in clay minerals (Valanginian marls) and more resistive Berriasian marly-limestone and Kimmeridgian limestone; b) Lithology log from interpretation of drill cuttings and resistivity logs; several water inflows were observed during drilling; c) Electrical conductivity; d) Temperature; e) Flowmeter logs measured under ambient and pumping conditions. The straight black line represents the flow modeled with the Paillet’s (1998)solution. Six preferential flow zones, identified by number 1 to 6 in logs, were located into the Triadou borehole.
obtained at the local scale by P0 pumping test, which might suggest that the geometric mean transmissivity of the reservoir is about 6.1 × 10⁻³m2s−1. The interpretation of the daily drawdown observations showed higher values of transmissivity, with a geometric
mean value of 1.0 × 10⁻¹m2s−1(Table 2), suggesting a higher hydraulic connectivity between the observation boreholes and the
main pumped karstic drain. Daily pumping tests may be comparable to high-frequency hydraulic periodic tests (i.e., in this case pulse tests), which appear more sensitive to local heterogeneity (Cardiff et al., 2013;Guiltinan and Becker, 2015) and to the main flow path network composed of highly conductive features (Fischer et al., 2018b). Indeed, sensitivity of observed drawdown to aquifer het-erogeneity are known to be different related to the period of the pumping test (Cardiff et al., 2013). Proximity of the pumping well to higher permeable zone may cause a local increase in transmissivity estimated at shorter periods of pumping (Guiltinan and Becker, 2015). The daily responses related to short periods of pumping are thus mainly impacted by the high transmissivity of the terminal karst conduit where the pumping well is located. The seasonal responses are related to long period of pumping test that investigate larger volume of the aquifer. The seasonal pumping effects appear to better integrate all the components of the reservoir that may contribute to flow. The long-time behaviors are known to be independent of the local heterogeneities (Butler and Liu, 1991). The lack of sensitivity to pumping well position is thus expected because transmissivity is derived from the late times behavior of the seasonal drawdowns. The different level of heterogeneity (i.e., contrasted transmissivity) can be here represented at the first order using the radial composite flow model ofButler (1988), which allows to simulate the global behavior (early and late times) of the regional drawdowns. The interpretation using this model considers a first domain of high transmissivity (relatively similar to the mean transmissivity estimated from daily drawdowns analysis) embedded in a second domain of lower transmissivity corresponding to the mean transmissivity estimated from late times of seasonal drawdowns analysis.
Many investigations of karst aquifers point to increasing transmissivity as a function of the measurement scale (e.g.,Kiràly, 1975;
Fig. 12. Synthesis of hydraulic parameters of the Lez aquifer estimated at borehole scale (Table 5), local scale (Table 4) and regional scale (Tables 3 and 2 and 1): a) Transmissivity, b) Storativity.