HAL Id: insu-01477149
https://hal-insu.archives-ouvertes.fr/insu-01477149
Submitted on 27 Feb 2017
HAL is a multi-disciplinary open access
archive for the deposit and dissemination of
sci-entific research documents, whether they are
pub-lished or not. The documents may come from
teaching and research institutions in France or
abroad, or from public or private research centers.
L’archive ouverte pluridisciplinaire HAL, est
destinée au dépôt et à la diffusion de documents
scientifiques de niveau recherche, publiés ou non,
émanant des établissements d’enseignement et de
recherche français ou étrangers, des laboratoires
publics ou privés.
between on and off craton regions of the South African
plateau inferred from apatite fission track and
(U-Th-Sm)/He thermochronology
Mark Wildman, Roderick Brown, Cristina Persano, Romain Beucher, Finlay
Stuart, Vhairi Mackintosh, Kerry Gallagher, James Schwanethal, Andrew
Carter
To cite this version:
Mark Wildman, Roderick Brown, Cristina Persano, Romain Beucher, Finlay Stuart, et al..
Con-trasting Mesozoic evolution across the boundary between on and off craton regions of the South
African plateau inferred from apatite fission track and (U-Th-Sm)/He thermochronology. Journal
of Geophysical Research : Solid Earth, American Geophysical Union, 2017, 122 (2), pp.1517-1547.
�10.1002/2016JB013478�. �insu-01477149�
Contrasting Mesozoic evolution across the boundary
between on and off craton regions of the South African
plateau inferred from apatite
fission track
and (U-Th-Sm)/He thermochronology
Mark Wildman1,2 , Roderick Brown1 , Cristina Persano1, Romain Beucher1,3, Finlay M. Stuart4, Vhairi Mackintosh5 , Kerry Gallagher6 , James Schwanethal7 , and Andrew Carter8
1
School of Geographical and Earth Sciences, College of Science and Engineering, University of Glasgow, Glasgow, Scotland,
2Now at Géosciences Rennes, Université de Rennes, Rennes, France,3Now at School of Earth Sciences, University of
Melbourne, Melbourne, Victoria, Australia,4Scottish Universities Environmental Research Centre, East Kilbride, Scotland,
5School of Earth Sciences, University of Melbourne, Melbourne, Victoria, Australia,6Géosciences Rennes, Université de
Rennes, Rennes, France,7Department of Earth Sciences, University College London, London, UK,8Department of Earth and Planetary Sciences, Birkbeck, University of London, UK
Abstract
The timing and mechanisms involved in creating the elevated, low-relief topography of the South African plateau remain unresolved. Here we constrain the thermal history of the Southwest African plateau since 300 Ma by using apatitefission track (AFT) and (U-Th-Sm)/He (AHe) thermochronology. Archean rocks from the center of the Kaapvaal Craton yield AFT ages of 331.0 ± 11.0 and 379.0 ± 23.0 Ma and mean track lengths (MTLs) of 11.9 ± 0.2 and 12.5 ± 0.3μm. Toward the southwest margin of the craton and in the adjacent Paleozoic mobile belt, AFT ages are significantly younger and range from 58.9 ± 5.9 to 128.7 ± 6.3 Ma and have longer MTLs (>13 μm). The range of sample AHe ages complements the AFT ages, and single-grain AHe ages for most samples are highly dispersed. Results from joint inverse modeling of these data reveal that the center of the craton has resided at near-surface temperatures (<60°C) since 300 Ma, whereas the margins of the craton and the off-craton mobile belt experienced two discrete episodes of cooling during the Cretaceous. An Early Cretaceous cooling episode is ascribed to regional denudation following continental breakup. Late Cretaceous cooling occurs regionally but is locally variable and may be a result of a complex interaction between mantle-driven uplift and the tectonic setting of the craton margin. Across the entire plateau, samples are predicted to have remained at near-surface temperatures throughout the Cenozoic, suggesting minimal denudation (<1 km) and relative tectonic stability of the plateau.1. Introduction
Elevated, low-relief interior plateaus are a defining morphological feature of high-elevation continental mar-gins [Bishop, 2007; Blenkinsop and Moore, 2013]. They are typically considered to be tectonically inactive hav-ing experienced only limited deformation that is largely restricted to gentle, long-wavelength warphav-ing [e.g., Moore et al., 2009; Cloetingh et al., 2013]. The South African plateau is surrounded by classic high-relief escarp-ment zones. It is arguably the type-example of a high-elevation continental margin, yet both its mode of for-mation and its subsequent evolution remain controversial.
The mechanism that generated the high elevation of the plateau, and the timing of plateau formation, is at the center of the controversy [e.g., Partridge and Maud, 1987; Brown et al., 2002; Braun et al., 2014; Rudge et al., 2015; Green et al., 2016]. Insights from geodynamic models support the hypothesis that vertical stresses imposed at the base of the lithosphere by the vertical component of mantleflow will induce significant uplift (or subsidence for downwelling mantle) of the interior plateau [e.g., Gurnis et al., 2000; Moucha et al., 2008; Braun, 2010; Forte et al., 2010; Flament et al., 2014]. It is also significant that recent thermomechanical models that simulate the interaction between mantle convection and the overlying lithosphere suggest that brittle deformation of the upper crust at short-wavelength scales may also occur in tandem with longer wavelength (plume-induced) uplift of the lithosphere [e.g., Burov and Cloetingh, 2009; Guillou-Frottier et al., 2012; Cloetingh et al., 2013; Koptev et al., 2015]. In addition to deformation arising from these vertical stresses applied at the base of the lithosphere, horizontal stresses arising from plate boundary and plate kinematic changes may propagate significant distances and drive local, brittle deformation and reactivation of pre-existing
Journal of Geophysical Research: Solid Earth
RESEARCH ARTICLE
10.1002/2016JB013478
Key Points:
• New AFT and AHe data reveal contrasts in the thermal history of on- and off-craton regions during the Mesozoic
• Interior craton has stayed at less than 60 degrees Celsius since 300 Ma; off-craton experienced two discrete episodes of cooling during the Cretaceous
• Late Cretaceous denudation focused along basement structures at the craton margin and is linked to the erosion of uplifted fault blocks
Supporting Information: • Supporting Information S1 Correspondence to: M. Wildman, mark.wildman@univ-rennes1.fr Citation:
Wildman, M., R. Brown, C. Persano, R. Beucher, F. M. Stuart, V. Mackintosh, K. Gallagher, J. Schwanethal, and A. Carter (2017), Contrasting Mesozoic evolution across the boundary between on and off craton regions of the South African plateau inferred from apatite fission track and (U-Th-Sm)/He thermochronology, J. Geophys. Res. Solid Earth, 122, doi:10.1002/2016JB013478.
Received 22 AUG 2016 Accepted 2 FEB 2017
Accepted article online 3 FEB 2017
©2017. American Geophysical Union. All Rights Reserved.
structures within continental interiors [Daly et al., 1989; Janssen et al., 1995; Guiraud and Bosworth, 1997; Fairhead et al., 2013; Viola et al., 2012; Pérez-Díaz and Eagles, 2014; Salomon et al., 2014, 2015].
Continental interiors are often centered around Archean-Paleoproterozoic cratons that are surrounded by Neoproterozoic orogenic belts. In the case of Southern Africa, the Mesoproterozoic-to-Neoproterozoic regions are characterized by a distinct tectonic fabric that developed during early accretion of older cratons [Jacobs et al., 1993; Karlstrom and Humphreys, 1998]. The southwest corner of the Kaapvaal Craton and its boundary with the Namaqua mobile belt represent such a tectonic setting with prominent NW-SE trending thrust faults and shear zones defining the craton boundary (Figures 1 and 2). Recent work has shown that due to thermal, compositional, and structural contrasts across the craton margin, regional stresses and/or mantle instabilities may become focused at the craton margin and induce intraplate deforma-tion along lithospheric-scale craton boundary faults [Lenardic et al., 2000, 2003; Guillou-Frottier et al., 2012]. In this paper we present 17 new apatitefission track (AFT) and 103 single-grain apatite (U-Th-Sm)/He (AHe) ana-lyses from the Bushmanland Plateau. Using a Bayesian transdimensional approach to thermal history inversion [Gallagher, 2012], temperature-time cooling paths are obtained for each sample. The thermal histories are used to derive magnitudes of denudation and evaluate the timing and pattern of uplift and intracontinental defor-mation across this region of the South African plateau. The new data indicate that at the structurally complex zone at the craton margin an equally complex spatial pattern of deep erosion characterized the Late Cretaceous, which could be explained by post-breakup deformation driving uplift and focusing denudation.
2. Geomorphology and Geology
2.1. Geomorphic Setting
The study area is located within the South African plateau and is characterized by an extensive low-relief plain where elevations range between 800 and 1000 m in the west and 1200 and 1400 m in the east
Figure 1. (top right) Location of the Bushmanland Plateau study area relative to Southern Africa. The grey shading indicates extent of the“on-craton” region, and the
brown shading indicates the“off-craton” region. KC = Kaapvaal Craton, NNMB = Namaqua-Natal Mobile Belt, CFB = Cape Fold Belt, KB = Kheis Belt, R = Rehoboth,
DMB = Damara Mobile Belt, OB = Okwa Block, MB = Magondi Belt, LB = Limpopo Belt, MMB = Mozambique Mobile Belt. (top left) DEM of Bushmanland Plateau study
area created by using SRTM90m data. The red line indicates craton boundary. (bottom) Elevation profile (dog-legged) showing the location of samples from this
(Figure 1). In the northeast of the study area, the Asbestos Hills, which achieve elevations of up to 1600 m, mark the transition from the rocks of the Proterozoic Namaqua mobile belt to those of the Archean Kaapvaal Craton. The plateau forms the hinterland to the divergent continental margins of Southern Africa and is separated from low elevation, moderate relief coastal plains by a prominent escarpment zone of significantly higher relief [Gilchrist et al., 1994; Brown et al., 2002; Blenkinsop and Moore, 2013].
The Orange River, the largest catchment in South Africa and responsible for draining ~80% of the subconti-nent, enters the study area in the southeast and exits in the west before continuing westward toward the Atlantic Ocean (Figure 1). At the town of Douglas, the northwest trending Orange River (Figure 1) converges with the southwestflowing Vaal River, which drains northeast South Africa. North of Prieska, the Orange River follows the major NW-SE structural trend of the Kheis Front and, specifically, the Doringberg Lineament, which marks the tectonic boundary between the Kaapvaal Craton and the Namaqua Belt. After continuing on this trend for ~170 km, the Orange River meanders as itflows west through the towns of Upington and Kakamas. The main Orange River channel includes several significant knickpoints along its course,
Figure 2. (a) Geological map of the Bushmanland Plateau. The geological map was redrawn to highlight the major geological units, structures, and features relevant to this study, using 1:1 × 1,000,000 map produced by the Council for Geoscience, South Africa [Fourie and Cole, 1997]; (b) schematic geological cross section of the Namaqualand Metamoprhic Province after Thomas et al. [1994]. Fault names: PS = Poffader Shear Zone; HT = Hartbees Thrust; BoS = Bouzen River Shear Zone;
particularly the 90 m Augrabies Falls [Tooth and McCarthy, 2004; Dauteuil et al., 2013; Paul et al., 2014], which is downstream to the west of the study area. The Vaal Riverflows within a prominent (up to 300 m deep) NW-SE trending valley into the Kaapvaal Craton.
The main drainage network of the Orange River has been in place from the middle-to-Late Cretaceous [Partridge and Maud, 1987; Dollar, 1998; de Wit, 1999, 2009]. Below the Augrabies Falls, the preservation of Pliocene, middle Miocene, and possibly Eocene river terraces indicates that there has been moderate channel incision of the lower Orange River through the Tertiary [de Wit, 1999; Jacob et al., 1999]. Preserved middle-to-Late Cretaceous diamond bearing and fossiliferous alluvial gravels in the upper Vaal support the antiquity of the present drainage network (Mahura Muthla channel [de Wit et al., 2009]; the Mahura Muthla channel is proposed to have fed the Kalahari paleoriver, which exited into the Atlantic at the present-day position of the lower Orange River and had captured the Upper Karoo River (composed of the present-day middle and upper Orange River and Vaal River) by the end of the Cretaceous [de Wit, 1999; de Wit et al., 2009]). The preservation of these geomorphic features, as well as similar deposits in Sundays River (southeast coast), and lacustrine deposits on Late Cretaceous intrusions in Namaqualand and Bushmanland [Cornelissen and Verwoerd, 1975; Moore and Verwoerd, 1985; Smith, 1986; Hanson et al., 2009; Stanley et al., 2013] suggests that regional erosion has been minimal through the Cenozoic. Cosmogenic nuclide dating has constrained the regional erosion rates to<20 m/Myr over at least the last 1 Myr [e.g., Codilean et al., 2008, 2014; Bierman et al., 2014; Decker et al., 2011; Erlanger et al., 2012; Kounov et al., 2015; Scharf et al., 2013].
2.2. Geological and Tectonic Setting
The Archean-Paleoproterozoic Transvaal Supergroup rocks form the basement of the Kaapvaal Craton within the study area [Altermann and Nelson, 1998; Eriksson et al., 2006]. They were deposited in a shallow marine environment prior to experiencing multiple deformation phases between 2500 and 1000 Ma and greenschist facies metamorphism [Kendall et al., 2013]. An array of NW-SE to N-S trending, steeply dipping, en echelon faults forming the Kheis Front define the structurally complex transition from the Kaapvaal Craton to the younger Namaqua Metamorphic Province [Altermann and Hälbich, 1991; Eriksson et al., 2006] (Figure 2). These faults initially formed during the Mesoproterozoic [Eglington, 2006] and accommodated many defor-mation events from 2 to 1 Ga [Altermann and Hälbich, 1991]. The NW structural trend that characterizes the southwest Kaapvaal Craton margin extends southwestward from southern Namibia and into South Africa, where post-Triassic displacement on brittle faults is indicated by the presence of fault-bounded basement inliers in contact with Karoo sediments [Rosendahl, 1987; Daly et al., 1989; Jelsma et al., 2009; Tankard et al., 2009] (Figure 2).
The entire Namaqua Metamorphic Province experienced significant metamorphism over ~2000 and 1000 Ma. The main phase of metamorphism of the Namaqua Metamorphic Province was largely granulite-facies metamorphism (T: 800–860°C and P: 5–6 kbar) and was completed by 1000–800 Ma [Waters, 1989; Eglington, 2006]. Lithostratigraphic variations in the Namaqua Metamorphic Province define terrane vinces and are discussed in more detail by Eglington [2006] and Cornell et al. [2006]. These terrane subpro-vinces are bounded by major shear zones and thrust belts that are evident along the Orange River that extend into southern Namibia (Figure 2).
The Hartbees River Thrust is the western most thrust fault in the study area and trends NW-SE before deviat-ing E-W and runndeviat-ing parallel to the Orange River [Colliston et al., 2015]. The generally E-W structural trend of the western section of the study area is best represented by the Tantalite Valley shear zone, Groothoek Thrust, and, further south, Buffels River shear zone. Within the Tantalite Valley shear zone, NNE-to-NE trend-ing normal structures associated with transtensional stresses juxtapose basement gneisses against late Proterozoic sediments of the overlying Nama Group [Gresse and Germs, 1993; Gresse et al., 2006]. These faults were formed and accommodated multiple deformation phases over 1.3–1.0 Ga [Eglington, 2006; Dewey et al., 2006; Colliston and Schoch, 2013].
Sedimentary units of the Permo-Triassic Karoo Supergroup were deposited over much of Southern Africa in a foreland basin north of the developing Cape Fold Belt [Catuneanu et al., 2005]. In the study area, the Karoo Supergroup unconformably overlies the basement and is represented by the Lower Permian glacially derived Dwyka Group, the Upper Permian shallow marine sandstones and siltstones
of the Ecca Group, and the Permo-Triassic fluvial sediments of the Beaufort Group (Figure 2) [Visser, 1989; Catuneanu et al., 2005; Johnson et al., 2006; Herbert and Compton, 2007; Wilson et al., 2014]. The widespread marine sediments of the Late Permian Ecca Group provide an important stratigraphic marker as they represent the last time that the continental interior of Southern Africa was unequivocally at sea level.
Intrusive dolerite dykes, sills, and sheets are ubiquitous within the Karoo Basin and commonly crop out across the study area. The intrusion of the Karoo Dolerite Suite is thought to have occurred at ~180–185 Ma [Duncan et al., 1997; Jourdan et al., 2005, 2007; Moulin et al., 2011; Svensen et al., 2012]. Mafic intrusive and extrusive rocks of similar age are found across Southern Africa and are associated with continentalflood basalt empla-cement during continental rifting and breakup continental rifting and breakup of Eastern Gondwana [Cox, 1992; Duncan et al., 1997].
Widespread, post-Karoo, emplacement of kimberlites and alkaline intrusions occurred in two main phases at 140–120 and 100–80 Ma [e.g., Smith et al., 1994; Moore et al., 2008; Jelsma et al., 2009]. The intrusions are thought to have been preferentially emplaced along tectonic boundaries, and their occurrence is linked to in-plane plate motions [Moore et al., 2008; Jelsma et al., 2009; Torsvik et al., 2010] and a changing thermoche-mical structure in the underlying mantle [Bell et al., 2003; Griffin et al., 2003; Kobussen et al., 2008]. Their pre-servation at the surface can provide important insights into the amount of erosion since emplacement [e.g., Hanson et al., 2009; Stanley et al., 2013, 2015].
The Cenozoic Kalahari Group, a sequence of poorly sorted consolidated gravel and sandfill paleovalleys, sits on the Karoo Supergroup and older basement rocks and can reach a thickness up to 210 m [Thomas and Shaw, 1990] (Figure 2). However, the timing of the development of the Kalahari Basin and subsequent sedi-ment infill remains uncertain due to the absence of direct dating of the sediments [Haddon and McCarthy, 2005].
2.3. Evidence for Discrete Post-breakup Tectonic Activity
Due to the lack of suitable stratigraphic information across the study area, constraining fault reactivation of major faults during the Late Mesozoic and Cenozoic is challenging. The majority of structures mapped at the 1:1,000,000 scale are confined to the Namaqua Metamorphic Province where they define terrane boundaries and lithological discontinuities (Figure 2). Exceptions to this are the southern extents of the Brakbos and Doringberg faults, which displace Proterozoic basement against Carboniferous-Permian Dwyka Group rocks. SW of Douglas, a fault is also mapped which displaces Archean Transvaal Supergroup rocks against Dwyka Group rocks. Post-Permian fault reactivation is therefore unrelated to terrane accretion or Pan-African Orogenic activity.
Geological evidence for Mesozoic tectonic activity in southern Namibia is found in sporadic examples of Karoo Dolerite Suite rocks with a faulted contact with Dwyka Group, Nama Group, and/or Namaqua Metamorphic Province rocks [Stollhofen et al., 1998]. Fault-dissected Karoo dolerites suggest tectonic activity less than 180 Ma old. Two phases of extension during the Cenozoic are advocated by Mvondo et al. [2011]. N-S grabens that shape the lower Fish River Canyon are ascribed to E-W extension in the late Eocene and NE-SW grabens shaping the upper Fish River Canyon due to younger NW-SE extension in the Plio-Pleistocene [Mvondo et al., 2011]. However, there are no quantitative constraints on the age of the African surface, which is used to constrain the timing of faulting. In NW Namibia, Late Mesozoic tec-tonics is constrained by the preservation of Early Cretaceous Etendeka volcanic rocks in coast-parallel half grabens [Raab et al., 2002; Brown et al., 2014; Salomon et al., 2015]. These grabens are bound by NNW-SSE trending normal faults, which displace Etendeka lavas against Namaqua Metamorphic Province base-ment [Brown et al., 2014; Salomon et al., 2015]. Further evidence is provided by syntectonic conglomerate units composed of Etendeka volcanic material that dip to the east into a westerly dipping normal fault [Ward and Martin, 1987].
These NW Namibian examples indicate that localized faulting has occurred onshore after 130 Ma. However, as with the previously described examples, no well-dated younger stratigraphic constraints are available. We have shown previously, using combined AFT and AHe analysis, that post-breakup tec-tonic reactivation of brittle faults occurred during the middle-to-Late Cretaceous well inland along the Namaqualand sector of Atlantic margin in South Africa [Wildman et al., 2015, 2016]. These studies lend
further support to earlier thermochronology [Gallagher and Brown, 1997; Kounov et al., 2009] and struc-tural investigations [Viola et al., 2012] that advocate significant post-rift tectonic activity in the Namaqualand region. Seismic activity indicates that the tectonic boundary between the Kaapvaal Craton and Namaqua Metamorphic Province mobile belt remains active [Tankard et al., 2009]. Post-rift tectonic activity is well documented for the offshore margin. Seismic reflection data from the Orange, Luderitz, and Walvis Basins, adjacent to the South African and Namibian continental margins, clearly indicate regional deformation in the Upper Cretaceous sequences and segmentation of the margin by faults, which can be traced onshore [Dingle et al., 1983; Clemson et al., 1997; Viola et al., 2005; de Vera et al., 2010].
3. Apatite Fission Track and (U-Th-Sm)/He Analysis
In apatite, annealing of damage trails from the spontaneousfission of U and retention of He from the alpha decay of U, Th, and Sm as the crystal cools through temperatures of 120 to 40°C in the upper crust enable apatitefission track and apatite (U-Th-Sm)/He analysis to constrain denudation-driven exhumation over mil-lion year timescales [Lisker et al., 2009].
Spontaneousfission tracks form in apatite with an initial etchable length of ~16 ± 1 μm [Green et al., 1986]. Fission tracks anneal primarily as a function of temperature such that, at temperatures hotter than 110 ± 10°C, tracks are entirely annealed and temperatures cooler than 60°C track annealing is minimal [Green et al., 1985]. The intervening temperature range is termed as the partial annealing zone where annealing rate is inversely proportional to temperature [Gleadow and Fitzgerald, 1987]. Apatite composition (particularly F, Cl, and OH substitution) can also influence the annealing rate of tracks [Carlson et al., 1999]. By measuring the spontaneous track density of238U in a sample relative to the induced track density of235U in a mica exter-nal detector, afission track age can be obtained. Age data can be combined with length measurements of
Table 1. Results of Apatite Fission Track Analysis
Sample Long. (°) Lat. (°) Elev. (m) ρsa(106cm 2) Nsb ρia(106cm 2) Nib ρda(106cm 2) Ndb P(χ2)c(%) Dpard(μm) [U]e(ppm)
FS1605 22.20 29.22 843 5.7 400 12.1 845 16.5 13,142 99.5 2.07 10.1 GGO2 20.30 28.36 846 21.3 2174 68.8 7023 20.0 13,142 0.2 1.75 48.5 PRU 106 19.52 28.48 783 19.2 1092 82.3 4672 21.7 13,142 5.7 1.76 51.5 S-25 26.08 29.52 1450 1.0 911 1.4 1239 1.0 4441 19.4 26.0 SA12-05 23.70 29.15 1007 4.3 249 13.5 777 16.7 16,348 45.6 2.02 11.9 SA12-06b 23.14 29.54 1068 7.4 537 18.7 1362 15.6 16,348 3.5 1.97 16.1 SA12-08 22.31 29.52 1039 1.9 195 4.4 465 15.5 16,348 99.7 1.53 3.9 SA12-09 22.12 29.40 995 5.8 535 12.4 1150 15.4 16,348 94.0 2.44 11.3 SA12-10 21.94 29.36 1075 4.0 151 12.0 449 16.6 16,438 22.1 1.77 9.2 SA12-11 21.94 29.24 1057 2.2 122 9.4 526 16.1 16,348 62.7 4.96 7.7 SA12-12 21.63 29.30 981 10.3 930 29.1 2631 15.2 16,348 12.7 2.38 25.1 SA12-13a 21.47 29.28 962 9.1 787 25.3 2190 15.1 16,348 7.8 2.44 22.3 SA12-14 21.15 29.35 797 6.2 1013 15.5 2553 14.9 16,348 0.0 2.87 13.9 SA12-15 20.98 29.42 884 5.7 305 23.1 1237 16.6 16,348 50.2 1.69 19.5 SA12-19b 19.53 29.34 1034 7.7 994 16.9 2183 13.8 16,086 9.9 1.63 17.2 SR-17 25.25 27.13 1300 2.2 2637 1.2 1553 1.1 5540 38.7 14.9 V-10 26.42 26.63 1400 0.4 1300 0.4 655 1.2 5540 9.7 4.8 aρ
i,s,dare track density of induced, spontaneous, dosimeter tracks.
b
Ni,s,dare the number of induced, spontaneous, and dosimeter tracks counted.
cP value of the chi-square age homogeneity test [Galbraith, 2010].
d
Dparmeasurements are etch pit diameters used as a proxy for the influence of chemical composition on track annealing [Donelick et al., 2005]. Between three
andfive Dparmeasurements were measured for each dated single grain.
e
Uranium content estimated by using EDM.
fCentral AFT ages calculated with TrackKey [Dunkl, 2002] with 1σ standard error. Ages were calculated by using a ζ = 316.7 ± 10.5 (317.3 ± 11.1 for samples
PRU106, FS1605, and GGO2) for a standard IRMM540 glass.
gDispersion is the standard deviation of the true single-grain ages as a percentage of their central age [Galbraith, 2010].
h
SD is the standard deviation of measured horizontal confined track lengths.
iMean track lengths after individual track length measurements are corrected for their orientation to the c axis after Ketcham [2005].
j
horizontal tracks beneath the polished surface to reveal information on both the timing and rate of sample cooling [Gallagher et al., 1998].
Defining a nominal closure temperature for the apatite (U-Th-Sm)/He dating system has proven to be chal-lenging [Fitzgerald et al., 2006]. Depending on the size of the apatite crystal (i.e., the diffusion domain) and the amount of accumulated radiation damage, the temperature range between total retention of helium and complete diffusive loss of helium can vary from 40 to 120°C [Gautheron et al., 2013]. Depending on the cooling history through this partial retention zone, variations in closure temperature can result in intra-sample single-grain AHe ages being significantly dispersed [Brown et al., 2013]. To understand the controls on AHe age dispersion and the information this can yield on the thermal history of the sample, multiple single-grain aliquots are typically measured.
3.1. Apatite Fission Track Analysis
The external detector method [e.g., Hurford and Green, 1982; Green et al., 1989; Donelick et al., 2005] (Text S1 in the supporting information) was used to obtain AFT data from 17 samples collected across the Southwest Africa plateau (Table 1). The main transect extends west from Douglas to Pofadder cutting across and beyond the major NW-SE trending structures (e.g., Doringberg and Hartbees thrust faults). Central AFT ages range from 58.9 ± 5.9 to 379.0 ± 23.0 Ma with more than half of the sample ages being Late Cretaceous (i.e., 110–70 Ma). Mean track lengths (MTLs) within samples range from 10.33 ± 0.24 to 14.29 ± 0.12μm with the standard deviation of track length measurements ranging from 1.17 to 2.19 (see Figure S2 for TLDs).
The 17 samples analyzed across the study area provided a good number of grains suitable for AFT dating (n> 17 for 15 samples), each with moderate-to-high track density. Radial plots for all 17 samples can be found in Figure S3 and highlight the dispersion on single-grain ages. Three samples (GGO2, SA12-06, and SA12-14) fail the chi-square homogeneity test (i.e., P(χ2)< 0.05); however, single-grain age dispersion for these samples is ≤20% and is therefore not considered to be significantly overdis-persed. To robustly interpret the significance of the AFT age in terms of the samples’ thermal history, the track length distribution, compositional kinetic parameters for the sample must also be taken into account.
The relationship between AFT ages and MTLs plotted in Figure 3 clearly shows that Cretaceous ages are associated with relatively long mean track lengths (i.e., > 13 μm) and older ages (>300 Ma) associated with shorter MTLs. Although relatively few data points record old AFT ages, the data set implies that
Table 1. (continued)
Sample C. AFT Age (Ma)f ±1σ Disp.g(%) #Xtls
Measured c Axis Correctioni
#HCTj MTL (μm) ±1σ SDh MTL (μm) ±1σ SDh FS1605 122.8 7.5 0 20 12.87 0.25 2.00 14.38 0.28 1.35 63 GGO2 96.6 3.6 12 20 12.89 0.15 1.55 13.98 0.16 1.12 100 PRU 106 78.1 3.4 14 19 10.33 0.24 2.19 12.83 0.30 1.17 80 S-25 128.7 6.3 8 20 13.32 0.25 1.98 64 SA12-05 83.9 6.7 13 20 13.37 0.51 2.10 14.59 0.56 1.44 17 SA12-06b 97.7 6.5 18 18 13.43 0.12 1.26 14.65 0.13 0.85 51 SA12-08 102.1 8.7 0 20 13.32 0.30 1.85 14.68 0.33 0.96 39 SA12-09 112.5 5.9 0 22 13.98 0.19 1.44 15.03 0.20 0.92 57 SA12-10 89.0 10.0 21 12 13.98 0.54 1.61 15.03 0.58 1.09 9 SA12-11 58.9 5.9 0 16 13.25 0.47 1.83 14.29 0.51 1.23 15 SA12-12 85.4 3.8 10 22 13.84 0.14 1.23 14.86 0.15 0.91 78 SA12-13a 85.7 4.4 12 20 14.29 0.12 1.17 15.23 0.13 0.77 89 SA12-14 93.4 5.5 20 20 13.28 0.19 1.33 14.52 0.21 0.94 81 SA12-15 64.5 4.1 0 22 13.52 0.34 1.38 14.39 0.36 1.03 17 SA12-19b 97.0 4.6 12 21 13.55 0.15 1.38 14.74 0.16 0.89 126 SR-17 331.0 11 2 20 11.92 0.19 1.91 100 V-10 379.0 23 14 20 12.48 0.25 1.55 39
Paleozoic thermal history informa-tion has been preserved by some samples but in most cases has been entirely erased by annealing at high paleotemperatures prior to cooling in the Mesozoic.
AFT age-MTL relationships may also be influenced by variations in track annealing caused by differences in apatite composition [Kohn et al., 2009]. Dpar measurements were
made for each sample as a proxy for the compositional influence on track annealing and range from 1.53 ± 0.2 to 4.96 ± 0.7μm. Anisotropic anneal-ing and etching of tracks are addressed by measuring the angle that horizontal track lengths make with the c axis of the analyzed grain. The influence these effects have on the fission track age and length data is taken into account during thermal history modeling (see section 4). Track length distributions are typically symmetrical or, in rare cases, negatively skewed. The major-ity of mean track length standard deviation values are less than 2, which is indicative of most samples having fairly narrow to moderately broad track length distributions.
3.2. Apatite (U-Th-Sm)/He Analysis
Twelve samples were dated by using single-grain apatite (U-Th-Sm)/He analysis (Table 2). The analytical details can be found in Text S1. The number of single grains analyzed for each sample ranges from 2 to 18. The interaction between alpha ejection, radiation damage effects, and He diffusion remains poorly understood, and depending on the thermal history, which is not known from the outset, a single Ft cor-rection factor may overcorrect AHe ages that have lost He predominantly through diffusion [Farley et al., 1996; Meesters and Dunai, 2002a, 2002b; Herman et al., 2007; Spiegel et al., 2009; Gautheron et al., 2012; Wildman et al., 2015]. For this reason, we have chosen to quote raw uncorrected, AHe ages and deal with the effect of alpha ejection during each time step of the thermal history inversion modeling approach [e.g., Meesters and Dunai, 2002a, 2002b]. AHe ages corrected by using an Ft correction factor
[Farley et al., 1996] are given in Table 2. Mean uncorrected AHe ages for Dwyka Group and Paleozoic samples range from 25.5 ± 14.6 to 173.7 ± 95.9 Ma. The oldest single-grain age of 333.2 ± 37.7 Ma is obtained from sample FS1605, while the youngest of 16.6 ± 1.8 Ma is from SA12-11. The two Archean craton samples V-10 and SR-17 have mean AHe ages of 331.0 ± 112.8 and 319.0 ± 128.2, respectively. The intrasample grain age dispersion associated with these samples is large ranging between 19% and 55%.
AHe ages are subject to variation due to the thermal history the sample has experienced. However, the eU content (as a proxy for radiation damage), grain size, and crystal fragmentation act to compound and enhance single-grain AHe age dispersion [Reiners and Farley, 2001; Fitzgerald et al., 2006; Flowers et al., 2009; Gautheron et al., 2009; Brown et al., 2013]. Simple 2-D correlations between these properties and single-grain AHe age have been advocated as a means to qualitatively infer thermal history information [Reiners and Farley, 2001; Fitzgerald et al., 2006; Flowers et al., 2009; Gautheron et al., 2009]; however, the com-bined effects of these dispersion inducing factors can disrupt expected 2-D relationships (Figure 4c) [Brown et al., 2013; Beucher et al., 2013; Wildman et al., 2016]. Our data do not show any strong positive age-grain size or age-eU relationships, which can be attributed to the combined effects of eU, grain radius, and potentially other unknown factors that are contributing to single-grain AHe age dispersion and disrupting simple corre-lations (Figures 4a and 4b; see Figure S4 for additional plots). Despite samples exhibiting overdispersed AHe ages, all mean AHe ages are within 1σ error of their corresponding central AFT age (Figure 4d). Neither AFT nor AHe sample ages can be simply interpreted at face value, so it is necessary to utilize an appropriate ther-mal history inversion approach that will account for both the observed data, their associated uncertainties,
Figure 3. Plot of AFT age against mean track length. AFT ages are Central
AFT ages with 1σ standard error. MTLs are corrected for their c axis
Table 2. Resul ts of Apa tite (U-Th -Sm)/ He An alysis Sample Grain No. 4 He (cc) 238 U 235 U 232 Th 147 Sm eU a (ppm) T b L c (μm) W c (μ m) R * d (μ m) Ft e Raw Age ±Est. UC f Cor. Age g ±Est. UC f Raw Age (Ma) Cor. Age (Ma ) (ng) (ppm) (ng) (ppm) (ng) (ppm) (ng) (ppm) (Ma) (Ma) Average SD Average SD SA12-05 1 1.4E 10 0.02 2.69 1.2E 04 0.02 0.02 3.9 0.02 3.1 3.6 1 173.5 120.9 67 .2 0.78 48 .6 29.5 62.5 37.9 69.1 18.2 90.0 24.7 2 6.5E 10 0.06 11.35 4.5E 04 0.08 0.03 6.2 0.02 3.5 12.9 1 175.0 112.1 63 .7 0.77 75 .0 19.3 97.1 24.9 5 3.6E 10 0.01 2.44 1.0E 04 0.02 0.09 15 .5 6.1 0 159.8 120.3 65 .5 0.76 83 .6 9.1 110.3 12.0 SA12-06B 3 8.9E 10 0.05 8.8 3.6E 04 0.06 0.03 5.4 0.02 3.5 10.1 2 232.8 98.2 60 .8 0.76 128.0 15.1 168.2 19.9 93.1 20.4 122.0 26.5 7 7.9E 10 0.06 10.4 4.1E 04 0.08 0.05 8.4 0.03 5.8 12.5 2 174.4 111.3 63 .3 0.77 95 .0 10.6 123.6 13.8 8 1.1E 09 0.07 16.6 5.2E 04 0.12 0.05 12 .3 19.6 1 145.0 108.7 59 .3 0.75 110.7 15.0 146.9 19.9 9 6.9E 10 0.05 7.3 3.7E 04 0.05 0.05 7.3 9.1 1 151.8 135.2 70 .2 0.79 88 .9 12.0 112.6 15.2 11 1.1E 09 0.07 8.5 4.8E 04 0.06 0.06 7.8 0.04 4.7 10.4 2 264.1 108.1 67 .3 0.78 108.1 11.9 138.3 15.2 12 5.3E 10 0.05 7.5 3.5E 04 0.05 0.04 6.5 9.1 1 231.4 105.2 64 .3 0.77 74 .2 10.1 96.2 13.0 13 3.8E 10 0.03 5.9 2.5E 04 0.04 0.07 12 .4 8.9 2 263.3 94.4 60 .1 0.75 60 .2 6.5 80.6 8.7 14 5.3E 10 0.04 8.9 3.0E 04 0.06 0.04 9.6 11.2 2 204.9 95.1 57 .9 0.74 82 .6 8.9 110.9 12.0 15 1.4E 09 0.11 23.1 7.7E 04 0.17 0.07 16 .1 27.1 1 200.7 95.3 57 .8 0.75 90 .0 12.2 120.5 16.4 SA12-08 1 3.6E 10 0.05 18.3 3.7E 04 0.13 0.11 41 .0 0.19 69.1 41 .00 1 198.1 74.5 47 .0 0.68 37 .9 5.2 52.3 7.2 71.3 30.0 94.6 44.2 2 1.7E 10 0.01 4.9 8.8E 05 0.04 0.03 11 .2 0.07 29.7 11 .22 0 9 7 .6 100.5 49 .7 0.69 71 .7 10.3 94.8 13.7 3 2.2E 10 0.01 2.3 7.8E 05 0.02 0.02 5.0 0.05 10.5 5.03 1 183.1 101.6 59 .7 0.75 109.3 15.3 146.6 20.5 4 1.2E 09 0.08 31.4 5.9E 04 0.23 0.04 14 .7 0.17 66.3 14 .76 2 158.8 80.3 48 .1 0.70 104.6 14.6 149.6 20.9 5a 2.0E 10 0.02 2.6 1.8E 04 0.02 0.05 4.9 4.91 1 195.1 139.1 60 .7 0.80 45 .4 4.9 54.0 5.8 5b 2.0E 10 0.02 4.3 1.4E 04 0.03 0.03 7.1 6.0 1 9 9 .5 136.4 60 .7 0.75 59 .0 6.4 70.2 7.6 SA12-09 1 4.3E 10 0.02 5.9 4.3E 02 0.04 0.01 3.8 0.64 211.1 6.9 1 137.6 93.9 52 .5 0.72 164.1 38.2 232.6 54.2 98.6 52.1 143.9 68.9 2 6.9E 10 0.03 7.8 5.7E 02 0.06 0.04 12 .6 0.40 114.0 10.8 2 164.0 92.8 54 .2 0.72 145.2 16.1 202.4 22.4 3 1.6E 10 0.01 6.8 4.9E 02 0.05 0.05 25 .2 0.62 321.2 12.7 1 169.5 67.5 42 .2 0.63 51 .4 5.7 82.9 9.3 4 8.2E 11 0.01 2.1 1.5E 02 0.01 0.02 6.2 3.5 2 192.7 80.9 50 .2 0.67 60 .1 6.7 89.2 10.0 5 1.1E 10 0.01 5.6 4.1E 02 0.04 0.01 7.1 7.4 1 144.3 68.8 41 .7 0.64 72 .1 10.8 112.1 16.8 SA12-11 1 2.1E 10 0.01 2.2 7.7E 05 0.02 0.07 13 .6 0.23 46.1 5.4 0 204.2 97.6 59 .1 0.73 60 .6 6.8 82.9 9.3 36.6 14.6 50.3 20.7 2 1.0E 10 0.01 4.9 9.0E 05 0.04 0.06 24 .8 0.12 48.7 10.8 0 115.2 93.2 49 .8 0.68 30 .7 3.5 44.9 5.0 3 9.4E 11 0.01 2.2 5.2E 05 0.02 0.05 15 .0 0.13 40.1 5.8 0 115.6 105.1 54 .2 0.71 39 .2 4.4 55.4 6.2 4 2.1E 10 0.02 5.2 1.8E 04 0.04 0.13 28 .1 0.24 51.0 11.8 0 155.7 109.7 60 .8 0.74 29 .8 3.2 40.1 4.4 5 3.5E 10 0.04 3.1 3.0E 04 0.02 0.34 25 .6 0.65 48.9 9.2 1 202.6 161.9 86 .7 0.82 22 .9 2.5 28.0 3.1 SA12-13A 2 1.2E 09 0.18 13.7 1.3E 03 0.10 0.01 0.9 0.24 17.8 14.0 2 250.6 145.4 84 .5 0.83 51 .8 8.1 62.2 9.8 76.7 18.4 98.4 23.8 4 1.4E 09 0.11 19.6 8.2E 04 0.14 0.13 22 .0 24.9 2 238.7 98.3 61 .1 0.76 77 .2 10.4 101.8 13.8 5 1.0E 09 0.12 27.5 8.8E 04 0.20 0.22 48 .9 39.2 1 169.0 101.9 58 .7 0.74 48 .0 5.2 64.6 6.9 8 1.4E 09 0.12 18.1 8.4E 04 0.13 0.12 18 .3 22.6 2 281.6 95.1 61 .0 0.76 81 .2 11.0 107.1 14.5 9 1.6E 09 0.11 12.8 8.2E 04 0.09 0.15 16 .7 0.13 14.4 16.8 2 316.1 105.6 67 .9 0.78 89 .6 9.7 114.8 12.5 10 1.2E 09 0.09 18.0 6.5E 04 0.13 0.08 16 .6 22.1 1 218.3 94.8 58 .4 0.75 89 .4 9.6 119.4 12.8 11 8.2E 10 0.07 16.9 5.2E 04 0.12 0.07 17 .7 0.07 15.9 21.2 2 200.4 91.6 55 .9 0.74 74 .5 8.4 101.2 11.4 12 2.0E 09 0.17 17.0 1.2E 03 0.12 0.03 3.1 0.14 13.8 17.8 1 193.3 144.4 78 .8 0.82 89 .4 12.0 109.1 14.7 14 3.9E 09 0.27 36.2 2.0E 03 0.26 0.14 18 .5 0.18 24.4 40.8 1 203.8 121.0 70 .0 0.79 104.2 11.1 131.4 14.0 15 1.0E 09 0.09 19.8 6.3E 04 0.14 0.08 19 .3 24.5 2 182.5 97.6 57 .7 0.74 79 .2 10.7 106.3 14.4 16 1.7E 09 0.18 21.6 1.3E 03 0.16 0.16 19 .3 26.3 1 220.2 124.4 72 .7 0.80 60 .9 8.2 76.3 10.3 17 6.1E 10 0.12 13.1 8.9E 04 0.09 0.01 1.0 13.4 1 187.0 141.1 76 .8 0.82 40 .4 5.9 49.6 7.3 20 3.2E 09 0.22 18.4 1.6E 03 0.13 0.26 22 .3 0.22 18.5 23.8 2 311.3 122.9 77 .0 0.81 93 .7 10.1 116.1 12.5 21 1.7E 09 0.16 13.2 1.1E 03 0.10 0.05 4.0 0.15 12.5 14.2 1 304.3 124.4 77 .5 0.81 83 .3 9.1 102.2 11.1 24 8.1E 10 0.06 8.8 4.4E 04 0.06 0.06 8.6 0.08 11.5 10.9 2 220.8 111.5 66 .8 0.78 88 .4 10.1 113.4 12.9 SA12-14 2 2.0E 09 0.18 17.8 1.3E 03 0.13 0.13 12 .8 20.9 1 224.9 133.6 77 .2 0.81 77 .9 8.4 96.0 10.3 83.7 13.2 101.0 16.1 3 4.0E 09 0.36 8.9 2.6E 03 0.06 0.11 2.8 0.73 18.3 9.7 1 260.3 247.4 125.8 0.89 84 .7 9.1 95.6 10.3 6 3.1E 09 0.23 16.7 1.7E 03 0.12 0.14 10 .3 0.40 28.5 19.2 2 357.3 124.4 79 .5 0.82 94 .4 10.3 115.6 12.6 7 2.0E 09 0.19 12.6 1.4E 03 0.09 0.13 8.8 0.26 17.4 14.8 2 224.1 163.8 90 .0 0.84 74 .4 8.1 88.8 9.6 8 2.4E 09 0.18 11.7 1.3E 03 0.08 0.08 5.5 0.23 15.0 13.1 1 254.7 154.3 88 .8 0.84 99 .3 10.6 118.6 12.7 18 2.7E 09 0.23 14.2 1.7E 03 0.10 0.14 8.9 0.45 28.1 16.4 2 271.1 153.2 89 .6 0.84 81 .7 8.9 97.6 10.6 19 1.5E 09 0.11 11.3 8.1E 04 0.08 0.21 21 .0 0.27 27.6 16.4 2 214.8 135.2 77 .1 0.80 74 .3 7.9 92.4 9.9 21 8.8E 10 0.11 9.8 8.2E 04 0.07 0.07 5.8 0.21 18.0 11.3 2 282.8 126.8 77 .7 0.81 55 .4 6.0 68.1 7.3 22 6.2E 10 0.04 4.4 3.0E 04 0.03 0.03 2.7 5.0 2 179.1 146.0 77 .8 0.81 105.2 14.3 129.4 17.6 23 3.3E 09 0.27 20.2 1.9E 03 0.15 0.16 12 .3 23.2 1 270.4 139.2 83 .0 0.82 87 .5 11.9 106.0 14.5 26 5.1E 10 0.05 5.2 3.7E 04 0.04 0.03 2.6 5.9 2 245.3 125.8 75 .1 0.81 73 .1 10.0 90.6 12.4 30 3.4E 09 0.33 12.8 2.4E 03 0.09 0.11 4.0 13.8 2 301.6 185.2 106.3 0.86 78 .6 11.0 90.8 12.7 34 6.3E 09 0.45 36.8 3.3E 03 0.27 0.25 20 .0 41.8 2 218.6 149.7 83 .6 0.83 100.8 13.8 121.9 16.7
Table 2. (continued) Sample Grain No. 4 He (cc) 238 U 235 U 232 Th 147 Sm eU a (ppm) T b L c (μm) W c (μ m) R * d (μ m) Ft e Raw Age ±Est. UC f Cor. Age g ±Est. UC f Raw Age (Ma) Cor. Age (Ma ) (ng) (ppm) (ng) (ppm) (ng) (ppm) (ng) (ppm) (Ma) (Ma) Average SD Average SD 37 1.5E 09 0.13 11.1 9.6E 04 0.08 0.06 4.9 12.3 2 228.2 143.8 82 .0 0.82 84 .0 11.6 102.0 14.1 SA12-15 1 1.7E 09 0.07 6.5 5.0E 04 0.05 0.19 18 .3 10.9 1 165.6 159.8 47 .0 0.81 123.6 17.2 152.6 21.2 74.7 69.3 93.3 83.8 2 3.8E 09 1.07 176.0 7.7E 03 1.28 0.61 100.5 20 0.9 0 290.7 91.1 49 .7 0.75 25 .7 3.5 34.0 4.7 SA12-19B 1 2.4E 09 0.17 12.4 1.2E 03 0.09 0.06 4.0 13.4 2 295.9 136.6 83 .2 0.83 104.8 12.4 126.7 15.0 106.3 23.5 133.7 26.3 3 1.9E 09 0.10 8.5 7.1E 04 0.06 0.03 2.7 9.2 2 237.4 139.2 80 .7 0.82 144.7 19.2 176.0 23.3 4 9.4E 10 0.09 20.1 6.2E 04 0.15 0.04 8.7 22.3 2 156.3 104.3 58 .7 0.75 81 .2 10.1 107.7 13.5 5 2.0E 09 0.17 19.3 1.2E 03 0.14 0.04 4.2 20.4 1 214.7 126.0 73 .1 0.80 95 .6 12.4 118.8 15.4 6 3.0E 09 0.22 49.5 1.6E 03 0.36 0.06 14 .3 53.2 2 171.7 101.5 58 .8 0.76 105.4 12.4 139.4 16.5 GGO2 5 1.2E 08 0.77 101.0 5.6E 03 0.73 0.70 91 .4 12 3.2 1 149.9 142.6 72 .5 0.80 101.7 11.2 127.6 14.0 87.8 16.8 111.2 22.2 8 2.3E 08 1.52 323.4 1.1E 02 2.35 1.30 273.0 38 9.9 1 190.9 99.5 59 .2 0.75 102.4 11.2 136.1 15.0 11 2.2E 08 1.30 236.4 9.4E 03 1.71 2.69 487.0 35 2.6 2 182.8 109.7 63 .3 0.76 91 .7 10.2 120.5 13.5 12 2.2E 08 1.36 161.8 9.8E 03 1.17 0.08 9.5 16 5.2 2 264.5 112.7 69 .7 0.80 128.2 14.3 160.9 18.0 14 7.7E 09 0.94 183.3 6.8E 03 1.33 0.11 21 .0 18 9.6 1 170.5 110.0 62 .4 0.77 65 .3 7.3 84.6 9.4 16 2.9E 08 3.08 268.6 2.2E 02 1.95 2.75 238.1 32 6.5 1 255.5 134.1 79 .7 0.82 64 .1 7.0 78.6 8.6 17 1.5E 08 1.23 199.3 8.9E 03 1.45 0.26 41 .0 21 0.4 1 141.0 132.5 67 .6 0.79 95 .3 10.5 120.9 13.3 19 2.9E 08 3.19 319.5 2.3E 02 2.32 4.58 455.2 42 8.8 1 238.3 129.6 76 .4 0.80 56 .2 6.2 69.8 7.7 20 2.9E 08 2.88 169.6 2.1E 02 1.23 1.47 85 .9 19 1.0 2 316.4 146.8 89 .4 0.84 73 .9 8.1 88.2 9.7 21 1.1E 08 0.69 110.0 5.0E 03 0.80 0.70 110.6 13 6.7 1 124.3 142.3 67 .9 0.78 103.9 11.4 132.8 14.6 22 2.9E 08 2.58 235.4 1.9E 02 1.71 0.91 82 .4 25 6.4 1 234.5 136.9 79 .5 0.82 85 .3 9.4 104.2 11.4 23 1.9E 08 1.43 244.5 1.0E 02 1.77 2.20 373.5 33 4.0 1 109.8 146.0 65 .8 0.77 78 .6 8.7 101.7 11.3 25 1.3E 08 1.02 134.9 7.4E 03 0.98 0.78 102.3 15 9.9 1 156.4 139.2 72 .2 0.80 86 .8 9.5 108.9 11.9 26 2.9E 08 2.28 264.0 1.7E 02 1.91 2.12 243.5 32 3.2 1 204.9 129.9 74 .0 0.80 85 .0 9.4 106.1 11.7 27 3.4E 09 0.20 28.8 1.4E 03 0.21 0.57 81 .8 48.2 1 139.7 140.4 70 .1 0.78 84 .2 9.5 107.9 12.1 28 2.3E 08 1.54 234.7 1.1E 02 1.70 2.03 307.9 30 8.7 1 157.7 129.1 68 .7 0.78 92 .0 10.2 117.5 13.0 29 8.9E 09 0.73 77.9 5.3E 03 0.57 0.25 26 .0 84.6 1 201.3 136.9 76 .6 0.81 91 .9 10.1 113.1 12.4 30 1.7E 08 1.14 213.3 8.3E 03 1.55 1.24 230.0 26 8.9 1 127.4 129.7 64 .5 0.77 94 .6 10.4 122.8 13.5 FS1605 1 1.7E 09 0.03 4.3 2.0E 04 0.03 0.05 8.0 6.2 1 143.6 134.2 68 .6 0.78 333.2 37.7 427.1 48.3 173.7 95.9 221.8 120.9 2 4.7E 10 0.05 5.1 3.3E 04 0.04 0.04 4.3 6.2 2 238.3 121.7 72 .7 0.80 70 .8 7.9 88.7 9.8 3 2.9E 09 0.08 9.4 5.6E 04 0.07 0.07 8.2 11.4 2 202.0 128.3 73 .0 0.80 248.7 27.4 311.2 34.3 5 1.3E 09 0.06 9.4 4.3E 04 0.07 0.02 3.0 10.1 1 142.5 133.5 68 .2 0.79 171.1 22.1 216.7 28.1 7 7.7E 10 0.03 4.9 2.3E 04 0.04 0.01 1.2 5.2 1 170.6 122.0 67 .4 0.79 188.6 45.7 239.4 58.1 9 5.1E 10 0.03 4.7 1.9E 04 0.03 0.02 3.2 5.5 0 132.5 128.1 64 .8 0.77 139.9 17.8 180.5 23.0 10 2.0E 10 0.02 6.0 1.4E 04 0.04 0.03 7.9 7.8 0 167.2 89.2 52 .8 0.72 63 .7 7.3 88.7 10.1 PRU106 4 9.8E 09 0.74 62.0 3.3E 01 0.45 0.33 27 .7 68.9 1 153.6 176.3 84 .0 0.83 97 .7 10.7 117.9 12.9 89.7 11.2 111.5 9.1 5 4.2E 09 0.33 49.1 3.9E 01 0.36 0.39 57 .6 63.0 1 205.2 114.1 67 .0 0.78 81 .8 9.0 105.0 11.6 V-10 1 7.3E 10 0.02 2.1 1.4E 04 0.02 0.04 4.4 1.4 153.3 3.1 1 233.4 124.6 73 .8 0.77 286.8 51.7 371.5 60.2 331.0 112.8 416.1 142.0 2 1.4E 09 0.02 2.2 1.6E 04 0.02 0.05 5.2 0.5 49.8 3.4 0 192.7 146.6 79 .7 0.80 302.5 53.7 378.1 61.2 3 4.8E 10 0.01 1.5 9.8E 05 0.01 0.03 3.8 0.8 90.4 2.4 0 172.4 145.4 76 .7 0.79 169.1 30.1 213.6 34.6 4 1.6E 09 0.03 3.2 1.9E 04 0.02 0.04 5 1.4 161.9 4.4 0 173.6 139.2 74 .5 0.79 324.1 57.8 410.4 66.4 5 9.9E 10 0.01 1.1 6.6E 05 0.01 0.02 2.7 1.7 207.1 1.7 0 165.6 141.6 74 .4 0.79 482.6 86.4 614.4 99.5 6 7.2E 10 0.01 1.2 1.0E 04 0.01 0.03 2.9 1.0 80.2 1.9 0 246.7 138.8 81 .2 0.80 245.6 43.5 305.5 49.5 7 2.8E 09 0.03 2.6 2.0E 04 0.02 0.06 5.5 1.5 137.4 3.9 0 217.8 140.6 79 .7 0.80 503.3 89.3 628.4 10 1.8 8 1.1E 09 0.02 1.1 1.2E 04 0.01 0.03 2.2 1.1 73.2 1.6 0 260.8 153 88 .7 0.82 334.0 58.6 406.6 65.9 SR-17 1 2.1E 09 0.08 1.4 0.00062 0.01 0.03 1.6 3.605 0.7 1.77 6 0 166.4 71.4 44 .1 0.65 447.9 87.6 690.0 11 1.8 319.0 128.2 426.8 209.4 2 1.2E 08 0.22 15.6 0.00161 0.113 0.06 7 9.197 223.1 17.245 0 244.5 144.8 83 .8 0.82 405.0 71.0 492.7 79.8 3 2.1E 09 0.12 6.7 0.00086 0.049 0.05 2.3 5.329 155.1 7.2405 0 219.4 130 75 .2 0.8 245.2 43.4 305.2 49.4 4 5.9E 09 0.12 17.7 0.00089 0.128 0.16 12 .3 3.448 272 20.591 0 286.4 132.9 80 .9 0.81 178.0 31.4 219.1 35.5 a eU (effecti ve uraniu m) is calculated as eU ppm =[ Uppm ] + (0.235 * [Th ppm ]). b T = numb er of term ination s iden tifi ed on cryst al. c L and W = length and wi dth of cryst al or cryst al fragme nt. d R * = spher ical equival ent radiu s calculated as R *=( 3 * (RL ))/(2 * (R + L)), whe re R = W /2. e Co rrection factor after Farley et al. [1996] , assum ing homo geneous dist ribut ion U and Th. f Estim ated unce rtainty is equal to 1σ analyt ical unce rtai nty, whi ch include s error pro pagat ed from U ,Th, S m ,and H e measu reme nt unce rtaintie s, plus an add itiona l 10% whi ch is the standa rd deviat ion (reproducibi lity) of the repe at ana lysis of Du rango apatite sta ndards. g Corrected AH e age = Raw AHe age /Ft . The sample s w e re ana lyzed at Scottish U niversi ties Envir onmen tal Resear ch Centre, Un iversity Co llege Londo n, and Univer sity of Mel bourne ; ana ly tica l details can be fou nd in Text S1. De tails on sample litholog y can be fou nd in Table S7.
Figure 4. (a) AHe single-grain age against apatite grain spherical equivalent radius (R*); (b) AHe single-grain age against effective uranium (eU = [U] + 0.235 * [Th]).
The number inside each individual point indicates the number of grain terminations. Each AHe age is plotted with an error bar = analytical uncertainty (typically 1%–
3%) + 10% (derived from the standard deviation of Durango apatite standard analyses). (c) Diagram highlighting how different contributors to AHe single-grain age dispersion perturb simple 2-D relationships [Brown et al., 2013]. Age increases with increasing eU and R*. Larger fragment lengths of broken crystals are typically older than small fragment lengths; (d) plot of mean AFT age versus mean AHe age. Additional plots of single-grain age versus eU and R* are given in Figure S4.
and the uncertainties on the model parameterization itself. This is particularly important when integrating complex AFT and AHe data [Wildman et al., 2016].
4. Thermal History Inversion
The ultimate goal of thermochronology is to extract thermal history information and interpret this within a geological framework. Due to the complex nature of the combined AFT and AHe data sets, an appropriate inversion approach is required to extract the most probable thermal history for the observed data and the uncertainty on that data. A Bayesian approach to inverse thermal history modeling was performed by using the reversible jump Markov chain Monte Carlo (MCMC) method described by Gallagher [2012] and the soft-ware QTQt. The theoretical basis and application of this modeling technique has been well documented and discussed in previous studies [Gallagher et al., 2009; Gallagher, 2012; Cogné et al., 2011, 2012; Vermeesch and Tian, 2014; Guillaume et al., 2013; Wildman et al., 2015, 2016; Leprêtre et al., 2015]. The MCMC algorithm was run for a minimum of ~200,000 iterations after discarding an initial ~50,000“burn in” runs [Gallagher et al., 2009; Gallagher, 2012]. However, in most cases, the number of runs far exceeds this as several short; ~10,000 iteration runs are performed in order to optimize the MCMC search parameters before performing longer runs.
For this study, the multikineticfission track annealing model of Ketcham et al. [2007] was used and the com-positional influence on fission track annealing, predominantly due to the relative proportions of Cl and F [Carlson et al., 1999; Sobel and Seward, 2010], was constrained by using a sample average Dparvalue. Three
samples do not have Dparinformation as AFT analysis on these samples was completed prior to the common
practice of measuring specific grain compositions. As such, a range in Dparvalues defined as 2.04 ± 1.50 μm
was used, following the same approach to similar samples reported by Wildman et al. [2015].
All AHe single-grain ages were jointly inverted alongside their corresponding AFT data by using the radiation damage accumulation and annealing model of Gautheron et al. [2009], which accounts for the effect of radia-tion damage accumularadia-tion and annealing on He diffusion. Ejecradia-tion of alpha particles from the crystal rim [Farley et al., 1996] was accounted for during each time step of the thermal history [e.g., ,Meesters and Dunai, 2002a, 2002b]. Flowers et al. [2009] present an alternative method of modeling radiation damage accu-mulation and annealing on He diffusion, which has been used to derive thermal histories from many AHe data sets [Clark et al., 2010; Duvall et al., 2011; Ault et al., 2013; Stanley et al., 2013, 2015]. The major difference between the two radiation damage models comes from the treatment of the reduction of defects over time and temperature, which is inversely proportional to the diffusion coefficient [Flowers et al., 2009; Gautheron et al., 2009]. While the Gautheron et al. [2009] model calculates the reduction offission track density in a linear manner, the Flowers et al. [2009] model treats it with an empirically determined cubic function and therefore predicts an enhanced reduction in diffusivity with increasing radiation damage. In practical terms, however, this will only cause significant discrepancies in predicted AHe ages for slowly cooled samples with very high (>100 ppm) or very low eU (<5 ppm) values. The choice of radiation damage model is therefore only a con-cern for two samples from our data set: GGO2 (average eU = 239 ppm) and V-10 (average eU = 3 ppm). Neither model is parameterized for the effect of compositional heterogeneity on the annealing rate of damage defects [Gautheron et al., 2013; Mbongo-Djimbi et al., 2015]. As our understanding of how radiation damage accumulates and anneals and impacts helium trapping and diffusion is still developing, and as the amount of zonation [e.g., Farley et al., 2011] and implantation [e.g., Spiegel et al., 2009] in individual analyzed grains is unknown, less weight was placed on AHe ages by assigning an uncertainty to AHe single-grain ages greater than the analytical uncertainty. All AHe single-grain ages were modeled as if they were whole grain, as opposed to fragments [e.g., Brown et al., 2013; Beucher et al., 2013] and were allowed to be resampled from their uncertainty range.
4.1. Geological Constraints
Two samples were clasts from within the Dwyka Group glacial tillite. Sample SA12-05 was a granite drop-stone, and SA12-06B was a gneissic boulder within afine-grained, weathered matrix. An initial stratigraphic constraint of 300 ± 10 Ma, 10 ± 10°C was specified for modeling these samples [Visser, 1989]. Paleozoic base-ment rocks were assigned an initial constraint of 550 ± 50 Ma and 100 ± 100°C to allow freedom for the initial model conditions to extend back to the beginning of the Pan-African Orogeny. As AFT single-grain ages for
Archean rocks are as old as 503 Ma, an initial constraint of 1000 ± 100 Ma and 100 ± 100°C was used to allow freedom for the initial model conditions during the Proterozoic, allowing the data to determine the thermal history through the Pan-African. For many samples, maximum paleotemperatures are sufficiently elevated so that the AFT and AHe thermochronometers were completely reset after deposition of the Karoo (i.e., Permo-Triassic). However, there are samples that possess a tail of partially annealed tracks arising from thermal histories that have had slower or more complex thermal histories <110 ± 10°C. The lack of further independent geological stratigraphic evidence prevents the use of additional constraints being placed on the thermal histories.
4.2. Results
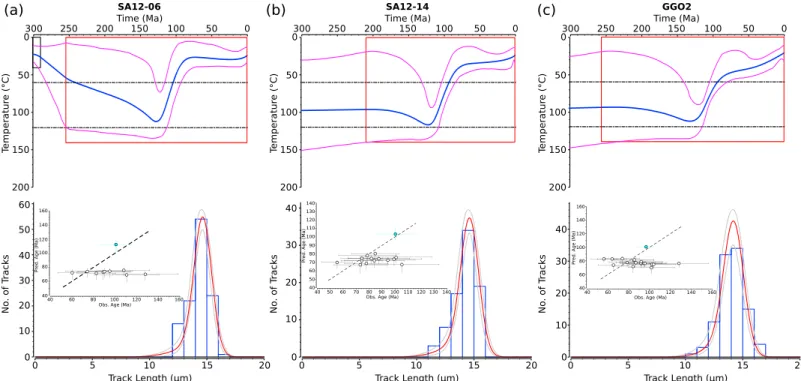
Models that best represent the timing of major cooling events across the Kaapvaal Craton and the adjacent mobile belt are discussed in the sections below. Thermal history models for all samples reported here can be found in Figure S5. The timing of cooling is estimated by using the expected thermal history (blue curves), which is presented with 95% credible intervals (magenta curves).
4.2.1. On-Craton“Paleozoic” Thermal Histories
Two samples were taken from the Archean basement rocks of the Kaapvaal Craton (SR-17 and V-10). By 300 Ma, both samples had reached ~60°C and experienced low rates of cooling (~0.2°C/Myr) from the Permian (300–250 Ma) to the present day. The weighted average (or expected) thermal history for sample SR-17 suggests a monotonic cooling history where the sample cools at a steady rate of 0.2°C/Myr from the Pan-African to present day (Figure 5). A reheating event is possible, within the range of the credible intervals, between 350 and 250 Ma; however, even if this event occurred, the sample would still have remained at tem-peratures cooler than 60°C. The thermal history for V-10 predicts that the last time the sample experienced
Figure 5.“Paleozoic” thermal histories: (top row) thermal history modeling results for two samples from the Kaapvaal Craton highlighting protracted (SR-17) and
negligible cooling (V-10) from the late Paleozoic (<300 Ma) and (bottom row) their data predictions. The blue line shows the expected model (i.e., average of all
models weighted for their posterior probability); the magenta lines indicate 95% credible intervals for the expected model. The red box indicates the prior infor-mation on temperature and time (Figure 5, top row). The histogram shows the observed track-length distributions; the red curve indicates the predicted track-length distributions, and the grey curves indicate 95% credible intervals (i.e., uncertainty) for track-length distribution prediction. The inset plot shows the relationship of observed data against model-predicted data; the white circles represent single-grain AHe ages, and the blue circles represent AFT ages (Figure 5, bottom row).
elevated temperatures of ~100°C was approximately at 500 Ma. Cooling is predicted to have occurred at a rate 0.8°C/Myr until 400 Ma with no additional subsequent cooling to present day (Figure 5).
4.2.2.“Early Cretaceous” Thermal Histories
Two samples (SA12-05 and SA12-06B) were taken from the Dwyka Group outcrop in the east of the Bushmanland Plateau study area, which covers the southwest corner of the Kaapvaal Craton. They are con-strained at the surface in the Permo-Carboniferous. In both thermal histories, the samples are heated to ~110–115°C by the Late Jurassic-Early Cretaceous before cooling initiates at 130–120 Ma (SA12-06B, Figure 6a and SA12-05, Figure S5) at rates of ~1.5 to 2.5°C/Myr. Following this, the cooling rate decreases until near-surface temperatures are reached at 70 Ma until present day. The style of cooling history shown by these samples is also seen by SA12-09 (see Figure S5). Further west, SA12-19B, SA12-14, and GGO2 (Figures 6 and S5) also imply the onset of cooling during the Early Cretaceous. The models also have an initially rapid pulse of cooling at rates of 1 to 1.6°C/Myr followed by slower cooling (0.2 to 0.6°C/Myr; Figures 6b and 6c). The data fit for Early Cretaceous cooling models is generally good, particularly for the AFT data. Factors affecting the discrepancies between observed and predicted AHe ages (Figure 6) are numerous and complex, and, as dis-cussed above, our understanding of the He system and the parameterization of the diffusion models is still evolving [Shuster et al., 2006; Green et al., 2006; Flowers et al., 2009; Gautheron et al., 2009, 2013; Brown et al., 2013; Mbongo-Djimbi et al., 2015]. A consistent observation is that the younger AHe ages are better reproduced by the model, while the older ages are underpredicted. This is consistent with our current under-standing on how radiation damages repair over time and temperature and interact at high densities [Ketcham et al., 2013; Gerin et al., 2017]. Despite the discrepancy between the predicted and model AHe ages, the thermal histories produced are those that bestfit the observed data, considering the given uncertainty ranges. As the observed AHe ages have a larger uncertainty than the AFT data and are resampled within that uncertainty range during the Bayesian inversion, they have less weighting on the thermal history model than the AFT data.
Early Cretaceous cooling is also recorded along the southern margin of the Kaapvaal Craton in sample S-25 (Figure S5). As this sample is from the Upper Beaufort group formation, it is constrained at the surface during the Lower Triassic. The sample is progressively heated until it reaches 120°C at 160–170 Ma. It is possible that this sample was buried under a thick (>1 km) succession of Karoo flood basalts at 180 Ma [Duncan et al., 1997;
Figure 6. (a–c) “Early Cretaceous” thermal histories: (top row) thermal history modeling results for two samples from the Dwyka Group (SA12-06) and Namaqualand
Mobile Belt (SA12-14 and GGO2) that show the onset of crustal cooling in the Early Cretaceous and (bottom row) their data predictions. See Figure 5 for symbol details.
Jourdan et al., 2005, 2007; Moulin et al., 2011; Svensen et al., 2012] and a component of this cooling may be a result of thermal relaxation following the magmatic episode.
4.2.3.“Late Cretaceous” Thermal Histories
Almost half of the samples from the Bushmanland Plateau record the onset of cooling during the middle-to-Late Cretaceous from 110 to 70 Ma. Moreover, cooling at this time is typically more rapid than cooling observed in the Early Cretaceous (1.5 to 2.5°C/Myr). Sample SA12-13A shows the most rapid cooling rates at almost 5°C/Myr for ~20 Myr (Figure 7a).
Slower cooling initiating at this time is predicted by the results for samples SA12-10 and SA12-15 (Figure S5). However, limited track length data were obtained for both of these samples (9 and 17 tracks, respectively). Also, SA12-10 yielded limited single-grain Ftages (12 crystals), and although SA12-15 is supplemented with
two AHe ages, these AHe ages span a range of 100 Ma. The data quality for both of these samples is relatively poor. Consequently, the potential to resolve detail in the thermal histories is low and the results suggest a monotonic cooling history. While this style of thermal history is possible and may reflect regional variations in denudation, we advocate that the dominant cooling style over the Late Cretaceous was fairly rapid. Sample SA12-11 shows cooling beginning at 80–75 Ma at a rate of 1.4°C/Myr until the present day (Figure 7c), although the paucity of measurable track lengths leaves the structure of the track length distribution poorly defined. However, the cooling episode is supported by the young AHe ages (16–38 Ma). Both the AFT age and AHe ages are reproduced well by the model, and it is significant that cooling at this time (80–60 Ma) has been well documented in northern Namibia, linked to the reactivation of large-scale structures within the Pan-African age Damara Belt [Raab et al., 2002, 2005; Brown et al., 2014].
5. Quantitative Constraints on the Geomorphic Evolution of the South
African Plateau
5.1. Previous AFT and AHe Data
Previous work in the region has included (i) AFT and AHe data from the Augrabies Falls area [Kounov et al., 2013]; (ii) AHe data from the Kaapvaal Craton, east of our study area [Stanley et al., 2015]; and (iii) AFT data along the Orange River valley [de Wit, 1988; Wildman et al., 2015] (Figure 1).
Figure 7. (a–c) “Late Cretaceous” thermal histories: (top row) thermal history modeling results for three samples from the Namaqualand Mobile Belt that show the
AFT and AHe data from Augrabies Falls and from the Fish River Canyon in southern Namibia records enhanced cooling from 100 to 65 Ma [Kounov et al., 2013]. This is in agreement with the predominant age of cooling inferred from our data and is interpreted by Kounov et al. [2013] as representing the geomorphic response to regional uplift increasing river gradients and hence erosion rates. AFT and AHe ages are reported by Kounov et al. [2013] for samples from the Augrabies Falls, and the observed ages agree with Late Cretaceous cooling inferred here. However, as acknowledged by the authors, radiation damage effects may have influenced the closure temperature of individual AHe ages and so denudation estimates are made by using AFT data from a vertical profile taken from the Orange River valley wall. Kounov et al. [2013] do not support tectonic reworking as the dominant, regional mechanism that enhanced denudation at this time but do suggest that a record of localized fault reactivation is preserved in their study areas. In the Fish River Canyon, an AFT age of 67 ± 26 Ma in the hanging wall is adjacent to AFT ages of 81 ± 12 to 84 ± 17 Ma in the footwall of a major thrust fault and is used to invoke almost 1 km of offset around 70 Ma. Due to the rela-tive uncertainties of thesefission track ages and lack of track length information to constrain their thermal history, the timing of faulting is still not well constrained. No local tectonic mechanism is suggested to have occurred in the Augrabies Falls region, which is interpreted as reflecting the regional signal of plateau uplift and denudation in the middle Late Cretaceous. While there is consistency in the timing of cooling invoked by our data and that of Kounov et al. [2013], our data suggest greater spatial variability in cooling across the Bushmanland plateau.
Although the data from Kounov et al. [2013] alone do not provide strong evidence for major structural reactivation at ~70 Ma, they are supported by cooling ages from Raab et al. [2002, 2005] and Brown et al. [2014] from northwestern Namibia that also indicate a regionally significant tectonic event at this time. These authors infer that ~2 km of vertical displacement has occurred across the Omaruru-Waterberg Lineament since the Early Cretaceous, with a major period of enhanced denudation occurring at ~70 Ma.
A transect of samples from the coast to the middle of our study area was collected by de Wit [1988] (Figure 1). The majority of the samples from this transect yield AFT ages between 108 and 129 Ma, with MTLs ranging from 13.3 to 14.0μm. This is comparable to our AFT data from west of the craton boundary faults. Two sam-ples from Kakamas and Kenhardt yielded AFT ages of 70 ± 5 Ma and 73 ± 4 Ma and MTLs of 13.98 ± 0.1μm and 14.23 ± 0.1μm, respectively [de Wit, 1988]. No track length histograms are presented, but the mean track length standard deviation for these samples is low (0.88 and 1.12 and n = 74 and 96, respectively), and it can be assumed that the track length distribution is relatively narrow. De Wit [1988] interpret these AFT data as evidence for thermal overprinting due to Late Cretaceous magmatism. The Stompoor intrusion is Late Cretaceous in age [Smith, 1986], but emplacement of other intrusive bodies in the study area occurs in the middle Cretaceous (e.g., Markt, Jonkerwater, and Middlewater) [Moore et al., 2008). The Stompoor intrusion is ~30–40 km SW of the young AFT ages of de Wit [1988] and is unlikely to have had a thermal effect. It is pos-sible that unknown and undated minor intrusions close to the sample locations caused thermal overprinting, but these samples are located adjacent within the structural zone that we suggest may have accommodated deformation and focused denudation during the Late Cretaceous, and this could provide an alternative explanation for these AFT data.
East of our study area, a novel approach to constraining the erosional history of the plateau was presented by Stanley et al. [2015]. In this study, 15 early and mid-Cretaceous kimberlite pipes occurring both on and off the Kaapvaal Craton were sampled. (U-Th)/He ages were obtained on apatites primarily from the kimberlite matrix itself, with additional grains from crustal xenoliths within the pipe. Uncorrected mean AHe ages range from 36 to 72 Ma (corrected mean ages: 54–113 Ma). They concluded that an initial phase of regional erosion beginning in the Early Cretaceous was later perturbed by a spatially variable mid-Cretaceous erosion event controlled by lithospheric-mantle interactions in and around the Kaapvaal Craton. This conclusion is largely supported by our study.
AHe age-eU correlations were used by Stanley et al. [2015] to constrain the thermal history information from these samples; however, this relationship has significant uncertainty [e.g., Gautheron et al., 2013; Mbongo-Djimbi et al., 2015; Brown et al., 2013] and thus demonstrates the importance of modeling AHe data alongside independent information such as AFT data or well-dated geological constraints (e.g., kimberlite intrusion age) to constrain thermal histories.
The current South African thermochronology data set for the interior plateau is dominated by a signal of middle-to-Late Cretaceous cooling. Our new AFT and AHe contribute to this data set by identifying a pre-served Paleozoic history on the craton and by showing that, over the NW-SE trending structural zone at the western craton margin, the timing and style of Cretaceous cooling are spatially variable.
5.2. Timing and Spatial Patterns of Cretaceous Denudation
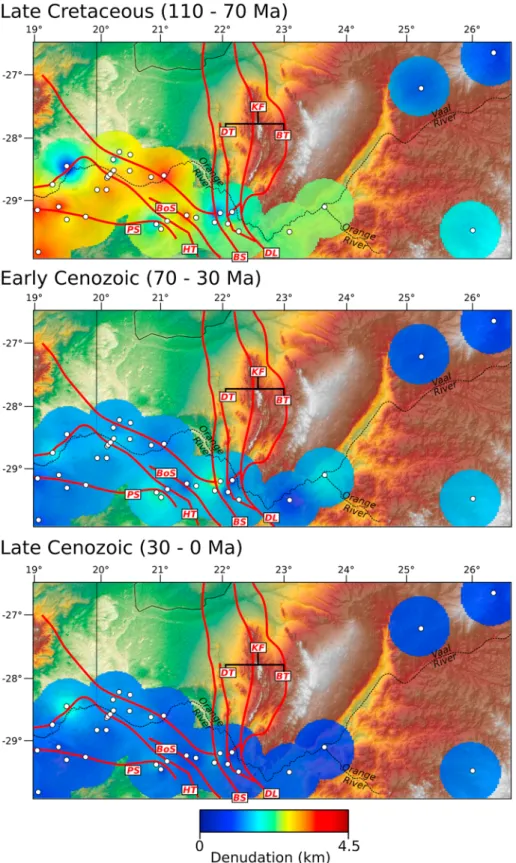
The magnitude of denudation has been calculated by using the thermal history models of Kounov et al. [2013] and Wildman et al. [2015, 2016] and new models presented here, assuming a geothermal gradient of 25°C/km [e.g., Jones, 1987] (Figure 8). Denudation estimates were made for each individual sample simply by dividing the temperature change of the sample over the specified time interval, as predicted by the expected thermal history model by the assumed geothermal gradient (see Figure S6 for more details). Inferring the magnitude of denudation across the study area during the Early Cretaceous is difficult because many samples have not yet cooled below 110 ± 10°C and therefore do not record cooling over this time. A greater number of models record cooling that initiates closer to ~130 Ma, leaving uncertainty on paleotemperatures before this time. Thermal histories that best constrain cooling over this time (see Figure S5) suggest that denudation could have been as high as 2 km (FS1605) and was probably at least 1 km across most of the region (e.g., S-25) except for the most interior Archean samples, which suggest that denudation was minimal<0.2 km over this time.
The thermal history information is better constrained through the middle Late Cretaceous (110–70 Ma) but implies significant heterogeneity of denudation across the plateau (Figure 8). Archean samples in the center of the craton continue to show minimal denudation (<0.3 km). Across the rest of the study area, denudation estimates range from 0 (e.g., PRU106) to 4.2 km (8732-93). Samples in the southwest corner of the study area are characterized by these larger magnitudes (~3.5–4 km) (e.g., of denudation, suggesting that this section of the plateau experienced the same intense period of erosion). In the east of the study area, samples that began cooling in the Early Cretaceous continue to be exhumed but with the removal of less rock than in the west (1–2.2 km as predicted by S-25 and SA12-06B, respectively). Within the heavily faulted zone at the boundary between the Paleozoic mobile belt and Archean craton, denudation is more variable over shorter scales. The regional average denudation (excluding the Archean samples) is 2.5 km however, samples such as SA12-13A and 8732-93 predict that denudation may have been as much as 4 km. At the other extreme, the thermal history model of PRU106 suggests that the sample was not exhumed and may have experienced limited burial during this period. Samples such as GGO2, SA12-09, and SA12-08 suggest similar magnitudes of denudation compared to that predicted by samples east of the structural zone (1.7–2.3 km).
Predicting where the eroded continental interior material has ended up is difficult due to uncertainties over the Cretaceous drainage network during the prerift, synrift, and postrift phases [De Wit, 2007]. It is suggested by many workers though that the westward drainage of Southern Africa has persisted since continental breakup, but internal drainage reorganizations may have altered the position of the major drainage outlet over this time and interior drainage patterns [de Wit, 1999; Moore and Larkin, 2001; Stevenson and McMillan, 2004; Goudie, 2005]. Episodic drainage reorganizations may have occurred during the Cretaceous and early Cenozoic, related to periods of tectonic uplift of the continent at these times [Partridge and Maud, 1987; Dollar, 1998; Goudie, 2005; Moore et al., 2009]. It is likely that most of the eroded material was transported to the nascent Orange Basin, although drainage to interior basins (e.g., Kalahari basin) cannot be ruled out entirely.
Two prominent peaks in accumulated sediment volume and sedimentation rates occur during the Early Cretaceous synrift phase and in the Late Cretaceous in the Orange Basin [Rouby et al., 2009; Guillocheau et al., 2012]. The timing of sedimentation is broadly coeval with the timing of onshore denudation along the continental margin [Wildman et al., 2016] and interior plateau, as described here. Middle-to-Late Cretaceous denudation has been predicted along the southern margin and interior plateau [Tinker et al., 2008; Wildman et al., 2015; Stanley et al., 2013; Green et al., 2016] and correlates with a peak in sediment volumes in the Bredasdorp and Outeniqua Basins [Tinker et al., 2008].
5.3. Timing and Spatial Patterns of Cenozoic Denudation
Throughout the Cenozoic (70–0 Ma) the interior Archean samples continue to record minimal levels of denu-dation. SR-17 suggests that 1 km of material has been removed with ~800 m of this being eroded in the last
Figure 8. Interpolation map for the Late Cretaceous, early Cenozoic, and late Cenozoic based on denudation estimates
extracted from thermal history models. The estimates were made by using a geothermal gradient of 25°C km 1and the
change in temperature of expected thermal history models over the specified time interval (cf. Figures 1 and 2 for sample
and fault names). Full details on denudation estimates including uncertainties on each measurement are given in Figure S6. The interpolation map was created by using an Inverse Distance Weighted interpolation technique in QGis. The interpo-lation was clipped to a buffer with a radius of 0.5° for each sample.