HAL Id: hal-01398029
https://hal.sorbonne-universite.fr/hal-01398029
Submitted on 16 Nov 2016
HAL is a multi-disciplinary open access
archive for the deposit and dissemination of
sci-entific research documents, whether they are
pub-lished or not. The documents may come from
teaching and research institutions in France or
abroad, or from public or private research centers.
L’archive ouverte pluridisciplinaire HAL, est
destinée au dépôt et à la diffusion de documents
scientifiques de niveau recherche, publiés ou non,
émanant des établissements d’enseignement et de
recherche français ou étrangers, des laboratoires
publics ou privés.
at Concordia Station, East Antarctica
Barbara Stenni, Claudio Scarchilli, Valérie Masson-Delmotte, Elisabeth
Schlosser, Virginia Ciardini, Giuliano Dreossi, Paolo Grigioni, Mattia
Bonazza, Anselmo Cagnati, Daniele Karlicek, et al.
To cite this version:
Barbara Stenni, Claudio Scarchilli, Valérie Masson-Delmotte, Elisabeth Schlosser, Virginia Ciardini,
et al.. Three-year monitoring of stable isotopes of precipitation at Concordia Station, East Antarctica.
The Cryosphere, Copernicus 2016, 10 (5), pp.2415 - 2428. �10.5194/tc-10-2415-2016�. �hal-01398029�
www.the-cryosphere.net/10/2415/2016/ doi:10.5194/tc-10-2415-2016
© Author(s) 2016. CC Attribution 3.0 License.
Three-year monitoring of stable isotopes of precipitation at
Concordia Station, East Antarctica
Barbara Stenni1, Claudio Scarchilli2, Valerie Masson-Delmotte3, Elisabeth Schlosser4,5, Virginia Ciardini2, Giuliano Dreossi1, Paolo Grigioni2, Mattia Bonazza6, Anselmo Cagnati7, Daniele Karlicek8, Camille Risi9, Roberto Udisti10, and Mauro Valt7
1Department of Environmental Sciences, Informatics and Statistics, Ca’ Foscari University of Venice, Venice, Italy 2Laboratory for Observations and Analyses of the Earth and Climate, ENEA, Rome, Italy
3LSCE (UMR 8212 CEA-CNRS-UVSQ/IPSL), Université Paris Saclay, Gif-sur-Yvette, France 4Institute of Atmospheric and Cryospheric Sciences, University of Innsbruck, Innsbruck, Austria 5Austrian Polar Research Institute, Vienna, Austria
6Faculty of Forest Sciences and Forest Ecology, Bioclimatology Department, Georg-August-Universität, Göttingen, Germany 7ARPA Center of Avalanches, Arabba, Italy
8Department of Mathematics and Geosciences, University of Trieste, Trieste, Italy
9Laboratoire de Météorologie Dynamique, Institut Pierre Simon Laplace, CNRS, UPMC, Paris, France 10Department of Chemistry “Ugo Schiff”, University of Florence, Florence, Italy
Correspondence to:Barbara Stenni (barbara.stenni@unive.it)
Received: 3 June 2016 – Published in The Cryosphere Discuss.: 20 June 2016
Revised: 15 September 2016 – Accepted: 20 September 2016 – Published: 17 October 2016
Abstract. Past temperature reconstructions from Antarctic ice cores require a good quantification and understanding of the relationship between snow isotopic composition and 2 m air or inversion (condensation) temperature. Here, we focus on the French–Italian Concordia Station, central East Antarctic plateau, where the European Project for Ice Coring in Antarctica (EPICA) Dome C ice cores were drilled. We provide a multi-year record of daily precipitation types iden-tified from crystal morphologies, daily precipitation amounts and isotopic composition. Our sampling period (2008–2010) encompasses a warmer year (2009, +1.2◦C with respect to 2 m air temperature long-term average 1996–2010), with larger total precipitation and snowfall amounts (14 and 76 % above sampling period average, respectively), and a colder and drier year (2010, −1.8◦C, 4 % below long-term and sam-pling period averages, respectively) with larger diamond dust amounts (49 % above sampling period average). Relation-ships between local meteorological data and precipitation isotopic composition are investigated at daily, monthly and inter-annual scale, and for the different types of precipitation. Water stable isotopes are more closely related to 2 m air tem-perature than to inversion temtem-perature at all timescales (e.g.
R2=0.63 and 0.44, respectively for daily values). The slope of the temporal relationship between daily δ18O and 2 m air temperature is approximately 2 times smaller (0.49 ‰◦C−1) than the average Antarctic spatial (0.8 ‰◦C−1)
relation-ship initially used for the interpretation of EPICA Dome C records. In accordance with results from precipitation mon-itoring at Vostok and Dome F, deuterium excess is anti-correlated with δ18O at daily and monthly scales, reaching maximum values in winter. Hoar frost precipitation samples have a specific fingerprint with more depleted δ18O (about 5 ‰ below average) and higher deuterium excess (about 8 ‰ above average) values than other precipitation types. These datasets provide a basis for comparison with shallow ice core records, to investigate post-deposition effects. A pre-liminary comparison between observations and precipitation from the European Centre for Medium-Range Weather Fore-casts (ECMWF) reanalysis and the simulated water stable isotopes from the Laboratoire de Météorologie Dynamique Zoom atmospheric general circulation model (LMDZiso) shows that models do correctly capture the amount of pre-cipitation as well as more than 50 % of the variance of the observed δ18O, driven by large-scale weather patterns.
De-spite a warm bias and an underestimation of the variance in water stable isotopes, LMDZiso correctly captures these re-lationships between δ18O, 2 m air temperature and deuterium excess. Our dataset is therefore available for further in-depth model evaluation at the synoptic scale.
1 Introduction
Antarctic ice cores provide exceptional past climate records, thanks to the wealth of climatic and environmental informa-tion archived in the water and air of deep ice cores (e.g. Jouzel and Masson-Delmotte, 2010; WAIS Divide Project Members, 2015). Amongst these various proxies, water sta-ble isotopes are integrated tracers of the atmospheric wa-ter cycle and local climate (Masson-Delmotte et al., 2008, 2011). Water stable isotope records from central Antarctica are pivotal for reconstructions of past temperature and mass balance (Parrenin et al., 2016). Low-accumulation sites in the central Antarctic plateau provide the longest continuous ice core records retrieved so far, documenting the last eight cli-matic cycles (Jouzel et al., 2007), with a potential to expand these records beyond one million years (Fischer et al., 2013). This motivates an improved knowledge of relationships be-tween water stable isotopes and climate.
Since the 1950s, observations (Dansgaard, 1964), theo-retical distillation models (Jouzel and Merlivat, 1984) and atmospheric general circulation models (Jouzel, 2014) have evidenced a close relationship between the isotopic compo-sition of polar precipitation and condensation temperature. While this has formed the basis for past temperature recon-structions from deep Antarctic ice cores, key sources of un-certainties have been identified in the climatic interpretation of water stable isotope records.
Uncertainties arise from the empirical relationship be-tween the isotopic composition of precipitation and tempera-ture. This relationship is affected by atmospheric processes associated with fractionation processes and mixing occur-ring from evaporation to deposition, as well as by the inter-mittency of precipitation events, which provide an irregular sampling of specific weather events. From this perspective, it is expected that condensation temperature should be the key driver of distillation, and is the one most closely related to the precipitation isotopic composition. Another source of uncertainty arises from post-depositional processes, as re-cent monitoring studies performed above the Greenland ice sheet have suggested that the isotopic composition of surface snow can change in-between snowfall events due to snow– atmospheric exchanges in relation to surface snow metamor-phism (Steen-Larsen et al., 2014). While there is recent evi-dence for water vapour exchange between surface snow and Antarctic air (Ritter et al., 2016; Casado et al., 2016; Touzeau et al., 2016), the importance of this process for ice core records has not yet been quantified.
Empirical relationships between surface snow isotopic composition and temperature were established based on the geographical (spatial) relationships between surface snow samples and the temperature obtained from weather stations or measured at 10 m depth in the firn, sometimes with addi-tional assumptions on relationships between 2 m and conden-sation air temperature. In a compilation of available Antarc-tic data (Masson-Delmotte et al., 2008), spatial isotope– temperature slopes of 0.80 and 6.34 ‰◦C−1were calculated for δ18O and δD, respectively, with an uncertainty of ±20 % associated with the spatial variability of this relationship.
Alternatively, atmospheric general circulation models equipped with water stable isotopes have been used to inves-tigate the relationships between the simulated precipitation isotopic composition and temperature for cold climate con-ditions, such as the Last Glacial Maximum, or extreme warm climate conditions, such as increased CO2projections. While
all existing simulations have suggested that the modern spa-tial relationship for central Antarctica is a good approxima-tion for glacial to present-day changes (Jouzel et al., 2003), it may not apply for warm climatic conditions. Schmidt et al. (2007), using a coupled ocean–atmosphere model, re-ported a variability in the temporal slope for δ18O in East Antarctica of 0.2–0.5 ‰◦C−1for simulations performed at the inter-annual scale and during the mid-Holocene. More-over, Sime et al. (2008) simulated a much weaker sensitivity of δ18O to temperature (0.34 ‰◦C−1), together with signifi-cant regional differences in a simulated climate driven by in-creased atmospheric CO2concentration. This was attributed
to changes in the covariance between simulated temperature and precipitation.
Finally, attempts have been made to account for changes in moisture sources, thanks to combined measurements of δD and δ18O allowing calculation of the second-order pa-rameter deuterium excess (d = δD-8 · δ18O). The coefficient of 8 in this definition accounts for the global mean ratio of equilibrium fractionation effects for oxygen and hydrogen isotopologues. In Antarctic precipitation, deuterium excess is partly affected by air mass distillation effects, due to the impact of condensation temperature on equilibrium fraction-ation (and devifraction-ation from this coefficient of 8), but also to the changes in evaporation conditions, themselves driven by sea surface temperature, wind speed and relative humidity at the sea surface (Uemura et al., 2008) as well as kinetic effects during snow formation (Jouzel and Merlivat, 1984). Based on simulations performed with distillation models, it is pos-sible to extract information on both condensation tempera-ture and evaporation conditions from the combined measure-ments of water stable isotopes. This methodology has been applied to several deep Antarctic ice cores (e.g. Stenni et al., 2001; Vimeux et al., 2002; Uemura et al., 2012). This ap-proach led to the conclusion that significant changes in evap-oration conditions occurred at glacial–interglacial scales, but with secondary effects on the isotope–temperature relation-ships.
T able 1. Comparison of stable isotope – air temperature slopes for dif ferent sites in Antarctica. Site Lat. Long. Ele v ation δ 18 O / T slopes Statistics T ime T ype of data T ype of data Notes References name ( ◦) ( ◦) (m) (‰ ◦C − 1) & period for isotopes for temperature samples analysis analysis Dome C − 75.12 123.31 3233 0.42–0.49 2008–2010 (daily and monthly v al-ues) Precipitation samples A WS This study Dome F − 77.32 39.7 3810 0.78 R = 0 .887 N = 330 2003 (daily v alues) Precipitation samples A WS Fujita and Abe (2006) 0.52 N = 11 1997 (monthly values) Freshly fallen sno w , drifting sno w and surf ace sno w samples A WS Moto yama et al. (2005) V ostok − 78.28 104.80 3488 δ D: 2.12 2000 (monthly v alues) Sno w precipita-tion Manual mea-surements Ekaykin et al., 2004 La w Dome − 66.77 112.98 1370 0.44 R 2 = 0 .99 N = 12 Mean monthly v
alues (temperature 1986–1991, isotope
1304– 1988) Ice core A WS v an Ommen and Mor -g an (1997) Neumayer Station − 70.65 − 8.25 42 0.57 R = 0 .69 N = 248 1981–2000 (monthly values) Fresh sno w samples A WS Schlosser et al. (2004) O’Higgins (Ant. Pen.) − 63.32 − 57.90 13 0.41 R = 0 .79 N = 180 2008–2009 (monthly values) Firn cores A W S Ferna ndo y et al. (2012) F araday St. − 65.25 − 64.27 0 0.46 R = 0 .61 N = 96 1964–1971 (monthly values) Ice cores 10 m depth temperature Peel et al. (1988) Antarctic Peninsula 0.5–0.6 R = 0 .3–0.5 N = 21 1960–1980 (an-nual v alues) Ice cores 10 m depth temperature Isotope at Gomez and Dolleman tem-perature at F araday and Halle y stations Dronning Maud Land coastal area 0.24–0.34 R = 0 .54–0.71 N = 300 1981–2006 Firn cores A WS T emperature at Neumayer Station Fernando y et al. (2010) SW Ant. Pen − 73.59 − 70.36 1400 0.5 n.a. 1980–2005 Ice core 2 m ECMWF temperature Gomez ice core Thomas et al. (2009) Antarctica 0.34 (continent) R 2 = 0 .25 2020–2100 Model simula-tions 2 m HadAM3 temperature HadAM3 simu-lations with an increased CO 2 2100 climate projection scenario Sime et al. (2008) 0.47 (East Antarctica) R 2 = 0 .45 0.5 (peninsula) R 2 = 0 .56
Figure 1. Map of Antarctica showing the location of the study site Concordia Station at Dome C and other sites cited in the text.
This overview illustrates the incomplete understanding of the relationship between the isotopic composition of Antarc-tic snowfall and local temperature, which, so far, mostly re-lies on either mean spatial relationships, or on simulations performed with atmospheric general circulation models with known caveats for the Antarctic climate (Flato et al., 2013).
A better process-based understanding is expected from snowfall isotopic composition monitoring, from the scale of weather systems to seasonal and inter-annual variations. Pi-oneering studies have been conducted in coastal Antarctica and on the central East Antarctic plateau, where deep ice cores have been retrieved (Fig. 1, Table 1).
For instance, Schlosser et al. (2004) used fresh snow sam-ples collected after each snowfall event at Neumayer Station, situated in a coastal area. They investigated the relationships between snow δ18O and temperature as a function of the synoptic situation and air mass trajectory classes, based on 5-day back trajectories. The δ18O–temperature relationship was different for different trajectory classes and strongly de-pendent on the presence of sea ice along air mass pathways.
Fujita and Abe (2006) used a 1-year dataset of daily pre-cipitation measurements at Dome Fuji Station, on the East Antarctic plateau, to depict a strong linear relationship be-tween stable isotope ratios and air temperature, coherent with the regional geographical relationship using 10 m snow tem-perature. Ekaykin et al. (2004) reported a significant correla-tion between monthly values of δD and air temperature for 1-year snowfall sampling performed at Vostok. They obtained a temporal slope significantly lower than the spatial one (Ta-ble 1).
Precipitation measurements are also important for the evaluation of atmospheric circulation models in their
abil-ity to capture snowfall timing, amount and isotopic com-position. So far, the ability to reproduce Antarctic isotopic signals has been benchmarked mostly using spatial patterns (e.g. Werner et al., 2011; Risi et al., 2010). Obtaining high-resolution snowfall datasets is important to test whether mod-els correctly resolve synoptic-scale processes.
Here, we use the first and so far only multi-year se-ries of daily precipitation measurements and sampling from the French–Italian Concordia Station (Fig. 1), located at Dome C in East Antarctica (75◦060S, 123◦210E; elevation: 3233 m a.s.l.; temperature at −10 m: −54.5◦C; snow ac-cumulation rate: ≈ 25 mm w.e. year−1; w.e. denotes water equivalent), where the longest continuous ice core records have been retrieved in the framework of the EPICA project (Jouzel et al., 2007). Snow particle observations provided an identification of precipitation types (diamond dust, hoar frost and snowfall), allowing us to explore potential impacts on their isotopic composition. We also used our dataset and ac-cumulation measurements to assess the capacity of one oper-ational meteorological model to resolve accumulation, and one atmospheric general circulation model equipped with water stable isotopes to resolve isotope–temperature relation-ships at the daily to monthly scale. Section 2 describes the meteorological and precipitation isotopic composition data as well as the simulations explored in the model–data com-parison. Section 3 reports and discusses our results with a fo-cus on the isotope–temperature relationship, and includes a model–data comparison. The implications of our results and outlooks are finally presented in Sect. 4.
2 Data and methods 2.1 Temperature
Different automatic weather stations (AWSs) have been oper-ated around Concordia Station. The longest time series stems from the US AWS, which was set up by the Antarctic Meteo-rological Research Centre of the University of Wisconsin-Madison in December 1995 at a distance of 1.5 km from Concordia (http://amrc.ssec.wisc.edu). The AWS provides 10 min averages of the respective meteorological variables, which were used to calculate the daily mean air tempera-ture at 2 m height (T2 m). Since 2005, vertical profiles of
dif-ferent parameters have been retrieved from radiosonde data, launched once per day by the Institut Polaire Français Paul Emile Victor – IPEV/Italian Antarctic Meteo-climatological Observatory (http://www.climantartide.it).
A strong surface-based temperature inversion occurs at Dome C, which can reach a strength of up to 35◦C in winter and is mostly restricted to the lowest 100 m or less (Pietroni et al., 2014). As a first approximation, the condensation tem-perature (Jouzel and Merlivat, 1984; Masson-Delmotte et al., 2008) is assumed to be equal to the temperature at the up-per limit of the inversion layer. It is determined from daily
radiosounding profiles as the bottom of the first layer where temperature decreases with altitude. Thin layers with tperature decreasing with height are ignored if they are em-bedded within a deeper inversion layer (Kahl, 1990). We are aware that this approach is associated with large uncertain-ties, as small changes in height may lead to large temperature differences.
2.2 Precipitation data
Since the summer campaign of 2005–2006, precip-itation samples have been manually collected year-round on a 80 × 120 cm wooden platform covered by a polystyrene/Teflon plate and standing 1 m above the snow surface. It is situated at a distance of about 800 m from Con-cordia Station. The layer of accumulated snow was collected at 01:00 UTC (Coordinated Universal Time). This snow layer generally has a thickness varying from 0 to 10 mm. A few isolated cases of 30–50 mm thickness related to blowing snow events were also observed. To prevent the snow from being blown off, the plate was shielded by a rail of 8 cm height. We cannot rule out impacts of winds on our sam-pling: snow may be blown onto (or off) the platform by the wind, with or without precipitation. The sampling frequency has increased with time: since the end of 2007, sampling has been performed on a daily basis. We report results here for the period from 17 December 2007 to 31 December 2010, for a total of 1110 days and 607 precipitation samples.
When the amount of collected precipitation was too small to allow isotope analyses, the support plate was cleaned, no sample was collected and no precipitation amount was de-termined for that day. In all other cases, snow samples were immediately sealed into date-labelled plastic bags and pre-served in a frozen state until their delivery at the Geochem-istry Laboratory of the University of Trieste. Samples were then melted and transferred into appropriate HDPE (high-density polyethylene) vials and immediately stored into the freezers (≈ −20◦C) until their analysis.
Precipitation can consist of falling precipitation (snowfall and diamond dust) and deposited precipitation (hoar frost). Diamond dust is sometimes called clear-sky precipitation, even though it can also be observed under high cloud cover. It consists of very fine ice crystals that form due to radia-tive cooling of an almost saturated air mass. Mixing of moist warmer air with colder air can also lead to supersaturation of the cold air and thus formation of ice crystals (Walden et al., 2003). This can occur with or without the presence of condensation nuclei. The crystal type of diamond dust is a function of air temperature; fine needles are usually reported at temperatures below −40◦C. Snowfall is observed when advection of moisture leads to cloudiness and “normal” pre-cipitation, where characteristic snowflakes consist of an ag-gregate of ice crystals. Hoar frost forms when the surface is cooled below the dew point of the overlying air, mostly due to radiative cooling. Various surfaces (e.g. ropes, flags,
in-Figure 2. Photographs of precipitation types as identified on the wooden platform according to the Magono and Lee (1966) classifi-cation: (a) hoar frost; (b) snowfall: combinations of bullets (C2a); (c) mixture of minute hexagonal plate (diamond dust, G3) and thick plate of skeleton form (snowfall, C1h) crystals. The photographs were taken by the winter-over personnel at Concordia Station.
struments, surface snow cover) then act as condensation sur-faces.
Further information about the meteorological conditions was provided by the Concordia base staff. The precipitation collected on our platform was examined daily using a mag-nifying lens and a high-resolution camera to determine these three broad types of precipitation (snowfall, diamond dust and hoar frost) based on crystal morphology (Fig. 2).
The surface snow accumulation has also been moni-tored at Dome C since 2005 as part of the GLACIO-CLIM – Surface Mass Balance of Antarctica (SAMBA) ob-servatory (http://www-lgge.obs.ujf-grenoble.fr/ServiceObs/ index.htm). A 50-stake network was deployed near Con-cordia Station as a 1 km × 1 km cross and has been repeat-edly surveyed for stake emerging length during each sum-mer season. The network lies about 2 km upwind from the main station infrastructures. The uncertainty can be esti-mated through the variance of the 50 readings within a stakes network. It reaches about 10 % of the annual mean value. These snow height variations are converted into accumula-tion in water equivalent (w.e.) using a mean snow density value of 320 kg m−3following Genthon et al. (2015).
2.3 Stable isotope data
Stable isotope ratios of the precipitation samples were mea-sured by isotope ratio mass spectrometry (IRMS) techniques (Thermo-Fisher Delta Plus Advantage) using the well-established CO2-H2/water equilibration method. When the
sample amount was less than 5 mL, the measurements were performed using a cavity ring-down spectroscope (CRDS) from PICARRO (model L1102-i), which only requires 0.3 ml water. Measurements are reported against the Vienna Stan-dard Mean Ocean Water (V-SMOW) international stanStan-dard. The IRMS provides an analytical precision of ±0.05 ‰ for δ18O and ±0.7 ‰ for δD, while the CRDS used here war-rants a precision of ±0.1 ‰ for δ18O and ±0.5 ‰ for δD, with a final precision on the calculated deuterium excess of ±0.8 and ±0.9 ‰, respectively.
Figure 3. Meteorological variables and stable isotope data of fresh snow samples from Concordia site for the 2008–2010 study period: (a) daily mean 2 m air temperature from AWS (T2 m, blue line), temperature at the top of the inversion layer (Tinv from radiosounding profiles, dark green line) and δ18O of precipitation samples (filled orange circle). Monthly means of T2 m, Tinv and δ18O are given as
horizontal double red, green and yellow lines, respectively. (b) Deuterium excess of the daily precipitation samples (yellow filled squares).
2.4 Model data
The high-resolution precipitation measurements are used to test the ability of a global weather forecast model to pro-duce realistic snowfall events driven by the synoptic-scale weather. Simulated snowfall (SF) and evaporation (E) are obtained from the ERA-Interim Reanalysis, which is pro-vided by the European Centre for Medium-Range Weather Forecasts. Time series for Concordia Station are extrapolated from the 24 h forecasted precipitation and evaporation fields, with a regular 0.75◦×0.75◦ latitude–longitude grid, at the grid model point nearest to the Concordia site coordinates. Atmospheric models (both global and mesoscale) system-atically underestimate East Antarctic plateau precipitation, probably because clear-sky precipitation is not adequately parameterized (Bromwich et al., 2004; Van de Berg et al., 2006). However, Genthon et al. (2010) showed that part of these mismatches may, however, also arise from data inac-curacies. The ECMWF model does not account for blowing snow transport/sublimation. However, since the Concordia site is not influenced by strong winds this is expected to have minor importance here, but cannot be completely neglected.
In order to test the suitability of the new Concordia dataset to evaluate isotopic-enhanced atmospheric general circula-tion models (GCMs), here we use LMDZiso (Laboratoire de Météorologie Dynamique Zoom), the isotopic version (Risi et al., 2010) of the LMDZ4 atmospheric GCM (Hourdin et
al., 2006), run at a resolution of 2.5◦×3.75◦, following the AMIP (Atmospheric Model Intercomparison Project) proto-col. The simulation is nudged to the large-scale ECMWF op-erational analyses atmospheric circulation fields. The model has systematic caveats for the Antarctic climate, such as a warm and wet bias leading to a weaker δ18O depletion than in the measurements (Risi et al., 2013). We extracted the model daily outputs at the Concordia grid point.
3 Results
3.1 Observed and simulated variabilities of temperature and stable isotopes
In Fig. 3, meteorological variables and stable isotope data of the fresh snow daily samples from Concordia Station are dis-played for the study period 2008–2010, together with their monthly means. The daily mean 2 m air temperature varies from about −80◦C in winter to −25◦C in summer (Fig. 3a).
Its annual course reflects the coreless winter typical for the interior of Antarctica (van Loon, 1967). During the polar night, with the lack of shortwave radiation, an equilibrium of downwelling and upwelling long-wave radiation is reached, leading to this “coreless winter”. By contrast, a sharp sum-mer temperature maximum follows the peak of insolation, at the end of December/early January.
The 2008–2010 sampling period encompasses remarkable inter-annual variations of atmospheric boundary layer (ABL) conditions at the Concordia site. In particular, the 2009 winter (June–July–August) was 4.0◦C warmer than average (−62.6◦C, 1996–2010 seasonal winter average), and a new record high temperature was reached in July 2009. By con-trast, winter 2010 was 4.5◦C colder than average, and a new negative temperature record was observed in July 2010 (8◦C below average). These contrasting conditions are related to an enhanced frequency of intrusions of warmer and moister air masses from lower latitudes in the 2009 winter (Gen-thon et al., 2013). While a strong zonal atmospheric flow was dominant in 2010, an enhanced meridional flow prevailed in 2009, which increased the meridional transport of heat and moisture onto the East Antarctic plateau (Schlosser et al., 2016). This led to a number of precipitation/warming events at Concordia.
The ABL at Concordia is characterized by a persistent and generally strong inversion, which only disappears in sum-mer in the early afternoon due to convective mixing (Gen-thon et al., 2010). During the study period, the inversion layer showed a large variability in both strength and vertical exten-sion, with Tinvreaching from −40◦C in the middle of winter
to −25◦C in summer. Temperature differences between 2 m and the top of the inversion layer, calculated from AWS and radiosonde data, respectively, can vary from 1–2◦C in sum-mer to 20–30◦C in winter (Genthon et al., 2013; Pietroni et al., 2014).
A linear regression of Tinv as a function of T2 m reveals
a slope of 0.35 (R2=0.67, n = 1002) varying from 0.51 in summer (November–February, R2=0.68, n = 345) to 0.39 in winter (March–October, R2=0.34, n = 657), re-spectively. This is neither in line with the simple empirical equation reported by Jouzel and Merlivat (1984) that yields a value of 0.67, nor is it in line with a 0.65 value obtained from the ERA-40 (1980–2002) relationship between annual surface temperature and weighted annual mean condensation temperature (Masson-Delmotte et al., 2008). However, these discrepancies may arise from the different methodologies to estimate Tinvas well as the choice of different periods to
cal-culate this relationship.
The δ18O (Fig. 3a) and δD (not shown) values range from −80.60 to −35.46 ‰, and from −584.7 to −284.0 ‰, re-spectively. The lowest δ18O and δD values found in daily snow samples over the whole period, both recorded on 22 July 2010, are close to the isotopically lightest water ever collected on Earth (at Dome Fuji −81.9 and −595.5 ‰, re-spectively; Fujita and Abe, 2006). Both isotopes exhibit large seasonal amplitudes of the order of about 37 ‰ for δ18O and 245 ‰ for δD (average values from 2008, 2009 and 2010). The intra-seasonal variability of δ18O appears more parallel to that of T2 min winter than in summer. At the inter-annual
scale, the seasonal variations are larger in 2010 than in 2009. The LMDZiso model has a warm bias at Concordia, with a mean annual simulated T2 m value of −46.4◦C, compared
with our observations of −51.15◦C in 2008–2010 period. This warm bias is associated with δ18O that is too high in the whole of Antarctica (Risi et al., 2013). Despite a warm bias and δ18O values that are too high, LMDZiso is able to capture some of the observed daily (R2=0.50) to monthly (R2=0.75) variability of δ18O (Table 2), but underestimates the magnitude of δ18O variability. LMDZiso is able to repro-duce the observed daily (R2=0.76) to monthly (R2=0.90) variability of T2 m(Table 2), but it overestimates the
magni-tude of T2 mvariability. This is an encouraging result, given
the low resolution of this atmospheric model, suggesting that the nudging to winds from reanalyses drives a realistic syn-optic variability.
The observed local meteoric water line is equal to δD = 6.5 δ18O − 68.8 (R2=0.98), considering all the precipitation values. The decrease of the δD/δ18O slope from coastal to inland Antarctica is reflected on the deuterium excess calcu-lation.
The deuterium excess daily observations (Fig. 3b) range from −32.19 to 60.11 ‰. Deuterium excess appears anti-correlated with δ18O or δD; it is maximal in winter and minimal in summer (frequently reaching negative values), with an overall seasonal amplitude of about 70 ‰. The deu-terium excess exhibits the highest values of up to > 60 ‰ in the cold winter of 2010, whereas in 2009 the values mostly stay below 40 ‰. From daily data, deuterium excess is anti-correlated with δ18O (R2=0.70, n = 499) with a slope of −1.5 (Table 2). This confirms the antiphase between δ18O and deuterium excess also observed in precipitation samples from Vostok (Ekaykin et al., 2004) and Dome F (Fujita and Abe, 2006). Such anti-correlation is not observed in coastal Antarctica as at Neumayer Station in Dronning Maud Land and at Law Dome (Delmotte et al., 2000; Schlosser et al., 2008).
Despite the LMDZiso systematic bias and an underestima-tion of the variance of deuterium excess, the model is able to capture this antiphase but with a weaker correlation coeffi-cient (R2=0.43), and a slope that is 3 times weaker than observed for both daily and monthly values (Table 2). This small deuterium excess −δ18O slope is expected to be a di-rect consequence of the model warm bias, also evidenced in the model meteoric water line slope (7.5).
3.2 Observed vs. simulated variabilities of precipitation and accumulation
We now compare the cumulative accumulation from the stake array, the measured cumulative precipitation amount (Fig. 4) with simulations of snowfall or accumulation (snow-fall minus evaporation) from ECMWF and snow(snow-fall from LMDZ. Stake data are only available in the respective sum-mer months.
The annual amounts of the sampled snow (snow-fall + diamond dust + hoar frost) are 12.5, 15.7 and 13.3 mm w.e. for 2008, 2009 and 2010, respectively. Taking
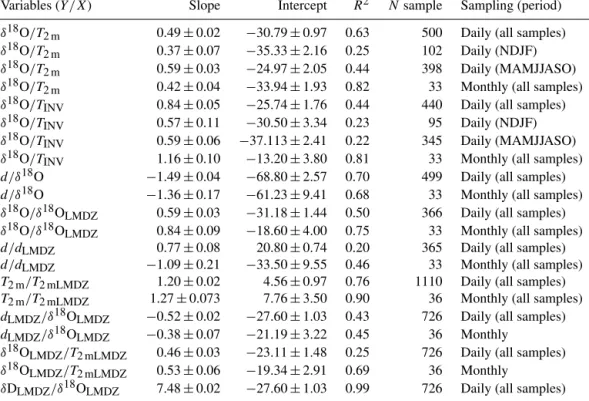
Table 2. δ18O-T (T2 mand Tinv), d-δ18O, δ18O-δ18OLMDZ, T2 m-T2 mLMDZ, dLMDZ-δ18OLMDZand δ18OLMDZ-T2 mLMDZregressions for
daily and monthly precipitation at Concordia, over the period 2008–2010.
Variables (Y /X) Slope Intercept R2 Nsample Sampling (period) δ18O/T2 m 0.49 ± 0.02 −30.79 ± 0.97 0.63 500 Daily (all samples)
δ18O/T2 m 0.37 ± 0.07 −35.33 ± 2.16 0.25 102 Daily (NDJF)
δ18O/T2 m 0.59 ± 0.03 −24.97 ± 2.05 0.44 398 Daily (MAMJJASO)
δ18O/T2 m 0.42 ± 0.04 −33.94 ± 1.93 0.82 33 Monthly (all samples)
δ18O/TINV 0.84 ± 0.05 −25.74 ± 1.76 0.44 440 Daily (all samples)
δ18O/TINV 0.57 ± 0.11 −30.50 ± 3.34 0.23 95 Daily (NDJF)
δ18O/TINV 0.59 ± 0.06 −37.113 ± 2.41 0.22 345 Daily (MAMJJASO)
δ18O/TINV 1.16 ± 0.10 −13.20 ± 3.80 0.81 33 Monthly (all samples)
d/δ18O −1.49 ± 0.04 −68.80 ± 2.57 0.70 499 Daily (all samples) d/δ18O −1.36 ± 0.17 −61.23 ± 9.41 0.68 33 Monthly (all samples) δ18O/δ18OLMDZ 0.59 ± 0.03 −31.18 ± 1.44 0.50 366 Daily (all samples)
δ18O/δ18OLMDZ 0.84 ± 0.09 −18.60 ± 4.00 0.75 33 Monthly (all samples)
d/dLMDZ 0.77 ± 0.08 20.80 ± 0.74 0.20 365 Daily (all samples)
d/dLMDZ −1.09 ± 0.21 −33.50 ± 9.55 0.46 33 Monthly (all samples)
T2 m/T2 mLMDZ 1.20 ± 0.02 4.56 ± 0.97 0.76 1110 Daily (all samples)
T2 m/T2 mLMDZ 1.27 ± 0.073 7.76 ± 3.50 0.90 36 Monthly (all samples)
dLMDZ/δ18OLMDZ −0.52 ± 0.02 −27.60 ± 1.03 0.43 726 Daily (all samples)
dLMDZ/δ18OLMDZ −0.38 ± 0.07 −21.19 ± 3.22 0.45 36 Monthly
δ18OLMDZ/T2 mLMDZ 0.46 ± 0.03 −23.11 ± 1.48 0.25 726 Daily (all samples)
δ18OLMDZ/T2 mLMDZ 0.53 ± 0.06 −19.34 ± 2.91 0.69 36 Monthly
δDLMDZ/δ18OLMDZ 7.48 ± 0.02 −27.60 ± 1.03 0.99 726 Daily (all samples)
Figure 4. Cumulative measured precipitation amount (black line), measured cumulative precipitation for diamond dust (green line), snowfall (red line) and hoar frost (blue line) and modelled cumula-tive precipitation from ECMWF (snowfall, snowfall minus evapora-tion, orange and light blue, respectively) and LMDZ (snowfall, light grey line). Cumulative accumulation from stake array (dark grey vertical bars). Stake data are only available in the relevant summer months.
into account the uncertainties associated with measurements of such extremely small amounts of precipitation, the esti-mated precipitation amounts are coherent with the year-to-year variability of air temperature: larger amounts in winter
2009 (unusually warm and wet) and smaller amounts in 2010 (extremely cold and dry). From these 2 years, the relationship between precipitation amount and T2 mis of 6.4 %◦C−1, very
close to climate model projection results (Frieler et al., 2015). Our dataset also shows a much larger number of snowfall events (111 with respect to 31) in 2009 than in 2010 (Fig. 5). In 2008–2009, the precipitation amount shows a minimum in late spring–early summer (NDJF) and a maximum in late autumn–winter (MJJA). However, the seasonality is differ-ent in 2010, where most of the precipitation occurred in late summer and early autumn (FMA) as diamond dust. A high inter-annual variability of both amount and type of precip-itation is observed for the considered time period. Snowfall provided the majority of precipitation for 2009, whereas hoar frost and diamond dust were predominant in 2008 and 2010, respectively (Fig. 5).
The total annual accumulation derived from the pre-cipitation measurements is 37–50 % lower than the long-term average annual accumulation rate for Dome C (≈ 25 mm w.e. year−1)derived from firn core and stake mea-surements (Frezzotti et al., 2005; Urbini et al., 2008). Com-parison between summer stake field measurements and cu-mulative accumulation from our samples also shows a low bias of 40 % in our sampling. This is probably due to the loss of snow particles from our sampling plate, which may arise from lower cohesion forces between snow particles on the wooden plate compared to the forces within the snow, to the
Figure 5. Monthly totals of precipitation for 2008–2010, given for diamond dust, hoar frost and snowfall (a); relative (%) and absolute amounts (mm w.e.) and number of events for diamond dust, hoar frost and snowfall for each year (b, c, d) and for the entire period 2008–2010 (e).
higher wind speed at 1 m height than directly at the surface, or to enhanced sublimation on the plate.
The ECMWF model displays a correct timing for large snowfall events and yields higher accumulation than the mea-surements (14.8, 17.9 and 12.4 mm w.e. for 2008, 2009 and 2010, respectively), but less than inferred from the stake ar-ray. Sublimation is simulated by the model. It represents a minor fraction of snowfall (< 10 %), with net annual values of 1.4, 0.16 and 1.4 mm w.e. for 2008, 2009 and 2010, re-spectively, related to sublimation events of ≈ 3 mm w.e dur-ing summer, partially countered by deposition events durdur-ing winter.
The LMDZ model cumulative snowfall is fairly similar to the ECMWF, but this model produces more snowfall than ECMWF in 2008 and less than observed in 2009 and 2010. The ECMWF model seems to correctly reproduce the ob-served seasonal accumulation variability. On the other hand, LMDZ seems to be able to reproduce only larger monthly accumulation peaks, with greater discrepancies during late 2009–early 2010 (not shown).
3.3 Observed δ18O – temperature relationship
Least-square regression analysis of the relationship be-tween δ18O and temperature from daily or monthly observa-tions (using 2 m and inversion temperature) and simulaobserva-tions (LMDZ) are reported in Table 2. Note that for better compar-ison with the data from other stations (Table 1) we did not remove seasonality from our data.
We first focus on the daily data. The δ18O/T2 m slope is
0.49 ± 0.02 ‰◦C−1 (R2=0.63, n = 500), lower than the spatial slope of 0.8 ‰◦C−1 obtained by Masson-Delmotte et al. (2008) for their database of Antarctic surface snow
iso-topic composition, which is itself close to the value expected from a Rayleigh distillation. Our results are intermediate be-tween those obtained at other East Antarctic plateau sites (Table 1). Based on 1-year precipitation sampling in other inland Antarctic sites (Table 1), contrasted results were ob-tained at Vostok, where the associated slope (2.2 ‰◦C−1for δD, Ekaykin et al., 2004) was 3 times lower than the spa-tial one, while at Dome F, the δ18O slope was close to the spatial relationship in daily precipitation samples collected in 2003 (0.78 ‰◦C−1; Fujita and Abe, 2006). However, Mo-toyama et al. (2005) reported a δ18O slope of 0.57 ‰◦C−1 based on monthly fresh snow samples collected in 1997 at Dome F. Investigations performed at coastal sites using ei-ther shallow ice core data or precipitation data have sys-tematically reported temporal slopes significantly lower than the average spatial relationship: a seasonal slope estimated at 0.44 ‰◦C−1 for δ18O from Law Dome ice cores (van
Ommen and Morgan, 1997), inter-annual slopes of 0.24– 0.34 ‰◦C−1for δ18O from coastal Dronning Maud Land ice cores (Fernandoy et al., 2010) and a value of 0.57 ‰◦C−1 for fresh snow samples collected at Neumayer Station during 1981–2006 (Schlosser et al., 2004).
Different results emerge from the δ18O/Tinv
relation-ship (Table 2), which leads to weaker correlation coef-ficients (R2=0.44, n = 440) than for T2 m. The slope
of the linear regression between δ18O and Tinv data is
0.84 ± 0.05 ‰◦C−1, almost twice steeper than the one ob-tained with T2 m.
If we consider summer (defined as November–February) and winter (March–October) separately (Table 2), the re-lationship of δ18O and T2 m is clearly different in winter
and summer: we observe a slope of 0.59 ± 0.03 ‰◦C−1
(R2=0.44, n = 398) for δ18O/T2 m in winter compared
to 0.37 ± 0.07 ‰◦C−1 in summer (R2=0.25, n = 102). By contrast, summer and winter slopes are fairly sim-ilar for δ18O/Tinv, 0.59 ± 0.06 ‰◦C−1 for winter and
0.57 ± 0.11 ‰◦C−1for summer, though with a lower regres-sion coefficient (R2=0.22 and 0.23, n = 345 and 95, respec-tively).
When now considering monthly mean values (Table 2), correlation coefficients significantly increase, without any significant change in the regression slopes with respect to the results obtained from the daily data when considering the re-lationship with T2 m, but with a further increase of the slope
when considering Tinv.
The obtained results are summarized in Fig. 6 showing the δ18O/T2 mrelationship for both daily and monthly values as
well as the linear regressions considering summer or winter precipitation. This figure clearly suggests that the precipita-tion occurring at temperatures above −50◦C is characterized by a slightly lower δ/T slope.
We have also mimicked the record expected to be archived in ice cores, by considering annual precipitation-weighted T2 m and δ18O values (Table 3). Most of the
Table 3. Mean annual values for 2008, 2009 and 2010 of 2 m temperature and δ18O, considering the whole dataset (a and d column, respectively), a subset of data considering days when precipitation was quantified (b and e, respectively) and the whole dataset weighted by the precipitation amount (c and f, respectively).
a b c d e f
Year T2 msimple T2 mannual T2 mannual δ18O simple δ18O annual δ18O annual
annual average average based average weighed annual average average based average weighed (◦C) on precipitated by precipitation (‰) on precipitated by precipitation days (◦C) (◦C) days (‰) (‰) 2008 −51.69 −56.81 −53.54 −55.26 −55.52 −52.70 2009 −49.88 −55.63 −54.03 −55.47 −55.86 −53.20 2010 −52.88 −53.29 −47.78 −60.16 −57.78 −53.73
Table 4. δ18O–T (T2 m and Tinv)and d–δ18O regressions for daily and monthly precipitation at Concordia, over the period 2008–2010 considering different precipitation types (snowfall, diamond dust and hoar frost).
Variables Slope Intercept R2 N Sampling
(Y /X) sample (period)
δ18O/T2 m Snowfall 0.45 ± 0.04 −31.21 ± 2.11 0.60 98 Daily (all samples)
Hoar frost 0.48 ± 0.04 −29.84 ± 2.69 0.44 159 Diamond dust 0.47 ± 0.03 −31.76 ± 1.41 0.71 105
δ18O/TINV Snowfall 0.91 ± 0.08 −21.89 ± 3.00 0.60 88 Daily (all samples)
Hoar frost 0.49 ± 0.08 −40.26 ± 3.32 0.21 133 Diamond dust 0.83 ± 0.08 −23.35 ± 2.74 0.55 99
d/δ18O Snowfall −1.20 ± 0.10 −52.91 ± 5.56 0.60 98 Daily (all samples) Hoar frost −1.32 ± 0.08 −57.63 ± 4.67 0.65 158
Diamond dust −1.66 ± 0.13 −76.85 ± 7.04 0.61 105
δ18O/T2 m Snowfall 0.41 ± 0.03 −34.58 ± 1.69 0.86 29 Monthly (all samples)
Hoar frost 0.51 ± 0.06 −28.68 ± 3.38 0.77 25 Diamond dust 0.41 ± 0.04 −34.67 ± 1.84 0.84 28
δ18O/TINV Snowfall 1.10 ± 0.10 −15.13 ± 3.46 0.84 29 Monthly (all samples)
Hoar frost 1.34 ± 0.15 −6.83 ± 5.66 0.78 25 Diamond dust 1.10 ± 0.11 −15.14 ± 3.96 0.80 28
d/δ18O Snowfall −1.30 ± 0.208 −57.91 ± 10.842 0.63 29 Monthly (all samples) Hoar frost −0.92 ± 0.16 −37.19 ± 9.74 0.60 25
Diamond dust −1.38 ± 0.20 −62.57 ± 11.08 0.65 28
f) are higher than the un-weighted annual averages (column b and e) because precipitation events are generally associated with warmer than average conditions. The difference be-tween weighted and un-weighted isotopic and temperature values is greater during 2010, which is also the coldest year in the study period. When considering the linear regression between mean monthly weighted T2 m and δ18O data (not
shown), we obtain similar correlation coefficients and slopes. Again, the uncertainty associated with the sampling of indi-vidual precipitation events, and therefore their weight, does not allow further investigation.
When considering inter-annual variations, we obtain a high δ18O/T2 m slope (1.4 ± 1.1 ‰◦C−1) for values
calcu-lated from the whole dataset, as well as negative slopes for
precipitation weighted values. However, their significance is very low due to the calculation limited to a 3-year period. A further calculation that can be made in order to get rid of the mean seasonal cycle, which is dominating the statis-tical analysis, is to consider the mean monthly anomalies of temperature and δ18O for the study period. This leads to a higher δ18O/T2 m slope of 0.96 ‰◦C−1 (R2=0.68) when
compared to the one obtained from the mean monthly val-ues (0.42 ‰◦C−1). However, in this case its significance can also be questioned due to the short period considered here.
The classification of each sample into snowfall, diamond dust and hoar frost allowed us to investigate the relation-ship between the δ18O and temperature for the different snow types (Tables 4 and 5). This investigation does not allow any
Figure 6. δ18O values, measured on daily collected samples, with respect to daily average 2 m air temperatures (orange filled circles). Dark red filled squares and error bars represent their monthly av-erage and standard deviation respectively. Linear regression fits of daily (Y = −30.79 + 0.49 · X, R2=0.63, N = 500) and monthly (Y = −33.94+0.42·X, R2=0.82, N = 33) data are shown by yel-low and red thick dashed lines, respectively. Daily linear regres-sion using only November–February (NDJF, Y = −35.33 + 0.37 · X, R2=0.25, N = 102) and March–October (MAMJJASO, Y = −24.97 + 0.59 · X, R2=0.44, N = 398) are highlighted by green and light blue thick dashed lines, respectively. Black thin line rep-resents the one-to-one line.
Table 5. Mean, minimum and maximum isotopic values (δD, δ18O, deuterium excess) for the different precipitation types over the con-sidered 3-year period.
Isotopic values Snowfall Diamond dust Hoar frost
δD Mean −431.9 −411.5 −453.5 Min −530.2 −542.9 −574.1 Max −284.0 −297.2 −328.7 δ18O Mean −55.70 −52.79 −59.26 Min −70.69 −73.80 −79.11 Max −37.32 −36.27 −41.04
Deuterium excess Mean 13.7 10.8 20.6
Min −16.5 −49.6 −7.5
Max 37.3 47.7 58.8
significant difference in the slopes between δ18O and T2 m
or δ18O and Tinv to be identified within the different
cate-gories, with the exception of hoar frost, which shows similar slope values for both T2 mand Tinv. This is probably related to
the fact that the hoar events mainly occur during wintertime when the atmosphere is stably stratified and the T2 m
variabil-ity is more limited and similar to the one at inversion height. Moreover, while diamond dust and snowfall show fairly sim-ilar isotopic compositions (Table 5), our data depict a specific isotopic fingerprint of hoar frost through more depleted δ18O and δD and higher deuterium excess than for the other two types of precipitation.
Finally, we investigate the linear correlation between δ18O and T2 m in the LMDZiso model, which demonstrates most
of the precipitation events and their isotopic signature being captured quite well. The LMDZiso model underestimates the strength of the linear correlation between δ18O and T2 m, but
with a slope close to that observed (slope of 0.46 ‰◦C−1, R2=0.25 for daily data).
4 Discussion and conclusions
We provide the longest record of daily precipitation amounts and isotopic composition inferred from direct precipitation sampling from the central East Antarctic plateau, together with an analysis of precipitation types (diamond dust, snow-fall, hoar frost) based on crystal typologies. This, for the first time, enabled us to study the relationship between local me-teorological data and precipitation isotopic composition at intra-annual to inter-annual scale for the different types of precipitation. We observe a strong relationship between δ18O (δD, not shown) and T2 m or Tinv at intra-seasonal to
inter-annual scales (Table 2). No noticeable differences are found in the slopes when considering daily samples or monthly val-ues. Slopes of the δ18O/T relationship are systematically twice higher for Tinvthan for T2 m, albeit with reduced
corre-lation coefficients for inversion temperature.
Our results show an antiphase between deuterium ex-cess and δ18O, confirming earlier results from surface snow data (Masson-Delmotte et al., 2008) and the 1-year Dome Fuji precipitation dataset (Fujita and Abe, 2006). Touzeau et al. (2016) reinforce the view, already suggested by Uemura et al. (2012), that the main control on the precipitation deu-terium excess in the coldest parts of inland Antarctica, at the very end of the distillation pathways, is indeed the site tem-perature. Deviations from such an antiphase between deu-terium excess and δ18O, as observed in Antarctic coastal ar-eas, are expected to reflect changes in moisture source char-acteristics. We note that the LMDZiso model does capture this antiphase at Concordia, but underestimates its strength, possibly due to the model warm bias.
Different precipitation types are expected to reflect differ-ent final condensation processes. Hoar frost represdiffer-ents in-verse sublimation (deposition) of water vapour close to the snow surface, whereas snowfall and diamond dust form at height in the boundary layer. We identify an isotopic fin-gerprint of hoar frost through depleted δ18O and δD and higher deuterium excess. However, we cannot rule out that part of this depletion could be related to the fact that hoar frost mainly occurs during the coldest months. Based on the available data alone, it cannot be assessed whether this de-pletion arises from lower condensation temperatures during hoar frost events or from condensation of an initially more depleted vapour. Both the combined monitoring of vapour and precipitation isotopic composition at Concordia and an
exact determination of the moisture sources for diamond dust is needed to understand the processes at play.
This new Concordia dataset can now be used to evalu-ate isotopic-enhanced atmospheric general circulation mod-els. The comparison of our precipitation amount data with the ECMWF ERA Interim reanalysis shows good skills of the model. Moreover, the capacity of the LMDZiso model to capture some of the observed δ18O variance despite a warm bias and low resolution is encouraging. Our new dataset can be used for the evaluation of the model water cycle, for in-stance by investigating the sensitivity of model performance to spatial resolution or to different parameterizations.
The 3-year monitoring of water stable isotopes of daily precipitation at Concordia Station allowed a δ18O/T2 mslope
of 0.49 ‰◦C−1to be derived, which is lower than the spatial slope of 0.8 ‰◦C−1obtained by the surface snow isotopic composition in Antarctica (Masson-Delmotte et al., 2008). This lower slope is also displayed in the LMDZiso simula-tion, suggesting that this model may capture the distillation processes correctly, despite its systematic biases. The weaker sensitivity of δ18O to temperature presented here suggests that the use of the spatial slope for temperature reconstruc-tions in ice cores may lead to an underestimation of actual past temperature changes.
Our approach should be further expanded using observa-tional atmospheric data, including vertical profiles of humid-ity and air temperature as well as the vertical distribution of ice particles, in order to better define the temporal variability of the height of the condensation level. Furthermore, long-term (multi-decadal) monitoring is required to investigate the relationship between large-scale patterns of the atmo-spheric circulation and the corresponding changes in mois-ture sources and transport paths and precipitation isotopic composition. Such monitoring will also provide a key ref-erence for investigating post-depositional processes, which can alter the isotopic composition of surface snow. Recent studies performed in summer in Greenland and Antarctica have highlighted parallel shifts in surface vapour and surface snow isotopic composition in between snowfall events, pos-sibly due to the uptake of surface vapour signals during snow metamorphism (Steen-Larsen et al., 2014; Ritter et al., 2016). Moreover, Touzeau et al. (2016) analysed the17O excess of a subset of the 2010 precipitation samples from Concordia, as well as surface snow samples and snow pits at Dome C and Vostok. They suggested that the isotope–temperature slope was even lower in surface snow samples than in precipita-tion samples. Again, this points to significant interacprecipita-tions of atmospheric water vapour and surface snow leading to post-depositional effects, potentially important in such arid regions of inland Antarctica. The continuous monitoring of the isotopic composition of precipitation and water vapour as well as surface snow will be instrumental to investigate potential distortions in subsequent firn isotopic profiles.
5 Data availability
Two-meter temperature data sampled by DCII US AWS are available at http://amrc.ssec.wisc.edu. Radiosounding data sampled at Concordia Station can be requested at http:// www.climantartide.it. Snow stakes accumulation record can be freely downloaded at http://www-lgge.obs.ujf-grenoble. fr/ServiceObs/index.htm. The data from this study are avail-able in the Supplement.
Author contributions. Barbara Stenni, Giuliano Dreossi and Mattia Bonazza are responsible for the precipitation measurements and sta-ble isotope analysis, Mauro Valt and Anselmo Cagnati for the crys-tal analysis, Claudio Scarchilli, Virginia Ciardini and Paolo Grigioni for the meteorological and ECMWF model data and Camille Risi for the LMDZ model data. Daniele Karlicek collected the sam-ples in the field. Barbara Stenni, Claudio Scarchilli, Virginia Cia-rdini, Valerie Masson-Delmotte and Elisabeth Schlosser prepared the manuscript. All the authors contributed to the data interpreta-tion.
Acknowledgements. The precipitation measurements at Dome C as well as the isotopic analysis have been conducted in the framework of the Concordia Station glaciology and ESF PolarCLIMATE HOLOCLIP projects funded in Italy by PNRA-MIUR. This is a HOLOCIP publication number 28. Calculations, model comparison and analysis have been conducted in the framework of the MALOX and PRE-REC projects, funded by PNRA-MIUR. We appreciate the support of the University of Wisconsin-Madison Automatic Weather Station Program with the Dome C II dataset (NSF grant numbers ANT-0944018 and ANT-12456663) and the support of the IPEV/PNRA Project “Routine Meteorological Observation at Station Concordia”, www.climantartide.it with the radiosounding data set. We thank all people who were involved in the precipitation sampling in the field, and Daniele Frosini and Laura Genoni for the 2008 and 2009 sampling collection, respectively.
Edited by: M. van den Broeke Reviewed by: two anonymous referees
References
Bromwich, D. H., Guo, Z., Bai, L., and Chen, Q.: Modelled Antarc-tic precipitation. Part I: spatial and temporal variability, J. Cli-mate, 17, 427–447, 2004.
Casado, M., Landais, A., Masson-Delmotte, V., Genthon, C., Ker-stel, E., Kassi, S., Arnaud, L., Picard, G., Prie, F., Cattani, O., Steen-Larsen, H.-C., Vignon, E., and Cermak, P.: Continuous measurements of isotopic composition of water vapour on the East Antarctic Plateau, Atmos. Chem. Phys., 16, 8521–8538, doi:10.5194/acp-16-8521-2016, 2016.
Dansgaard, W.: Stable isotopes in precipitation, Tellus, 16, 436– 468, 1964.
Delmotte, M., Masson, V., Jouzel, J., and Morgan, V.: A seasonal deuterium excess signal at Law Dome, coastal eastern Antarc-tica: A Southern Ocean signature, J. Geophys. Res., 105, 7187– 7197, 2000.
Ekaykin, A. A., Lipenkov, V. Y., Kuzmina, I. N., Petit, J. R., Masson-Delmotte, V., and Johnsen, S. J.: The changes in isotope composition and accumulation of snow at Vostok Station, East Antarctica, over the past 200 years, Ann, Glaciol., 39, 569–575, 2004.
Fernandoy, F., Meyer, H., Oerter, H., Wilhelms, F., Graf, W., and Schwander, J.: Temporal and spatial variation of stable-isotope ratios and accumulation rates in the hinterland of Neumayer Sta-tion, East Antarctica, J. Glaciol., 56, 673–687, 2010.
Fernandoy, F., Meyer, H., and Tonelli, M.: Stable water isotopes of precipitation and firn cores from the northern Antarctic Peninsula region as a proxy for climate reconstruction, The Cryosphere, 6, 313–330, doi:10.5194/tc-6-313-2012, 2012.
Fischer, H., Severinghaus, J., Brook, E., Wolff, E., Albert, M., Ale-many, O., Arthern, R., Bentley, C., Blankenship, D., Chappellaz, J., Creyts, T., Dahl-Jensen, D., Dinn, M., Frezzotti, M., Fujita, S., Gallee, H., Hindmarsh, R., Hudspeth, D., Jugie, G., Kawamura, K., Lipenkov, V., Miller, H., Mulvaney, R., Parrenin, F., Pattyn, F., Ritz, C., Schwander, J., Steinhage, D., van Ommen, T., and Wilhelms, F.: Where to find 1.5 million yr old ice for the IPICS “Oldest-Ice” ice core, Clim. Past, 9, 2489–2505, doi:10.5194/cp-9-2489-2013, 2013.
Flato, G., Marotzke, J., Abiodun, B., Braconnot, P., Chou, S.C., Collins, W., Cox, P., Driouech, F., Emori, S., Eyring, V., For-est, C., Gleckler, P., Guilyardi, E., Jakob, C., Kattsov, V., Reason C., and Rummukainen, M.: Evaluation of Climate Models, in: Climate Change 2013: The Physical Science Basis. Contribution of Working Group I to the Fifth Assessment Report of the Inter-governmental Panel on Climate Change, edited by: Stocker, T. F., Qin, D., Plattner, G.-K., Tignor, M., Allen, S. K., Boschung, J., Nauels, A., Xia, Y., Bex, V., and Midgley, P. M., Cambridge University Press, Cambridge, United Kingdom and New York, NY, USA, 2013.
Frezzotti, M., Pourchet, M., Flora, O., Gandolfi, S., Gay, M., Urbini, S., Vincent, C., Becagli, S., Gragnani, R., Proposito, M., Severi, M., Traversi, R., Udisti, R., and Fily, M.: Spatial and temporal variability of snow accumulation in East Antarctica from traverse data, J. Glaciol., 51, 113–124, 2005.
Frieler, K., Clark, P. U., He, F., Buizert, C., Reese, R., Ligten-berg, S. R. M., van den Broeke, M. R., Winkelmann, R., and Levermann, A.: Consistent evidence of increasing Antarctic ac-cumulation with warming, Nature Climate Change, 5, 348–352, doi:10.1038/nclimate2574, 2015.
Fujita, K. and Abe, O.: Stable isotopes in daily precipitation at Dome Fuji, East Antarctica, Geophys. Res. Lett., 33, L18503, doi:10.1029/2006GL026936, 2006.
Genthon C., Town, M. S., Six, D., Favier, V., Argentini, S., and Pellegrini, A.: Meteorological atmospheric bound-ary layer measurements and ECMWF analyses during sum-mer at Dome C, Antarctica, J. Geophys. Res., 115, D05104, doi:10.1029/2009JD012741, 2010.
Genthon, C., Six, D., Gallée, H., Grigioni, P., and Pellegrini A.: Two years of atmospheric boundary layer observations on a 45-m tower at Do45-me C on the Antarctic plateau, J. Geophys. Res.-Atmos., 118, 3218–3232, doi:10.1002/jgrd.50128, 2013.
Genthon, C., Six, D., Scarchilli, C., Ciardini V., and Frezzotti, M.: Meteorological and snow accumulation gradients across Dome C, East Antarctic plateau, Int. J. Climatol., 36, 455–466, doi:10.1002/joc.4362, 2015.
Hourdin, F., Musat, I., Bony, S., Braconnot, P., Codron, F., Dufresne, J.-L., Fairhead, L., Filiberti, M.-A., Friedlingstein, P., Grandpeix, J.-Y., Krinner, G., Levan, P., Li, Z.-X., and Lott, F.: The LMDZ4 general circulation model: climate performance and sensitivity to parametrized physics with emphasis on tropical convection, Clim. Dynam., 27, 787–813, 2006.
Jouzel, J.: Water stable isotopes: Atmospheric composition and ap-plications in polar ice core studies, in: Treatise on Geochemistry, 2nd Edn., Vol. 5, The Atmosphere, edited by: Keeling, R. and Russel, L., Elsevier, 213–256, doi:10.1016/B978-0-08-095975-7.00408-3, 2014.
Jouzel, J. and Masson-Delmotte, V.: Paleoclimates: what do we learn from deep ice cores?, Wiley Interdisciplinary Reviews-Climate Change, 1, 654–669, 2010.
Jouzel, J. and Merlivat, L.: Deuterium and oxygen 18 in precipita-tion: modelling of the isotopic effects during snow formation, J. Geophys. Res., 89, 11749–11757, 1984.
Jouzel, J., Vimeux, F., Caillon, N., Delaygue, G., Hoff-mann, G., Masson-Delmotte, V., and Parrenin, F.: Mag-nitude of isotope/temperature scaling for interpretation of central Antarctic ice cores, J. Geophys. Res., 108, 4361, doi:10.1029/2002JD002677, 2003.
Jouzel, J., Masson-Delmotte, V., Cattani, O., Dreyfus, G., Falourd, S., Hoffmann, G., Minster, B., Nouet, J., Barnola, J. M., Chap-pellaz, J., Fischer, H., Gallet, J. C., Johnsen, S., Leuenberger, M., Loulergue, L., Luethi, D., Oerter, H., Parrenin, F., Raisbeck, G., Raynaud, D., Schilt, A., Schwander, J., Selmo, E., Souchez, R., Spahni, R., Stauffer, B., Steffensen, J. P., Stenni, B. S., Tison, J. L., Werner, M., and Wolff, E.: Orbital and millennial Antarc-tic climate variability over the past 800,000 years, Science, 317, 793–796, doi:10.1126/science.1141038, 2007.
Kahl, J. D.: Characteristics of the low-level temperature inversion along the Alaskan Arctic coast, Int. J. Climatol., 10, 537–548, 1990.
Magono, C. and Lee, C. W.: Meteorological Classification of Nat-ural Snow Crystals, Journal of the Faculty of Science, Hokkaido University, Series 7, Geophysics, 2, 321–335, 1966.
Masson-Delmotte, V., Hou, S., Ekaykin, A., Jouzel, J., Aristarain, A., Bernardo, R. T., Bromwich, D., Cattani, O., Delmotte, M., Falourd, S., Frezzotti, M., Gallée, H., Genoni, L., Isaksson, E., Landais, A., Helsen, M. M., Hoffmann, G., Lopez, J., Morgan, V., Motoyama, H., Noone, D., Oerter, H., Petit, J.R., Royer, A., Uemura, R., Schmidt, G. A., Schlosser, E., Simões, J. C., Steig, E., Stenni, B., Stievenard, M., van den Broeke, M. R., van de Wal, R. S. W., van de Berg, W. J., Vimeux, F., and White, J. W. C.: A review of Antarctic surface snow isotopic composition: observations, atmospheric circulation and isotopic modelling, J. Climate, 21, 3359–3387, doi:10.1175/2007JCLI2139.1, 2008. Masson-Delmotte, V., Buiron, D., Ekaykin, A., Frezzotti, M.,
Gal-lée, H., Jouzel, J., Krinner, G., Landais, A., Motoyama, H., Oerter, H., Pol, K., Pollard, D., Ritz, C., Schlosser, E., Sime, L. C., Sodemann, H., Stenni, B., Uemura, R., and Vimeux, F.: A comparison of the present and last interglacial periods in six Antarctic ice cores, Clim. Past, 7, 397–423, doi:10.5194/cp-7-397-2011, 2011.
Motoyama, H., Hirasawa, N., Satow, K., and Watanabe, O.: Sea-sonal variations in oxygen isotope ratios of daily collected pre-cipitation and wind drift samples and in the final snow cover at Dome Fuji Station, Antarctica, J. Geophys. Res., 110, D11106, doi:10.1029/2004JD004953, 2005.
Parrenin, F., Fujita, S., Abe-Ouchi, A., Kawamura, K., Masson-Delmotte, V., Motoyama, H., Saito, F., Severi, M., Stenni, B., Uemura, R., and Wolff, E.: Climate dependent contrast in surface mass balance in East Antarctica over the past 216 ka, J. Glaciol., 36, 455–466, doi:10.1017/jog.2016.85, 2016.
Peel, D. A., Mulvaney, R., and Davison, B. M.: Stable-Isotope/Air-Temperature relationship in ice cores from Dolleman Island and the Palmer Land Plateau, Antarctic Peninsula, Ann. Glaciol., 10, 130–136, 1988.
Pietroni, M., Argentini, S., and Petenko, I.: One Year of Surface– Based Temperature Inversions at Dome C, Antarctica, Bound.-Lay. Meteorol., 150, 131–151, doi:10.1007/s10546-013-9861-7, 2014.
Risi, C., Bony, S., Vimeux, F., and Jouzel, J.: Water-stable isotopes in the LMDZ4 general circulation model: Model evaluation for present-day and past climates and applications to climatic in-terpretations of tropical isotopic records, J. Geophys. Res., 115, D12118, doi:10.1029/2009JD013255, 2010.
Risi, C., Landais, A., Winkler, R., and Vimeux, F.: Can we deter-mine what controls the spatio-temporal distribution of d-excess and17O-excess in precipitation using the LMDZ general circula-tion model?, Clim. Past, 9, 2173–2193, doi:10.5194/cp-9-2173-2013, 2013.
Ritter, F., Steen-Larsen, H. C., Werner, M., Masson-Delmotte, V., Orsi, A., Behrens, M., Birnbaum, G., Freitag, J., Risi, C., and Kipfstuhl, S.: Isotopic exchange on the diurnal scale be-tween near-surface snow and lower atmospheric water vapor at Kohnen station, East Antarctica, The Cryosphere, 10, 1647– 1663, doi:10.5194/tc-10-1647-2016, 2016.
Schlosser, E., Reijmer, C., Oerter, H., and Graf, W.: The influence of origin of precipitation on the δ18O-T relationship at Neumayer Station, Ekströmisen, Antarctica, Ann. Glaciol., 39, 41–48, 2004. Schlosser, E., Oerter, H., Masson-Delmotte, V., and Reijmer, C.: Atmospheric influence on the deuterium excess signal in polar firn: implications for ice-core interpretation, J. Glaciol., 54, 117– 124, 2008.
Schlosser, E., Stenni, B., Valt, M., Cagnati, A., Powers, J. G., Man-ning, K. W., Raphael, M., and Duda, M. G.: Precipitation and synoptic regime in two extreme years 2009 and 2010 at Dome C, Antarctica – implications for ice core interpretation, Atmos. Chem. Phys., 16, 4757–4770, doi:10.5194/acp-16-4757-2016, 2016.
Schmidt, G. A., Legrande, A. N., and Hoffmann, G.: Water iso-tope expressions of intrinsic and forced variability in a cou-pled ocean-atmosphere model, J. Geophys. Res., 112, D10103, doi:10/1029/2006JD007781, 2007.
Sime, L. C., Tindall, J. C., Wolff, E. W., Connolley, W. M., and Valdes, P. J.: Antarctic isotopic thermometer during a CO2 forced warming event, J. Geophys. Res., 113, D24119,
doi:10.1029/2008JD010395, 2008.
Steen-Larsen, H. C., Masson-Delmotte, V., Hirabayashi, M., Win-kler, R., Satow, K., Prié, F., Bayou, N., Brun, E., Cuffey, K. M., Dahl-Jensen, D., Dumont, M., Guillevic, M., Kipfstuhl, S., Landais, A., Popp, T., Risi, C., Steffen, K., Stenni, B., and
Sveinbjörnsdottír, A. E.: What controls the isotopic compo-sition of Greenland surface snow?, Clim. Past, 10, 377–392, doi:10.5194/cp-10-377-2014, 2014.
Stenni, B., Masson-Delmotte, V., Johnsen, S., Jouzel, J., Longinelli, A., Monnin, E., Röthlisberger, R., and Selmo, E.: An oceanic cold reversal during the last deglaciation, Science, 293, 2074– 2077, 2001.
Thomas, E. R., Dennis, P. F., Bracegirdle, T. J., and Franzke, C.: Ice core evidence for significant 100-year regional warming on the Antarctic Peninsula, Geophys. Res. Lett., 36, L20704, doi:10.1029/2009GL040104, 2009.
Touzeau, A., Landais, A., Stenni, B., Uemura, R., Fukui, K., Fu-jita, S., Guilbaud, S., Ekaykin, A., Casado, M., Barkan, E., Luz, B., Magand, O., Teste, G., Le Meur, E., Baroni, M., Savarino, J., Bourgeois, I., and Risi, C.: Acquisition of isotopic composition for surface snow in East Antarctica and the links to climatic pa-rameters, The Cryosphere, 10, 837–852, doi:10.5194/tc-10-837-2016, 2016.
Uemura, R., Matsui, Y., Yoshimura, K., Motoyama, H., and Yoshida, N.: Evidence of deuterium excess in water vapour as an indicator of ocean surface conditions, J. Geophys. Res., 113, D19114, doi:10.1029/2008JD010209, 2008.
Uemura, R., Masson-Delmotte, V., Jouzel, J., Landais, A., Mo-toyama, H., and Stenni, B.: Ranges of moisture-source tem-perature estimated from Antarctic ice cores stable isotope records over glacial-interglacial cycles, Clim. Past, 8, 1109– 1125, doi:10.5194/cp-8-1109-2012, 2012.
Urbini, S., Frezzotti, M., Gandolfi, S., Vincent, C., Scarchilli, C., Vittuari, L., and Fily, M.: Historical behaviour of Dome C and Talos Dome (East Antarctica) revealed by snow accumulation and ice velocity measurements, Global Planet. Change., 60, 576– 588, doi:10.1016/j.gloplacha.2007.08.002, 2008.
Van de Berg, W. J., van den Broeke, M. R., Reijmer, C. H., and van Meijgaard, E.: Reassessment of the Antarctic sur-face mass balance using calibrated output of a regional at-mospheric climate model, J. Geophys. Res., 111, D11104, doi:10.1029/2005JD006495, 2006.
Van Loon, H.: The half-yearly oscillation in middle and high south-ern latitudes and the coreless winter, J. Atmos. Sci., 24, 472–486, 1967.
van Ommen, T. D. and Morgan, V. I.: Calibrating the ice core pa-leothermometer using seasonality, J. Geophys. Res., 102, 9351– 9357, 1997.
Vimeux, F., Cuffey, K. M., and Jouzel, J.: New insights into South-ern Hemisphere temperature changes from Vostok ice cores us-ing deuterium excess correction, Earth Planet. Sc. Lett., 203, 829–843, 2002.
WAIS Divide Project Members: Precise interpolar phasing of abrupt climate change during the last ice age, Nature, 520, 661–665, doi:10.1038/nature14401, 2015.
Walden, V. P., Warren, S. G., and Tuttle, E.: Atmospheric Ice Crystals over the Antarctic Plateau in Winter, J. Appl. Meteorol., 42, 1391–1405, doi:10.1175/1520-0450(2003)042<1391:AICOTA>2.0.CO;2, 2003.
Werner, M., Langebroek, P. M., Carlsen, T., Herold, M., and Lohmann, G.: Stable water isotopes in the ECHAM5 gen-eral circulation model: Toward high-resolution isotope mod-eling on a global scale, J. Geophys. Res., 116, D15109, doi:10.1029/2011JD015681, 2011.


![[PDF] Cours sur les fonctions en C++ | Cours informatique](data:image/gif;base64,R0lGODlhAQABAIAAAP///wAAACH5BAEAAAAALAAAAAABAAEAAAICRAEAOw==)