HAL Id: hal-03097439
https://hal.archives-ouvertes.fr/hal-03097439
Submitted on 5 Jan 2021
HAL is a multi-disciplinary open access
archive for the deposit and dissemination of
sci-entific research documents, whether they are
pub-lished or not. The documents may come from
teaching and research institutions in France or
abroad, or from public or private research centers.
L’archive ouverte pluridisciplinaire HAL, est
destinée au dépôt et à la diffusion de documents
scientifiques de niveau recherche, publiés ou non,
émanant des établissements d’enseignement et de
recherche français ou étrangers, des laboratoires
publics ou privés.
Nitrogen Fixation in Denitrified Marine Waters
Camila I. Fernandez, Laura Farías, Osvaldo Ulloa
To cite this version:
Camila I. Fernandez, Laura Farías, Osvaldo Ulloa. Nitrogen Fixation in Denitrified Marine Waters.
PLoS ONE, Public Library of Science, 2011, 6 (6), pp.e20539. �10.1371/journal.pone.0020539�.
�hal-03097439�
Nitrogen Fixation in Denitrified Marine Waters
Camila Fernandez1,2*, Laura Farı´as1, Osvaldo Ulloa1
1 Departamento de Oceanografı´a and Centro de Investigacio´n Oceanogra´fica en el Pacı´fico Sur-Oriental (COPAS), Universidad de Concepcio´n, Concepcio´n, Chile, 2 UPMC Universite´ Paris 06 and CNRS, UMR 7621, LOMIC, Observatoire Oce´anologique, Banyuls/mer, France
Abstract
Nitrogen fixation is an essential process that biologically transforms atmospheric dinitrogen gas to ammonia, therefore compensating for nitrogen losses occurring via denitrification and anammox. Currently, inputs and losses of nitrogen to the ocean resulting from these processes are thought to be spatially separated: nitrogen fixation takes place primarily in open ocean environments (mainly through diazotrophic cyanobacteria), whereas nitrogen losses occur in oxygen-depleted intermediate waters and sediments (mostly via denitrifying and anammox bacteria). Here we report on rates of nitrogen fixation obtained during two oceanographic cruises in 2005 and 2007 in the eastern tropical South Pacific (ETSP), a region characterized by the presence of coastal upwelling and a major permanent oxygen minimum zone (OMZ). Our results show significant rates of nitrogen fixation in the water column; however, integrated rates from the surface down to 120 m varied by ,30 fold between cruises (7.564.6 versus 190682.3mmol m22d21). Moreover, rates were measured down to 400 m depth in 2007, indicating that the contribution to the integrated rates of the subsurface oxygen-deficient layer was ,5 times higher (5746294mmol m22d21) than the oxic euphotic layer (48668mmol m22d21). Concurrent molecular measurements detected the dinitrogenase reductase gene nifH in surface and subsurface waters. Phylogenetic analysis of the nifH sequences showed the presence of a diverse diazotrophic community at the time of the highest measured nitrogen fixation rates. Our results thus demonstrate the occurrence of nitrogen fixation in nutrient-rich coastal upwelling systems and, importantly, within the underlying OMZ. They also suggest that nitrogen fixation is a widespread process that can sporadically provide a supplementary source of fixed nitrogen in these regions.
Citation: Fernandez C, Farı´as L, Ulloa O (2011) Nitrogen Fixation in Denitrified Marine Waters. PLoS ONE 6(6): e20539. doi:10.1371/journal.pone.0020539 Editor: Jack Anthony Gilbert, Argonne National Laboratory, United States of America
Received December 21, 2010; Accepted May 4, 2011; Published June 7, 2011
Copyright: ß 2011 Fernandez et al. This is an open-access article distributed under the terms of the Creative Commons Attribution License, which permits unrestricted use, distribution, and reproduction in any medium, provided the original author and source are credited.
Funding: This study was supported by the Chilean National Commission for Scientific and Technological Research through FONDECYT grant 11060297 (CF) and FONDAP grant 1501007 (OU, LF). CF was supported by a postdoctoral fellowship from the Fundacio´n Andes and the COPAS Centre, Chile. Additional funding was provided by the Agouron Institute grant AI-MO3_06_1 to OU. Part of the present work was carried out under the auspices of the Danish Expedition Foundation (Dansk Ekspeditionsfond). The funders had no role in study design, data collection and analysis, decision to publish, or preparation of the manuscript. Competing Interests: The authors have declared that no competing interests exist.
* E-mail: [email protected]
Introduction
Fixed nitrogen is continuously being added to and removed from the ocean through processes mediated by microbial communities. Over large temporal and spatial scales, potential changes to the marine N inventory depend on the variability of biological nitrogen fixation and denitrification (the stepwise reduction of nitrate to N2; [1,2]) plus anammox (the anaerobic
ammonium oxidation with nitrite to N2[3,4]). The current view is
that these processes are spatially disconnected [5,6]. Marine nitrogen fixation, with a global rate of ,150 Tg N y21 [1], is thought to occur predominantly at the surface (and subsurface) of tropical oceans by the activity of diazotrophic phototrophs (such as the colonial cyanobacterium Trichodesmium [7]) and unicellular cyanobacteria [8,9]. It is also performed, to a lesser degree, by non-photosynthetic diazotrophic bacterioplankton [10,11]. In contrast, nitrogen losses, with global rates of ,200 Tg N y21 [1], are primarily the result of the activities of denitrifying and anammox bacteria [12]. Nitrogen losses occur mainly in sediments [13], anoxic basins [3,4] and oxygen minimum zones (OMZs) [14,15,16]. The main oceanic OMZs are located in the eastern tropical Pacific Ocean and the Arabian Sea.
Although it has been suggested that surface diazotrophic activity could be enhanced near areas with high rates of water-column denitrification [17] or even within oxygen-deficient waters [11],
direct evidence for this process within OMZ regions has been missing. In this study, we report on direct N2fixation rates and on
the molecular diversity of the nitrogenase reductase gene nifH for waters of the eastern tropical South Pacific (ETSP) off Peru and northern Chile. This region of the ETSP is the site of permanent wind-driven coastal upwelling and contains a persistent, large and intense oxygen minimum zone (OMZ) at intermediate depths (80– 400 m). It contributes a significant fraction of global marine nitrogen losses [15,18,19,20]. Our results come from two oceanographic cruises, one carried out in October 2005 (R/V Knorr) and the other in February 2007 (Galathea-3, R/V Vædderen). Measurements were taken at stations located between 1.5uN and 20uS and at depths ranging from the surface to 120 m in 2005 and to 400 m in 2007 (Fig. 1).
Results
Oceanographic conditions during both cruises showed active wind-driven coastal upwelling off northern Chile and Peru, as seen in the Sea Surface Temperature (SST) distribution (Fig. 1A, B). During Galathea-3 in 2007, SST values (17–24uC, Table 1) were higher than during the Knorr cruise in 2005 and bore the signature of the last phase of a moderately warm El Nin˜o-Southern Oscillation (ENSO) event [21]. On both occasions, the signal of subsurface nutrient-rich oxygen-deficient waters (mainly associated
with Equatorial Sub Surface Water (ESSW)), clearly appeared in the near surface waters as a result of the upwelling process. During both cruises, the vertical distribution of dissolved oxygen showed a sharp oxycline, with oxygen-deficient waters (in which nitrite starts accumulating to form a secondary nitrite maximum) reaching depths as shallow as 40 m (Fig. 2A and B). The oxygen-depleted zone extended from approximately 80 m to depths exceeding 400 m. During the 2007 cruise, essentially anoxic waters (,2 nmol L21O2) were measured at the core of the OMZ using
the ultra-sensitive STOX oxygen microsensor [22]. Concentra-tions of dissolved inorganic N (DIN; NO22, NO32 and NH4+)
during the 2005 and 2007 cruises were high. Average nitrate levels at the surface reached 7.865 (s.d.) and 5.563.8mmol L21for the Knorr and Galathea-3 cruises, respectively, while average ammonium values reached 0.0860.08 and 0.2360.3mmol L21. The secondary nitrite maximum extended approximately from the upper boundary of the oxygen deficient zone to depths exceeding 120 m during the Knorr cruise and to depths of 400 m during the
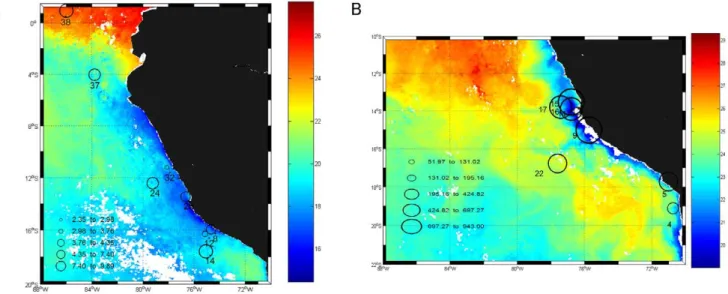
Figure 1. Location of the sampled stations and integrated N2fixation rates. A) Knorr cruise (October–November 2005) and B) Galathea-3 expedition (February 2007). Stations are superimposed on daily N2fixation rates (mmol m22d21) integrated over the water column (black circles). Colour scale represents Sea Surface Temperature (SSTuC).
doi:10.1371/journal.pone.0020539.g001
Table 1. Geographical location and hydrographic features of the stations visited during cruises Knorr and Galathea 3.
Cruise Station Longitude (6E) Latitude (6N) SSTa (6C) Surface NO32 (mmol L21 ) SurfaceN:
P ratio SurfaceP*b Surface r 15 N2 (nmol N L21 d21 ) Knorr 8/9 74.65 215.91 15.0 9.6 5.7 1.69 0.06 Knorr 12 75.61 216.28 15.9 10.3 7.4 0.67 0.03 Knorr 14 76.69 217.68 17.2 1.5 1.5 1.39 0.04 Knorr 20 76.99 213.3 15.3 7.4 3.8 1.4 0.27 Knorr 24 79.3 212.25 17.1 18.4 12.4 0.25 0.11 Knorr 32 78.16 210.99 16.3 12.9 7 1.02 0.03 Knorr 37/33 83.94 23.59 18.5 8.9 11.13 0.72 0.01 Knorr 38 86.94 1.5 25.3 0.9 1.6 0.5 0.15 Galathea3 9 75.75 215.5 21.1 10.9 11.55 20.1 0.23 Galathea3 5 71.03 218.5 23.9 4.1 4.2 0.23 0.05 Galathea3 4 70.76 220.6 22.1 1.4 2.3 0.55 0.55 Galathea3 14 76.43 214.39 17.7 10.7 13.05 0.1 n.d.c Galathea3 22 77.62 217.44 21.3 5 3.79 0.09 1.85 Galathea3 17 77.43 214.16 20.6 4.9 6.26 20.28 0.23 Galathea3 15 76.8 213.87 19.8 9.29 9.66 0.22 0.12 Galathea3 16 76.79 214.28 19.9 6.1 14.03 20.33 0.2 a
Sea Surface Temperature.
b
P* represents an index of excess phosphorous compared to inorganic nitrogen [17].
c
Not detected.
doi:10.1371/journal.pone.0020539.t001
Galathea cruise (Fig. 2A and B). Molar N:P nutrient ratios were generally below the canonical Redfield value of 16 in both surface waters (surface average was 6.364 versus 8.164.5 Table 1) and in deeper layers (average N:P was 8.364.9 for the Knorr and 11.964.4 for the Galathea cruises, respectively). Exceptions were observed at stations 24 and 38 for the Knorr cruise and stations 9, 14 and 16 for the Galathea-3 expedition (Table 1). Likewise, values of P* (an index of the excess of inorganic phosphorous relative to inorganic nitrogen [17]) for the water column reflected conditions of nitrogen deficiency (0.9960.7 and 0.5960.6 in 2005 and 2007, respectively) indicating the vertical advection of denitrified water towards the surface.
N2fixation occurred at a wide range of depths in both cruises
and was detected in surface oxic and subsurface suboxic waters (Fig. 3). During the Knorr cruise (2005), N2 fixation rates in
surface waters ranged between 0.01 and 0.27 nmol N L21d21 (average 0.08960.08 nmol N L21d21, n = 17). In the upper oxycline, rates were in the same range as the surface values and maximum N fixing activities reached 0.2 nmol N L21d21 (average 0.07560.07 nmol N L21 d21 n = 8). Within the upper OMZ (sampling was only carried out to 120 m depth during this cruise), rates decreased to an average of 0.04160.02 nmol N L21d21. During the Galathea-3 expedition in 2007, rates of N2
fixation were over an order of magnitude higher than rates found in the previous cruise. Rates obtained in surface waters reached up to 2.34 nmol N L21d21 (average 0.6660.7 nmol N L21d21; n = 10). An exceptionally high rate was detected at station 4 at 15 m depth (14 nmol N L21d21) and was coincident with high NH4+concentrations (0.7mmol L21). Rates in the upper oxycline
reached maximum values of 3.26 nmol N L21d21, with an average rate of 1.7161.03 nmol N L21 (n = 17). The deeper
sampling in 2007 allowed us to detect active nitrogen fixation within the core of the OMZ and at a maximum depth of 400 m; these measurements considerably extended the currently accepted vertical and geographical distribution of marine nitrogen fixation. To our knowledge, this is the deepest water column measurement of N2fixation to date. Rates obtained at the core of the OMZ were
as high as 3.5 nmol N L21d21, with an average value of 1.2761.2 nmol N L21d21(n = 13). Overall, comparisons of both data sets show that the N2 fixation rates measured during the
Galathea-3 cruise largely exceeded those measured in 2005, both in surface waters (0.0760.07 versus 0.3660.46 nmol N L21d21 (e.g., Fig. 2A and B) and for integrated values down to 120 m (from 7.564.6 to 190682.3mmol m22d21).
To assess the community composition and distribution of diazotrophs, we amplified DNA sequences for the nitrogenase reductase gene nifH, which encodes for the metal protein of the nitrogenase enzyme complex. Positive amplifications were ob-tained for all the stations in which15N2fixation experiments were
performed. Phylogenetic analyses of clone libraries obtained from selected stations in 2005 and 2007 (1125 valid nifH sequences) showed the existence of microorganisms with the genetic potential for N2fixation (Fig. 4) at different depths (see Table S1, Table S2,
Table S3, and Table S4). However, the diversity of the nifH genes for the 2005 cruise was very low compared to the diversity found in other marine systems [23,24], and was especially low compared to what we found in 2007 (6 versus 14 phylotypes with 95% similarity at the nucleotide basis, respectively). Our nifH sequences fell within three of the four known clusters for this gene [25]. Most of our clones fell within Cluster I, which includes a, b and c proteobacterial (as well as cyanobacterial) nitrogenases, and which has many marine representatives (Table S1, Table S2, Table S3,
Figure 2. Selected N2fixation profiles. Representative stations are plotted for cruises A) Knorr 2005 and B) Galathea-3 expedition 2007 carried out in Peruvian waters. Rates (nmol L21d21) are represented in red dots. Full lines represent continuous oxygen profiles obtained from the CTD (upper cast). Nitrite concentrations (black points, mmol L21) increase through the oxycline, forming the main secondary maximum at the core of the oxygen minimum zone. In this layer, N2O and NO32decrease, but a large amount of NO22accumulates.
doi:10.1371/journal.pone.0020539.g002
and Table S4). Importantly however, no sequences associated with cyanobacteria were found during our study, particularly within the euphotic zone. The rest of our sequences fell within Clusters II and III. These clusters include nitrogenases coming from the group Archaea, as well as diverse anaerobic microorganisms (such as the sulfate reducers chlorobiaceae and clostridia (Fig. 4)), but contain few marine representatives [26]. These molecular results thus suggest the presence of a diverse community of diazotrophs in the region during times of high N2fixation rates. These results also
indicate the need for further investigating the identity of the most important nitrogen fixers in these waters through, for example, in situ nitrogenase gene expression and stable-isotope probing studies, as well as culturing efforts.
Discussion
Biological N2fixation was detected during two cruises (2005 and
2007) off northern Chile and Peru using the15N isotopic technique [27]. Rates obtained during both cruises were in the range of previously reported N2 fixation (Table S5), although values
differed significantly (by an order of magnitude) between cruises. Phylogenetic diversity of the nifH sequences also varied greatly between cruises, in agreement with the biogeochemical rates of N2
fixation. Several aspects should be considered in the analysis of factors that govern this variability. First, hydrographic conditions differed between cruises: SST was higher during the Galathea-3 cruise than it was during the Knorr cruise, although we did not observe a clear correlation between the distribution of our N2
fixation rates and temperature. Second, significant differences
were observed in P* and N:P values (Student t-test values of p,0.05 in both cases, Table 1). However, the stoichiometry of the water column alone cannot account for the observed variability in our rates, as the data distributed over a vast range of P* values (see Fig. S1). Third, the vertical distribution of nitrogen fixation extended into the core of the OMZ, suggesting that this process might not respond solely to an excess of P compared to N in the surface waters of the ETSP [17] but that it could also be linked to varying levels of anoxia in the water column. Indeed our highest rates were obtained during the Galathea-3 expedition, when complete oxygen depletion was observed in the core of the OMZ. Unfortunately, we do not have STOX measurements for the 2005 cruise to compare the levels of oxygen-deficiency between cruises. Overall, our results suggest that N2 fixation acts as a transient
process in denitrified marine waters. This characteristic has already been observed for other diazotrophic communities, such as the well-known bloom-forming cyanobacterium Trichodesmium in the North Pacific Subtropical gyre [28].
The overall input and potential significance of the N fixation process can be evaluated by integrating N2 fixation rates
throughout the upper and the OMZ layers (see methods) and comparing them with the nitrogen losses. Daily integrated diazotrophic inputs from the surface to the 10-mmol O2L
21
level at the base of the oxycline reached 48668mmol N m22d21 in 2007. N2 fixation within suboxic waters (e.g., taken from the
deepest level of the 1-mmol L21isoline to the deepest level of the average profile — 400 m for Galathea-3 cruise) revealed a contribution of 5746294mmol N m22d21 of newly-fixed N coming from the OMZ. These integrated input rates correspond
Figure 3. Nitrogen fixation rates of cruises Knorr 2007 and Galathea-3 2007. The nitrogen fixation data gathered for northern Chile and Peruvian upwelling in 2005 (Knorr cruise, green circles) and 2007 (Galathea 3 expedition, red circles) is plotted against potential density from surface oxic layer to the core of the Oxygen Minimum Zone.
doi:10.1371/journal.pone.0020539.g003
to up to 5% of the N losses, which are estimated to be on average ,11 mmol m22
d21 in the Peruvian OMZ [20]. However, the high variability observed between cruises, as well as reports of a methodological underestimation of nitrogen fixation rates with the conventional application of the15N technique [29], suggest that higher and deeper N2fixation fluxes, than those reported here are
possible in the ETSP.
Some important aspects must be kept in mind when evaluating the potential of N2 fixation for offsetting N losses. First, while
denitrification and anammox should be spatially confined to subsurface oxygen-deficient waters, N2fixation is not. Our results
are consistent with the idea that nitrogen fixation is enhanced in the surface layer via vertically transported N-deficient waters [17], but they also show that this process is not confined to areas adjacent to upwelling centers. Instead, nitrogen fixation actively occurs in coastal upwelling waters and can extend to depths within the core of the OMZ, but with significant time variability. On the other hand, the occurrence of active sporadic N2fixation could locally increase
the N:P ratios of organic matter and could therefore affect the signature origin of DIN removed via denitrification. This possibility was suggested by the excess N2 data obtained during the 2005
Knorr cruise in the ETSP [30]. Complementary evidence also exists in the form of isotopic anomalies that differ from expectations for denitrification in OMZs [31,32,33]. For these cases, the re-mineralization of organic matter bearing the signature of nitrogen fixation has been suggested.
The marked difference between cruises in the diversity of nifH genes could indicate that high nitrogen fixation rates might not be the result of a single blooming diazotroph, but of a broader community. The distribution of our rates, which cover surface as well as subsurface and deep water with varying oxygen levels, also supports this idea. On the other hand, the fact that we found no nifH sequences associated with cyanobacteria in surface waters is consistent with previous surveys in the south-eastern border of the South Pacific gyre [34]. In those studies, extremely low abundances of group UCYN-A cyanobacteria were observed along with a total absence of large and group UCYN-B cyanobacterial diazotrophs. Also in agreement with our data, very low abundances of cyanobacterial nifH sequences were recently found at the redoxcline of the meromictic Lake Cadagnio, where other diazotrophs thrive [35]. In addition, a few of our sequences were grouped with microorganisms suspected to be reagent contaminants (e.g., b-proteobacteria [36,37]. Thus, studies that unambiguously link function with taxonomic identity are needed.
Finally, although the temporal and spatial resolution of our study is not fully representative of the range of variability of N2
fixation within OMZs and coastal surface waters (e.g., the Knorr cruise was carried out in late spring, while the Galathea expeditions covered the late summer season), our measurements reveal a dynamic process with high temporal variability. Our molecular data also suggest that a diverse diazotrophic community can develop at certain times in the Peruvian upwelling ecosystem, for which oxygen-deficient conditions as well as persistent N removal [15,20] may alleviate the inhibition of the nitrogenase enzymatic machinery by oxygen.
In summary, observations in the eastern tropical South Pacific demonstrate that significant diazotrophic activity occurs in oxic and subsurface denitrified waters, albeit with significant temporal variability. N2 fixation co-occurs with water column
denitrifica-tion, a feature that has been described for sediments [38,39]. Factors such as the level of oxygen-deficiency in the water column, hydrographic physical conditions (e.g., temperature) or nutrient ratios may be responsible for the observed variability between cruises. Further studies are needed to determine the transient nature of the phenomenon, the identity of the main diazotrophs, and whether nitrogen fixation occurs in other OMZ regions.
Materials and Methods
Data presented here were obtained during two different cruises, the KN182-9 cruise (R/V Knorr; October-November 2005) and the Galathea-3 expedition (R/V Vædderen; March 2007). Both cruises covered the ETSP and particularly the Peruvian upwelling and northern Chile area (1.5uN to 20uS). Core parameters (including nutrients and dissolved oxygen), as well as biogeochem-ical variables (natural C and N isotopic composition, POC/ PON, Chl-a, DNA), were determined at all stations during these cruises. All water samples were retrieved with 11-L Niskin bottles attached to a Conductivity-Temperature-Depth / rosette system (Seabird). For nutrient measurements, water was sampled with a 60 mL plastic syringe and filtered through a glass fiber filter (pore size 0.7mm) into high-density polypropylene scintillation vials that were immediately frozen at 220uC. Samples were stored until laboratory analysis using an AlpkemH autoanalyzer (Knorr 2005 Cruise) or a manual colorimetric technique (Galathea-3 cruise) according to standard protocols for ammonium [40] and nitrate, nitrite and phosphate determination [41].
15
N2Fixation Experiments
Measurements of N2 fixation were performed in both cruises
following the existing protocol for15N2trace addition experiments
[27]. Incubations for N2fixation were performed using 2-L tedlar
gas-tight bags. These were equipped with inox (2005 cruise) or Teflon (2007 cruise) caps that included a silicone septum though which trace additions of 15N2 (99 atom%; CAMPRO
SCIEN-TIFIC) were made with a gas-tight syringe at 2 mL gas L21 of seawater. In all cases, samples were directly retrieved from the Niskin bottles using gas-tight Tygon tubes, which prevented contact with atmospheric oxygen and also prevented air-bubbles from entering the sample bags. For incubations using tedlar bags, the volumes and weights of filled bags were recorded at the beginning and at the end of the incubation process and real volumes were used in rate calculations. Possible permeability of tedlar to oxygen was reduced with double-layered tedlar. As bags were incubated under water, permeability (if it existed) should have been significantly reduced [42] and should not have exceeded 2mmoles per liter of seawater per day. Since nitrogenase is oxygen sensitive [43], the effects of oxygen contamination should result in an underestimation (rather than an overestima-tion) of the true rate. Moreover, because all measurements were performed as15N2gas bubble injections, incomplete equilibration
Figure 4. Maximum-likelihood phylogenetic tree ofnifHpredicted amino acid sequences obtained in the Peru coastal upwelling. Sequences for representative clones ($95% identity at the nucleotide level) are given in bold (PU and GA indicate representative sequences for the Knorr and Galathea-3 cruises, respectively). Bootstrap support values ($50%) for 1000 replications are shown at nodes. The scale bar indicates the number of sequence substitutions per site. The archaean Methanosarcina barkeri was used as an outgroup. Accession numbers for published sequences used to construct the phylogenetic tree are given in parenthesis. Additional information is given as Table S1, Table S2, Table S3, and Table S4.
doi:10.1371/journal.pone.0020539.g004
of isotopic gas during a standard incubation period might result in underestimations of N2fixation rates [29]. Therefore, the actual
rates of N2 fixation in this study could be higher than those
reported.
In both cruises, incubations were performed on deck and lasted 24 h. Six deck incubators were maintained at sea surface temperature with light intensities ranging between 65 and 4% of incident light (Lee FiltersH). Samples coming from below the 4% light level (Knorr and Galathea-3 cruises) were incubated in the dark in a thermo-regulated bath (Johnson ControlH) or temper-ature-controlled incubator (VelpH) at in situ temperatures.
All incubations were terminated by gentle filtration onto 0.7mm glass fiber filters (GF/F precombusted at 450uC; 12 h) using a vacuum (,100 mm Hg) or a peristaltic pump. Filters were dried at 60uC for 24 h and stored at 40uC until laboratory analysis by mass spectrometry. Once in the laboratory, filters were wrapped in tin cups and packed into pellets before analysis by continuous-flow isotope ratio mass spectrometry (IRMS delta plus, Thermo FinniganH). Values given are a range of daily rates for all stations. Vertical profiles were separated in three distinct layers according to the potential density structure reported for the area [44] and corresponding to Subtropical Surface Water, Eastern South Pacific Intermediate Water and Equatorial Subsurface Water. Vertical integration was carried out by obtaining an average depth profile for each hydrographic layer (upper, oxycline and OMZ) and integrating within the specific depth range. Integrated values over each layer were then added to obtain an overall contribution of N through diazotrophy per cruise. The linear accumulation of
15
N in particulate organic matter was tested using samples (5 to 80 m depth) obtained in central Chile in 2008 (Fig. S2). Results obtained during a time-series experiment showed increasing %15N in all samples, while particulate nitrogen (PN) remained relatively constant.
Community composition of diazotrophs. During the cruises Knorr (2005) and Galathea-3 (2007), water samples were collected at all stations for molecular characterization of the diazotroph community. Samples (up to 10 L) were successively filtered onto 3.0-mm (Isopore) and 0.22-mm (Sterivex-GV) pore-size filters, which were immediately covered with 2 mL of EDTA buffer and stored in liquid nitrogen until DNA extraction in the laboratory. Samples of both size fractions (. and ,3mm) were independently amplified by nested-Polymerase Chain Reaction (nested-PCR) with nifH primers (see Supplementary Information). The resulting PCR products from selected stations were cloned and sequenced to characterize the nifH sequence diversity.
Isolation and purification of nucleic acids. Lysozyme (50 mg mL21) was added to the Sterivex filter and the filter unit incubated at 37uC for 45 min. Then, proteinase K (10 mg mL21
) and sodium dodecyl sulfate (SDS, 20%) were added, and the filter unit incubated at 50uC for 2 h. In the case of the Isopore filter, the procedure was similar but carried out in a 15-mL Falcon tube with 10% SDS. The lysates were then extracted once with phenol-chloroform-isoamyl alcohol (25:24:1; pH 8) and once with chloroform-isoamyl alcohol (24:1). The samples were precipitated with isopropanol and sodium acetate (3 mol L21, pH 5.2), and the pellets were washed with ethanol and then re-suspended with HPLC water. Nucleic acid extracts were stored at 220uC.
nifH PCR. To amplify nifH genes, a nested Polymerase Chain Reaction (nested-PCR) was performed. First, 1mL of a 20 ngmL21 of DNA was added to a PCR containing 16 PCR buffer (GoTaq, Promega), 2 mmol L21 MgCl2, 0.2 mmol L
21
deoxynucleoside triphosphates, 1mmol L21 of nifH4 (59-TTY TAY GGN AAR GGN GG-39 ), 1mmol L21nifH3 (59-ATR TTR
TTN GCN GCR TA-39) [45] primers and 0.5 U of Taq DNA polymerase (GoTaq, Promega). All of the reagents were prepared with Dnase- and Rnase-free water. Thermal cycling for the first PCR was performed as follows: 5 min at 94uC, 30 cycles of 1 min at 94uC, 1 min at 55uC, and 1 min at 72uC, followed by a final extension step of 10 min at 72uC. After that, the samples were purified with the E.Z.N.A. Cycle Pure Kit (Omega Bio-Tek). Under the same conditions, but using a different pair of degenerate primers (nifH1 and nifH2 [46]), an aliquot of 1mL of this purified PCR product was added to a nested PCR. For the nested PCR, the only difference was the annealing temperature, which in this case was 57uC. Subsequently, 50mL of each PCR reaction were purified with the E.Z.N.A. Cycle-Pure Kit (Omega Bio-Tek). In both PCRs, a total of six negative controls were run to preclude false positives. The purified PCR products were cloned using the pGEM-T Easy vector systems according to the manufacturer’s instructions (Promega). Sequencing was done by Macrogen Inc. (Korea).
Phylogenetic analysis. A total of 1125 valid sequences were obtained in this study, 437 for the Knorr cruise and 688 for the Galathea expedition (more detailed information is given in Table S1, Table S2, Table S3, and Table S4). Representative clones, one from each of the different phylogenetic groups identified based on $95% nucleotide similarity (Table S1, Table S2, Table S3, and Table S4), were used to construct the phylogenetic trees. Sequence alignment in the amino acid space was performed with MUSCLE 3.6 [47]. The maximum-likelihood phylogenetic tree in Fig. 4 was constructed with PhyML [48] using the default parameters in the program Bosque [49]. Percentages of Bootstrap support values ($50) based on 1000 replications are shown at the nodes. Sequence data were deposited in the GenBank database under accession numbers HM801148 to HM801841.
Supporting Information
Figure S1 N2 fixation rates versus P* (and index of the excess
inorganic phosphorous relative to inorganic nitrogen [17]). Rates of N2 fixation were distributed across a wide range of P* values
during the Knorr and Galathea-3 cruises. (TIF)
Figure S2 Time course experiments of nitrogen fixation rates carried out in the upwelling system off central Chile (36uS) in 2008. Data shows (A) an accumulation of %15N in all samples over time and (B) A relatively constant trend in particulate nitrogen (PN) during the same experiments. Samples were obtained at 5 m (Times Series 1), 80 m (Time Series 2), 15 m depth (Time Series 3) and 30 m depth (Time Series 4).
(TIF)
Table S1 Operational Taxonomic Units (OTUs; with 95% similarity at the nucleotide basis [50–52]) and representative nifH sequences for the Knorr cruise (2005).
(DOC)
Table S2 Distribution of the different OTUs found at each station and depth during the Knorr cruise.
(DOC)
Table S3 Operational Taxonomic Units (OTUs; with 95% similarity at the nucleotide basis [52–58]) and representative sequences for the Galathea 3 cruise.
(DOC)
Table S4 Distribution of the different OTUs found at each station and depth during the Galathea-3 cruise.
(DOC)
Table S5 Comparison between water column N2fixation rates
obtained from the literature ([8,10,35,59–64]) and values obtained in this study. The table shows previously published rates for unicellular diazotrophs as well as rates obtained during this study. Colonial diazotrophic cyanobacteria were not included in the table because they were not detected in the study area. The listed techniques are: ARA (Acetylene Reduction Assay), NA (Nitroge-nase Activity) and 15N2 (Stable isotope tracer technique). Rates
reported as hourly estimates (*) were transformed into daily rates regardless of potential daily periodicity in unicellular diazotrophs. (DOC)
Acknowledgments
We thank M. Cornejo, M. Gallegos, G. Alarco´n, M. Montoya, S. Ramirez and V. Molina for technical assistance in the field and in the laboratory. S.
Giglio is acknowledged for help with Figure 1. We are also grateful to J. Moffet and B. Thamdrup for inviting us to participate in the Knorr and Galathea-3 cruises, respectively. The captain and crew of the US R/V KNORR and the Danish R/V Væderen provided valuable assistance during fieldwork. The authors declare that they have no competing interests.
Author Contributions
Conceived and designed the experiments: CF. Performed the experiments: CF LF OU. Analyzed the data: CF LF OU. Wrote the paper: CF LF OU. Carried out the phylogenetic analysis: OU. Contributed to figure preparation/schematic diagrams: CF LF OU.
References
1. Codispoti LA (2007) An oceanic fixed nitrogen sink exceeding 400 Tg N a21vs.
the concept of homeostasis in the fixed-nitrogen inventory. Biogeosciences 4: 233–253.
2. Falkowski PG (1997) Evolution of the nitrogen cycle and its influence on the biological sequestration of CO2in the ocean. Nature 387: 272–275.
3. Dalsgaard T, Canfield DE, Petersen J, Thamdrup B, Acun˜a-Gonza´lez J (2003) N2production by the anammox reaction in the anoxic water column of Golfo
Dulce, Costa Rica. Nature 422: 606–608.
4. Kuypers MM, Sliekers AO, Lavik G, Schmid M, Jorgensen BB, et al. (2003) Anaerobic ammonium oxidation by anammox bacteria in the Black Sea. Nature 422: 608–611.
5. Berman-Frank I, Chen Y, Gao Y, Fennel K, Follows MJ, et al. (2008) Feedback between the nitrogen, carbon and oxygen cycles. In: Capone D, Bronk D, Mulholland M, Carpenter EJ, eds. Nitrogen in the marine environment. Amsterdam The Netherlands: Elsevier Inc. pp 1539–1563.
6. Gruber N (2004) The dynamics of the marine nitrogen cycle and its influence on atmospheric CO2variations. In: Follows F, Oguz T, eds. The ocean carbon
cycle and climate. NATO ASI Series. Dordrecht: Kluwer Academic. pp 97–148. 7. Capone DG, Burns JA, Montoya JP, Subramaniam A, Mahaffey C, et al. (2005) Nitrogen fixation by Trichodesmium spp.: An important source of new nitrogen to the tropical and subtropical North Atlantic Ocean. Global Biogeochem Cy 19: doi: 10.1029/2004CB002331.
8. Montoya JP, Holl CM, Zehr JP, Hansen A, Villareal TA, et al. (2004) High rates of N2fixation by unicellular diazotrophs in the oligotrophic Pacific Ocean.
Nature 430: 1027–1031.
9. Zehr JP, Waterbury JB, Turner PJ, Montoya JP, Omoregie E, et al. (2001) Unicellular cyanobacteria fix N2in the subtropical north Pacific Ocean. Nature
412: 635–638.
10. Falco´n LI, Carpenter EJ, Cipriano F, Bergman B, Capone DG (2004) N2
fixation by unicellular bacterioplankton from the Atlantic and Pacific Oceans: phylogeny and in situ rates. Appl Environ Microb 70: 765–770.
11. Riemann L, Farnelid H, Steward GF (2010) Nitrogenase genes in non-cyanobacterial plankton: prevalence, diversity and regulation in marine waters. Aquat Microb Ecol 61: 235–247.
12. Jetten MSM, Wagner M, Fuerst J, van Loosdrecht M, Kuenen G, et al. (2001) Microbiology and application of the anaerobic ammonium oxidation (anammox) process. Curr Opin Biotech 12: 283–288.
13. Thamdrup B, Dalsgaard T (2002) Production of N2 through anaerobic
ammonium oxidation coupled to nitrate reduction in marine sediments. Appl Environ Microb 68: 1312–1318.
14. Kuypers MMM, Lavik G, Woebken D, Schmid M, Fuchs BM, et al. (2005) Massive nitrogen loss from the Benguela upwelling system through anaerobic ammonium oxidation. PNAS 102: 6478–6483.
15. Thamdrup B, Dalsgaard T, Jensen MM, Ulloa O, Farı´as L, et al. (2006) Anaerobic ammonium oxidation in the oxygen-deficient waters off northern Chile. Limnol Oceanogr 51: 2145–2156.
16. Ward BB, Devol AH, Rich JJ, Chang BX, Bulow SE, et al. (2009) Denitrification as the dominant nitrogen loss process in the Arabian Sea. Nature 461: 78–81. 17. Deutsch C, Sarmiento JL, Sigman DM, Gruber N, Dunne JP (2007) Spatial
coupling of nitrogen inputs and losses in the ocean. Nature 445: 163–167. 18. Codispoti LA, Packard TT (1980) Denitrification rates in the eastern South
Pacific. J Mar Res 38: 453–477.
19. Copin-Monte´gut C, Raimbault P (1994) The Peruvian upwelling near 15uS in August 1986. Results of continuous measurements of physical and chemical properties between 0 and 200 m depth. Deep Sea Res I 41: 439–467. 20. Hamersley MR, Lavik G, Woebken D, Rattray JE, Lam P, et al. (2007)
Anaerobic ammonium oxidation in the Peruvian oxygen minimum zone. Limnol Oceanogr 52: 923–934.
21. McPhaden MJ (2008) Evolution of the 2006–2007 El Nin˜o: the role of intraseasonal to interannual time scale dynamics. Adv Geosci 14: 219–230.
22. Revsbech NP, Larsen LH, Gundersen J, Dalsgaard T, Ulloa O, et al. (2009) Determination of ultra-low oxygen concentrations in oxygen minimum zones by the STOX sensor. Limnol Oceanogr-Meth 7: 371–381.
23. Mehta MP, Butterfield DA, Baross JA (2003) Phylogenetic diversity of nitrogenase (nifH) genes n deep sea and hydrothermal vent environments of the Juan Fuca Ridge. Appl Environ Microb 69: 960–970.
24. Zehr JP, Jenkins BD, Short SM, Steward GF (2003) Nitrogenase gene diversity and microbial community structure: a cross-system comparison. Environ Microbiol 5: 539–554.
25. Chien YT, Zinder SH (1996) Cloning, functional organization, transcript studies, and phylogenetic analysis of the complete nitrogenase structural genes (nifHDK2) and associated genes in the archaeon Methanosarcina barkeri 227. J Bacteriol 178: 143–148.
26. Zehr J, Church MJ, Moisander PH (2006) Diversity, distribution and biogeochemical significance of nitrogen-fixing microorganisms in anoxic and suboxic ocean environments. In: Neretin LN, ed. Past and present water column anoxia. , Netherlands: Springer. pp 337–369.
27. Montoya J, Voss M, Ka¨hler P, Capone D (1996) A simple, high-sensitivity tracer assay for N2Fixation. Appl Environ Microb 62: 986–993.
28. Dore JE, Letelier RM, Church MJ, Lukas R, Karl DM (2008) Summer phytoplankton blooms in the oligotrophic North Pacific Subtropical Gyre: Historical perspective and recent observations. Prog Oceanogr 76: 2–38. 29. Mohr W, Grobkopf T, Wallace DWR, LaRoche J (2010) Methodological
Underestimation of Oceanic Nitrogen Fixation Rates. PLoS ONE 5(9): e12583. doi:10.1371/journal.pone.0012583.
30. Chang BX, Devol AH, Emerson SR (2010) Denitrification and the nitrogen gas excess in the eastern tropical South Pacific oxygen deficient zone. Deep Sea Res I 57: 1092–1101.
31. Brandes JA, Devol AH, Yoshinari T, Jayakumar DA, Naqvi SWA (1998) Isotopic composition of nitrate in the central Arabian Sea and eastern tropical North Pacific: A tracer for mixing and nitrogen cycles. Limnol Oceanogr 43: 1680–1689.
32. DePol-Holz R, Robinson RS, Hebben D, Sigman D, Ulloa O (2009) Controls on sedimentary nitrogen isotopes along the Chilean margin. Deep Sea Res II 56: 1042–1054.
33. Sigman DM, Granger J, DiFiore P, Lehmann M, Ho R, et al. (2005) Coupled nitrogen and oxygen isotope measurements of nitrate along the eastern North Pacific margin. Global Biogeochem Cy 19: GB4022. doi: 10.1029/ 2005GB002458.
34. Bonnet S, Guieu C, Bruyant F, Prasil O, van Wambeke F, et al. (2008) Nutrient limitation of primary productivity in the Southeast Pacific (BIOSOPE cruise). Biogeosciences 5: 215–225.
35. Halm H, Musat N, Lam P, Langlois R, Musat F, et al. (2009) Co-occurrence of denitrification and nitrogen fixation in a meromictic lake, Lake Cadagno (Switzerland). Environ microbiol 11: 1945–1958.
36. Goto M, Ando S, Hachisuka Y, Yoneyama T (2005) Contamination of diverse nifH and nifH-like DNA into commercial PCR primers. FEMS Microbiol Lett 246: 33–38.
37. Zehr JP, Crumbliss LL, Church MJ, Omoregie EO, Jenkins BD (2003) Nitrogenase genes in PCR and RT-PCR reagents: implications for studies of diversity of functional genes. Biotechniques 35: 996–1005.
38. Fulweiler RW, Nixon SW, Buckley BA, Granger SL (2007) Reversal of the net dinitrogen gas flux in coastal marine sediments. Nature 448: 180–182. 39. Welsh D (2000) Nitrogen fixation in seagrass meadows: Regulation,
plant-bacteria interactions and significance to primary productivity. Ecol Lett 3: 58–71.
40. Holmes RH, Aminot A, Ke´rouel R, Hooker BA, Peterson BJ (1999) A simple and precise method for measuring ammonium in marine and freshwater ecosystems. Can J Fish Aquat Sci 56: 1801–1808.
41. Parsons TR, Maita Y, Lalli CM (1984) A manual of chemical and biological methods for seawater analysis. New York USA: Pergamon Press. 173 p. 42. Hansen JW, Thamdrup B, Jorgensen BB (2000) Anoxic incubation of sediment
in gas-tight plastic bags: a method for biogeochemical process studies. Mar Ecol-Progr Ser 208: 273–282.
43. Paerl HW, Zehr J (2000) Marine nitrogen fixation In: Kirchman DL, ed. Microbial Ecology of the Oceans. New Jersey USA: Wiley-Liss Inc. pp 387–426. 44. Farı´as L, Paulmier A, Gallegos M (2007) Nitrous oxide and N-nutrient cycling in the oxygen minimum zone off northern Chile. Deep Sea Res I 54: 164–180. 45. Zani S, Mellon MT, Collier JL, Zehr JP (2000) Expression of nifH genes in
natural microbial assemblages in Lake George, New York, detected by Reverse Transcriptase PCR. Appl Environ Microb 66: 3119–3124.
46. Zehr J, McReynolds LA (1989) Use of degenerate Oligonucleotides for amplification of the nifH gene from the marine cyanobacterium Trichodesmium thiebaitii. Appl Environ Microb 55: 2522–2526.
47. Edgar RC (2004) MUSCLE: multiple sequence alignment with high accuracy and high throughput. Nucleic Acids Res 32: 1792–1797.
48. Guidon S, Gascuel O (2003) A simple, fast, and accurate algorithm to estimate large phylogenies by maximum likelihood. Syst Biol 52: 696–704.
49. Ramı´rez-Flandes S, Ulloa O (2008) Bosque: integrated phylogenetic analysis software. Bioinformatics 24: 2539–2541.
50. Steward G, Jenkins B, Ward B, Zehr J (2004) Development and testing of a DNA macroarray to assess nitrogenase (nifH) gene diversity. Appl Environ Microb 70: 1455–1465.
51. Pinto-Tomas AA, Anderson MA, Suen G, Stevenson DM, Chu FST, et al. (2009) Symbiotic nitrogen fixation in the fungus gardens of leaf-cutter ants. Science 326: 1120–1123.
52. Yang JC, Madupu R, Durkin AS, Ekborg NA, Pedamallu CS, et al. (2009) The complete genome of Teredinibacter turnerae T7901: an intracellular endosym-biont of marine wood-boring bivalves (shipworms). PLoS ONE 4(7): e6085. doi:10.1371/journal.pone.0006085.
53. Kopke M, Held C, Hujer S, Liesegang H, Wiezer A, et al. Clostridium Ijungdahlii represents a microbial production platform based on syngas. PNAS 107: 13087–13092. doi 10.1073/pnas.1004716107.
54. Choo Q, Samian M, Najimudin N (2003) Phylogeny and characterization of three nifH-homologous genes from Paenibacillus azotofixans. Appl Environ Microb 69: 3658–3662.
55. Blaha D, Sanguin H, Robe P, Nalin R, Bally R, et al. (2005) Physical organization of phytobeneficial genes nifH and ipdC in the plant growth-promoting rhizobacterium Azospirillum lipoferum 4VI. FEMS Microbiol Lett 244: 157–163.
56. Auman A, Speake C, Lidstrom M (2001) nifH sequences and nitrogen fixation in type I and type II methanotrophs. Appl Environ Microb 67: 4009+. 57. Noar JD, Buckley DH (2009) Ideonella azotifigens sp. nov., an aerobic
diazotroph of the Betaproteobacteria isolated from grass rhizosphere soil, and emended description of the genus Ideonella. Int J Syst Evol Micr 59: 1941–1946. 58. Nzoue A, Miche L, Klonowska A, Laguerre G, deLajudie P, et al. (2009) Multilocus sequence analysis of bradyrhizobia isolated from Aeschynomene species in Senegal. Syst Appl Microbiol 32: 400–412.
59. Needoba JA, Foster RA, Sakamoto C, Zehr JP, Johnson KS (2007) Nitrogen fixation by unicellular diazotrophic cyanobacteria in the temperate oligotrophic North Pacific Ocean. Limnol Oceanogr 52: 1317–1327.
60. Montoya JP, Voss M, Capone CG (2007) Spatial variation in N2-fixation rate and diazotrophs activity in the Tropical Atlantic. Biogeosciences 4: 369–376. 61. Dore JE, Brum JR, Tupas LM, Karl DM (2002) Seasonal and interannual
variability in sources of nitrogen supporting export in the oligotrophic subtropical North Pacific Ocean. Limnol Oceanogr 47: 1595–1607. 62. Zehr JP, Turner PJ (2001) Nitrogen fixation: Nitrogenase genes and gene
expression. Method Microbiol 30: 271–286.
63. Zehr JP, Montoya JP, Jenkins BD, Hewson I, Mondragon E, et al. (2007) Experiments linking nitrogenase gene expression to nitrogen fixation in the North Pacific subtropical gyre. Limnol Oceanogr 52: 169–183.
64. Raimbault P, Garcia N (2008) Evidence for efficient regenerated production and dinitrogen fixation in nitrogen-deficient waters of the South Pacific Ocean: impact on new and export production estimates. Biogeosciences 5: 323–338.