HAL Id: hal-00446258
https://hal.archives-ouvertes.fr/hal-00446258
Submitted on 13 Jan 2010
HAL is a multi-disciplinary open access
archive for the deposit and dissemination of
sci-entific research documents, whether they are
pub-lished or not. The documents may come from
teaching and research institutions in France or
L’archive ouverte pluridisciplinaire HAL, est
destinée au dépôt et à la diffusion de documents
scientifiques de niveau recherche, publiés ou non,
émanant des établissements d’enseignement et de
recherche français ou étrangers, des laboratoires
Random model of vibrations for Foreign Object Damage
detection in a civil aircraft engine
Aurélien Hazan, Michel Verleysen, Marie Cottrell, Jérôme Lacaille
To cite this version:
Aurélien Hazan, Michel Verleysen, Marie Cottrell, Jérôme Lacaille. Random model of vibrations
for Foreign Object Damage detection in a civil aircraft engine. Machine Learning for Aerospace
International Workshop, Jul 2009, Marseille, France. pp.149-152. �hal-00446258�
Random model of vibrations for Foreign Object
Damage detection in a civil aircraft engine
Aur´elien Hazan
SAMOS, Universit´e Paris 1 90, rue de Tolbiac 75013 Paris, France
Michel Verleysen
Universit´e Catholique de Louvain DICE - Machine Learning Group
3 place du Levant, B-1348 Louvain-la-Neuve, Belgium
Marie Cottrell
SAMOS, Universit´e Paris 1 90, rue de Tolbiac 75013 Paris, France
J´erˆome Lacaille
SNECMA - Integration Division
Rond Point Ren´e Ravaud 77550 Moissy-Cramayel
Abstract
In this article we analyze several vibration time series measured on a real fan test rig before and after it is hit by a flying object. We show first evidence that a windowed autoregressive model may be used to detect the shock after it occurred. We compare these results with a second time series that measures the rotation period of the fan. Lastly we repeat this experiment using adaptive autoregressive estimation instead of the classical AR estimation algorithm. First results show that vibration data allow better prediction. Furthermore, the windowed AR estimation algorithm seems to perform better than the adaptive one.
1
Introduction
Foreign Object Damage (FOD) is a serious threat to civil aicraft engines, all the more given that it occurs and vanishes very quickly. One can detect FODs with the help of vibration sensors because they elicit a short and intense rise in vibration amplitude, as shown by Fig. 2 (top). However, for several reasons this burst may be hard to detect online, or may trigger false alarms when buried in real engine noise.
In this article we consider detecting FODs even after the shock, by monitoring vibrations sensors and the duration of each shaft revolution, and modeling them as random signals. This approach is commonplace in structural health monitoring [1] but to the best of our knowledge was not applied so far to FOD detection.
2
Methods
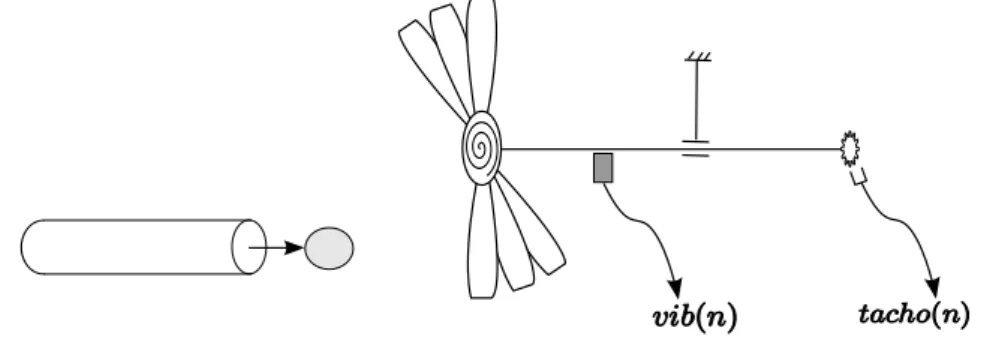
The test system is not a complete aircraft engine, but a partial fan with a small number of blades used by Snecma for testing, as depicted by Fig.1. The shaft angular position can be computed thanks to a keyphasor that emits a pulse at the end of each cycle, and whose raw output is noted tacho(n).
Furthermore, the amplitude of vibration is measured with a accelerometer mounted on the test rig, and that outputs vib(n). At a specific time instant, a cannon fires a projectile at a controlled speed,
aimed at a precise blade.
Figure 1: Test rig composed of a single fan with a small number of symmetric blades, and equipped with a tachometer and a vibration sensor.
The available data are provided by the Health Monitoring Department of Snecma. It includes vi-brations and raw keyphasor for three different experiments, sampled at 25000 Hz, during several hundred seconds. Raw vibration data is kept almost unchanged, since it shows no trend, variance fluctuation nor slow periodic variation. Because our aim is to detect the shock after its occurrence, we remove the short time interval that corresponds to this event, represented by Fig. 2 (top). The beginning of the shock is found by thresholding the amplitude with a fixed arbitrary threshold, the length of the event is set to 2s.
Meanwhile, raw keyphasor data is preprocessed with a local polynomial interpolation and simple root-finding so as to get precise zero-crossing time, and hence the duration of successive periods, given in seconds. The result is shown by Fig. 2 (bottom), where the shock is easily seen. In a similar way, we remove the time interval where the shock occurs. Moreover, we detrend and deseasonalize the data, to get rid of a periodic modulation of the signal.
298 299 300 301 302 303 304 305 306 307 −15 −10 −5 0 5 10 15 vib(t) 298 299 300 301 302 303 304 305 306 307 0.0124 0.0124 0.0124 0.0124 t (in sec) per(t)
Figure 2: Time series of (top) vibration sensors vib(t) and (bottom) period duration.
The obtained time series are modeled as autoregressive (AR) stationary processes, whose coeffi-cients are estimated by two algorithms. First we use the classical Burg algorithm [2] with
nonover-lapping windows, then we we run an adaptive autoregressive algorithm [3]. Dimension reduction is simply performed by PCA.
3
Results
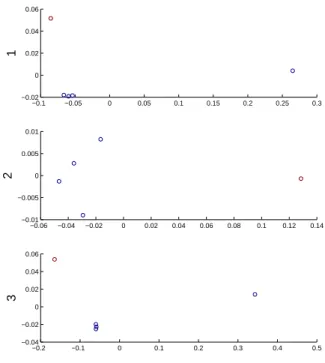
We first present results relative to windowed AR estimation and projection, in the case of vibrations. Each vibration time series is divided into 5 blocks of equal length. The first four blocks correspond to pre-shock data, the last block to post-shock data. The order of AR models is set to 10, after a first model selection step that is not discussed here. The dimension of the reduced space obtained by PCA is set to 2. For each of the three separate FOD experiments, Fig. 3 shows the resulting scatter plot. Pre-shock (resp. post-shock) dots are in blue (resp. red). In all three cases, post-shock data are represented by an isolated point. However, in cases 1 and 3 there is another distant point, whose presence is unexplained so far.
−0.1 −0.05 0 0.05 0.1 0.15 0.2 0.25 0.3 −0.02 0 0.02 0.04 0.06 1 −0.06 −0.04 −0.02 0 0.02 0.04 0.06 0.08 0.1 0.12 0.14 −0.01 −0.005 0 0.005 0.01 2 −0.2 −0.1 0 0.1 0.2 0.3 0.4 0.5 −0.04 −0.02 0 0.02 0.04 0.06 3
Figure 3: Scatter plot of AR coefficients projected in a bidimensionnal reduced space, for the three successive vibration data blocks. The last point -in red- corresponds to the post-shock part of the time-series.
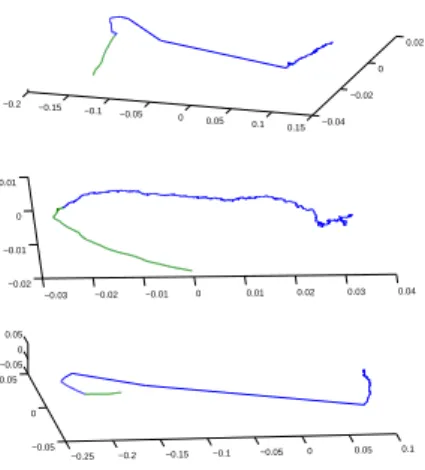
Now we compute adaptive autoregressive coefficients [4], and project them in 3-dimensional space. We discard the beginning of the obtained time series to get rid of convergence transient, and plot the three trajectories in Fig.4. The green part of the curve stands for the post-shock time interval. In cases 1 and 3 we notice a sudden change in the direction of the tangent to the curve. This lack of frank discontinuity may result from the very nature of the adaptive algorithm, which uses past data to overcome the underdetermination of the estimation problem.
Lastly we have made the same experiment with the time series per(t), but must conclude that so far
no interesting result was found. Our first intuition was that the aftershock could last longer with the period duration, but it turns out that the order of magnitude is roughly the same, as evidenced by Fig. 2.
−0.2 −0.15 −0.1 −0.05 0 0.05 0.1 0.15 −0.04 −0.02 0 0.02 −0.03 −0.02 −0.01 0 0.01 0.02 0.03 0.04 −0.02 −0.01 0 0.01 −0.25 −0.2 −0.15 −0.1 −0.05 0 0.05 0.1 −0.05 0 0.05 −0.05 0 0.05
Figure 4: Trajectory plots of adaptive AR coefficients projected in a 3-dimensional reduced space, for the three successive vibration data blocks. The last part -in green- corresponds to the post-shock part of the time-series.
4
Conclusions and future work
In this article we tackled the issue of detecting an FOD after the shock has occured. We have pre-sented preliminary results obtained with a test rig that is different from a real aircraft engine. How-ever some evidence is shown that elementary filtering and dimension reduction could be sufficient for such detection.
As more in-depth investigations are needed, we first plan to fine-tune the model selection and esti-mation of the autoregressive model coefficient. The process type is so far restrained to AR model, but may be extended to several classical processes (ARMA, ARIMA, . . . ) as well as others more likely to be found in vibration and health monitoring litterature (TARMA, . . . ). The order choice must be discussed in detail, as well as goodness-of-fit tests results. Similarly, the tradeoff between the window length and the number of available points will be debated on statistical grounds in order to balance the lack of data. Lastly, the physical justification for modelling normal vibrations with such AR process will be traced back in the relevant litterature1; then the mechanical effect of a FOD
on this model will be derived, so as to explain the effect on the estimated AR coefficients.
In the much more complex case of a real engine, all the previous steps will be taken successively so as to decide whether or not FOD can be detected after their occurrence. We remarked already that vibrations have a much more harmonic content in that case than with the test rig, which could impose further constraints on the AR model.
References
[1] Poulimenos A., Fassois S.D., (2006) Parametric Time-Domain Methods for Non-Stationary Random Vibra-tion Modelling and Analysis: A Critical Survey and Comparison, Mechanical Systems and Signal Processing, Vol. 20(4), pp. 763-816.
[2] P.J. Brockwell, R.A. Davis, (2002) Introduction to Time Series and Forecasting, second edition, Springer-Verlag, New York.
[3] S.S. Haykin, (1986) Adaptive filter theory, Prentice Hall.
[4] L. Ljung, (1999) System Identification: Theory for the User, Prentice Hall, Upper Saddle River, NJ.
1
it is easy to see why an approximate solution of the deterministic differential equation x′′= sin(ωt) can be found in an AR form, by simply replacing x′′by its finite difference counterpart x(t + 1) − 2x(t) + x(t − 1) and considering the sine as a random process.