HAL Id: hal-02687654
https://hal.inrae.fr/hal-02687654
Submitted on 12 Aug 2020
HAL is a multi-disciplinary open access
archive for the deposit and dissemination of
sci-entific research documents, whether they are
pub-lished or not. The documents may come from
teaching and research institutions in France or
abroad, or from public or private research centers.
L’archive ouverte pluridisciplinaire HAL, est
destinée au dépôt et à la diffusion de documents
scientifiques de niveau recherche, publiés ou non,
émanant des établissements d’enseignement et de
recherche français ou étrangers, des laboratoires
publics ou privés.
Evaluating gene flow using selected markers: A case
study
Thomas Lenormand, Thomas Guillemaud, Denis Bourguet, Michel Raymond
To cite this version:
Thomas Lenormand, Thomas Guillemaud, Denis Bourguet, Michel Raymond. Evaluating gene flow
using selected markers: A case study. Genetics, Genetics Society of America, 1998, 149, pp.1383-1392.
�hal-02687654�
Copyright1998 by the Genetics Society of America
Evaluating Gene Flow Using Selected Markers: A Case Study
Thomas Lenormand, Thomas Guillemaud, Denis Bourguet
1and Michel Raymond
Laboratoire Ge´ne´tique et Environnement, Institut des Sciences de l’Evolution (UMR 5554), Universite´ Montpellier II, 34095 Montpellier Cedex 5, France
Manuscript received September 16, 1997 Accepted for publication March 9, 1998
ABSTRACT
The extent to which an organism is locally adapted in an environmental pocket depends on the selection intensities inside and outside the pocket, on migration, and on the size of the pocket. When two or more loci are involved in this local adaptation, measuring their frequency gradients and their linkage disequilbria allows one to disentangle the forces—migration and selection—acting on the system. We apply this method to the case of a local adaptation to organophosphate insecticides in the mosquito Culex pipiens pipiens in southern France. The study of two different resistance loci allowed us to estimate with support limits gene flow as well as selection pressure on insecticide resistance and the fitness costs associated with each locus. These estimates permit us to pinpoint the conditions for the maintenance of this pocket of adaptation as well as the effect of the interaction between the two resistance loci.
A
LTHOUGH evolutionary theory attempts mainly to this finite variance requires knowledge of population sizes and of the patterns of isolation by distance (Rous-explain past changes, its predictions can be testedby examining actual evolutionary processes in natural set1997).
Another approach is to analyze directly the relative populations. To do so we must quantify the
determinis-tic processes causing genedeterminis-tic evolution, namely, selec- magnitude of gene flow vs. selection through clinal pat-terns that have been extensively studied theoretically for tion and gene flow, and take into account the
unpredict-able changes due to stochastic processes such as random various selection models (Felsenstein 1976; Endler 1977). In an infinite environment and at equilibrium, drift and mutation. Among these factors only gene flow
(and stabilizing selection) will oppose genetic differenti- the cline slope is a robust estimate of the relative mag-nitude of selection vs. migration (Barton and Gale ation between populations. Its evaluation is therefore
required for the understanding of the evolution of pop- 1993). Different methods can be used to infer the abso-lute value of each term, and in all cases, they require ulations in their “adaptive landscape” (for review, see
Slatkin1987). However, methods are lacking to evalu- extra information about the system such as (1) a direct measure of dispersal, thus giving an indirect estimate ate gene flow independently of selection, mutation, or
drift. of selection (Endler 1977; Barton and Hewitt 1985); (2) a genotypic parameter such as heterozygote defi-In most cases, it is possible to determine the relative
ciency at one locus or linkage disequilibria when several magnitude of gene flow vs. drift, and thus estimate the
loci are involved, the latter being more reliable (Mal-degree of isolation of populations. This determination
letand Barton 1989); (3) the variation of the cline enables the evaluation of the effects of different kinds
through time, for instance, the speed of a wave of ad-of selection, ad-of the geographic scale ad-of a local adaptation
vance of an advantageous gene (Fisher 1937) or the (Nagylaki 1975), or whether such populations might
rate of modification of the cline shape when selection be able to cross an “adaptive valley” (Lande 1985).
or migration is not constant. Despite their potential for These methods, in principle, are valid for neutral and
the understanding of the evolution of populations over independent genes at equilibrium and for a given rate
their “adaptive landscape,” these methods have mainly and mode of mutation. When averaged over many loci,
been used for the analysis of tension zones (Barton these methods may be robust to slight departures from
1982; Szymura and Barton 1986; Mallet et al. 1990; the assumptions (Slatkin and Barton 1989). However,
Siteset al. 1995). The aim of this article is to show that they provide an estimate of the number of “effective”
these methods can also be useful for understanding the migrants but not of migration variance (s2). Estimating
dynamics of local adaptation.
We have investigated the case of local adaptation of the mosquito Culex pipiens pipiens to organophosphate Corresponding author: Thomas Lenormand, Laboratoire Ge´ne´tique
et Environnement, Institut des Sciences de l’Evolution (UMR 5554), insecticides in the Montpellier area in France. This ad-Universite´ Montpellier II, CC065 Place E. Bataillon, F-34095
Montpel-aptation is conferred by resistance alleles at two major
lier Cedex 5, France. E-mail: [email protected]
loci. Insecticide selection varies geographically, creating
1Present address: Station de Recherche de lutte biologique, INRA La
Minie`re, 78285 Guyancourt Cedex, France. a pocket of adaptation. We have analyzed clinal patterns
TABLE 1
at these two loci to estimate selection intensities and
gene flow. These estimates were used to evaluate the Nomenclature role of interaction between the two loci for the
main-tainance of the pocket of adaptation. Finally, we com- Coding rules
pared our estimates to direct or indirect estimates of
Genotype Genotype Phenotype Class
selection intensity and gene flow in other studies.
Ester4Ester4 (44) [4] {E}
Ester4Ester0 (40) [4] {E}
MATERIALS AND METHODS Ester1Ester1 (11) [1] {E}
Ester1Ester0 (10) [1] {E}
Culex pipiens and its environment: Larval development of
Ester2Ester2 (22) [2] {E}
the mosquito C. p. pipiens takes place mainly in anthropic
Ester2Ester0 (20) [2] {E}
pools where insecticide control occurs. Females are
presum-Ester4Ester1 (41) [41] {E}
ably fertilized at emergence (Weidhass et al. 1973) and then
Ester4Ester2 (42) [42] {E}
search for their blood meal and a site to layz150–200 eggs.
Ester2Ester1 (21) [21] {E}
Insecticides are applied during the breeding season, that is,
approximately from April to October near Montpellier in Ester0Ester0 (00) [0] {O}
southern France (see Chevillon et al. 1995 for details) and are Ace.1RAce.1R (RR) [RR] {R}
restricted to a 20-km coastal belt. Between 1968 and 1990–91, Ace.1RAce.1S (RS) [RS] {R}
organophosphate (OP) insecticides were exclusively used for Ace.1RSAce.1S (RSS) [RS] {R}
mosquito control and have been replaced since then by the Ace.1RSAce.1R (RSR) [RS] {R}
Bacillus sphaericus toxin. However, in the Montpellier area, OP Ace.1RSAce.1RS (RSRS) [RS] {R}
insecticides are still used at large doses to control other
Culic-Ace.1SAce.1S (SS) [SS] {S}
ids and even to control C. p. pipiens in some situations (Anony-mous1990–1995). Additionally, residual doses of OP may be
The resistance allele Ester1corresponds to overproduced
of the order of lethal concentrations for susceptible mosqui- esterase A1, and alleles Ester2and Ester4correspond to
overpro-toes in many places of the treated area, possibly due to other duced esterases A2-B2 and A4-B4, respectively. Ace.1Scodes
pest controls (R. Eritja, personal communication). for a sensitive AChE1, Ace.1Rfor an insensitive AChE1, and
Genetics of resistance:Two main loci are responsible for Ace.1RSfor both acetylcholinesterases. “Coding rules” indicates
OP resistance in C. p. pipiens. The first locus, Ace.1, codes for the simplified code for each genotype, phenotype, and class an acetylcholinesterase (AChE1), the OP target (Bourguet corresponding to the genotype indicated in the first column. et al. 1996a; Malcolm et al. 1998) and has three alleles: Ace.1R
“Phenotype” corresponds to the electrophoretic phenotype that codes for an insensitive AChE1; Ace.1Sthat codes for a
(Ester locus) or to the TPP phenotype (Ace.1 locus). “Class” sensitive AChE1; and Ace.1RSthat corresponds to a duplication
groups genotypes with at least one resistance allele. {E}/{O} of Ace.1 and codes for both enzymes (Raymond et al. 1986; for the presence/absence of at least one overproduced ester-Bourguetet al. 1996b,c). The second locus corresponds to
ase and {R}/{S} for the presence/absence of at least one insen-a “super locus,” thinsen-at is, two closely linked loci, Est-3 insen-and sitive AChE1.
Est-2, coding for esterases A and B, respectively (de Stordeur 1976; Pasteur et al. 1981a,b). Only 2 to 6 kb of DNA separate Est-3 from Est-2 (Rooker et al. 1996; Guillemaud et al. 1997).
populations, resistance alleles at both loci are associated with Resistance alleles at Est-3 and Est-2 induce an overproduction
fitness costs, in the absence of insecticides, through decreases of esterase, resulting in gene amplification or gene regulation
in fecundity and adult survival and an increase in larval devel-(Rooker et al. 1996). Due to their close proximity, esterase
opmental time. These fitness costs tend to be higher for insen-genes are often coamplified as a single unit, which explains
sitive acetylcholinesterase than for overproduced esterases the complete association of resistance alleles at both loci
(Chevillon et al. 1997). (Rooker et al. 1996; Guillemaud et al. 1997). This
coamplifi-Data collection:Pupae were sampled on July 5, 1995 in 10 cation justifies considering them as a single “super locus,”
breeding sites along a 50-km north-south transect (Figure 1) which will hereafter be designated as Ester. In southern France,
across the treated and untreated areas studied by Guillemaud three resistance alleles have been identified at this locus. Ester1
et al. (1998). They were reared until emergence, and adults corresponds to an increased expression of the esterase A1,
were stored at2808. whereas Ester2and Ester4correspond to coamplification of
es-For each mosquito, resistance alleles at the Ester and Ace.1 terases A and B genes (A2-B2 and A4-B4, respectively). The
loci were determined as follows. The thorax and the abdomen recombination rate between Ester and Ace.1 has been estimated
were used to detect overproduced esterases using starch-gel to be 14.5% (our unpublished results). The nomenclature
electrophoresis (Tris-Maleate-EDTA 7.4 buffer; Pasteur et al. used in this article is indicated in Table 1.
1988). The head was used to characterize AChE1 using the
Fitness of resistant mosquitoes: The different resistance
Te´moin-Propoxur-Propoxur (TPP) test described by Bour-alleles contribute unequally to OP resistance: in southern
guet et al. (1996e). Overproduced esterases are dominant
France, insensitive acetylcholinesterase alleles confer in
gen-markers under our electrophoretic conditions, and the TPP eral a resistance higher than overproduced esterases
(Ray-test determines individuals displaying sensitive, resistant, or mond et al. 1986; Poirie´ et al. 1992; Severini et al. 1993;
both types of acetylcholinesterase. Thus, these methods do Raymondand Marquine 1994; Rivet et al. 1994). When
over-not allow complete geover-notype identification. Table 1 indicates produced esterases and insensitive acetylcholinesterase are
the correspondence between each genotype and its simplified present together in the same mosquito, the insecticide
resis-code (parentheses) as well as the corresponding identified tance combines additively (Raymond et al. 1989). At both
phenotype [brackets]. In addition, a phenotypic class for indi-loci, resistance alleles can be assumed to be codominant for
viduals that carry at least one resistance allele has been defined resistance (Raymond et al. 1987; Poirie´ 1991), although the
at each locus {braces}. To identify individuals at both loci, dominance of the resistance conferred by the Ace.1Rallele is
1385 Gene Flow in Culex pipiens
can be very asymmetric. However, Nagylaki (1975, Equations 32–33) showed that they can be described by the maximum gene frequency and the gene frequency at the transition be-tween the two environments and that the relative magnitude of selection vs. migration can be deduced from these charac-teristics.
The full analytical treatment in the case of two loci in a semi-infinite environment has not been performed, although Slatkin(1975) worked out numerically the case of an infinite environment. When two loci with two alleles each are consid-ered, fitness interactions between genes as well as their linkage must be considered. Additionally, linkage disequilibria are generated by migration that steepen each of the clines.
Descriptive analysis: In order to test for the presence of frequency gradients at each resistance allele along the tran-sect, data were fitted to descriptive cline models. Allelic distri-butions were fitted according to a scaled negative exponential. For instance, the frequencies of the four esterase alleles were modeled as follows:
Ester1: f 1(x)5 h1.e2a1.x2
Ester2: f 2(x)5 h2.(1 2 h1).e2a2.x2
Ester4: f 4(x)5 h4.(1 2 h1 2 h2.(1 2 h1)).e2a4.x2
Ester0: f 0(x)5 1 2 f1(x) 2f2(x) 2 f4(x),
where a1, a2, a4, h1, h2, and h4 are estimated parameters. The phenotypic distributions were computed by using these allelic distributions and by assuming each locus at Hardy-Weinberg equilibrium. The phenotype was considered to be a three-state or seven-state random variable for the Ace.1 and Ester locus, respectively (see Table 1). The likelihood of a sample was computed from the phenotypic multinomial distri-bution.
Departure from Hardy-Weinberg proportions was tested in each population at the Ester locus by a likelihood ratio test. For an overall test, P values of each test were combined across populations using Fisher’s method (Manly 1985). At the Ace.1 Figure 1.—Samples location. The dashed line represents locus, departure from Hardy-Weinberg cannot be evaluated the limit between the treated and untreated area. because only three phenotypes are identified for three alleles. The presence of the Ace.1RSallele creates an apparent excess
of [RS] when only the two alleles Ace.1Rand Ace.1Sare
consid-ered. If Hardy-Weinberg proportions are assumed at this
Theoretical expectations:Let us consider first the case of
locus, Ace.1RSfrequencies can be computed from this
appar-one locus. Let us note 1-si and 1-c, the probability that a
ent excess of [RS], and an additional cline of allele frequency susceptible and a resistant homozygote survive exposure to
can be fitted. insecticide, and 1 and 1-c, the probability that they survive in
A linkage disequilibrium measure D5 freq{S,O} 2 freq{S} 3 the absence of insecticide. Further, si represents the fitness
freq{O} was computed for each population and tested by an decrease due to insecticide exposure, and c the fitness cost of
exact test on the contingency table ({S},{R})3 ({O},{E}) using resistance. In the Montpellier area, insecticide treatments are
the Genepop software (ver. 3.1a; Raymond and Rousset restricted to the coastal belt (between 0 and L kilometers from
1995). P values of each test were combined across populations the sea). For one locus with two alleles, the fitness of each
using Fisher’s method. genotype can be written as follows:
Simulations:In order to estimate migration and selection, resistant homozygotes: 11 sg(x) we used deterministic simulations to infer the allelic distribu-heterozygotes: 11 dsg(x) tion at equilibrium because the analytical solution is intracta-susceptible homozygotes: 12 sg(x) ble and requires the assumption of weak selection. One-dimen-sion clines were simulated by a series of demes connected by s5 (si 2 c)/(2 2 c 2 si)
migration as described in Mallet and Barton (1989). The g(x)5 1 for 0 < x , L
migration distribution was reflected at one edge of the step-g(x)5 2a2 for x. L
ping stone to simulate a semi-infinite environment. The proba-a25 c/s(2 2 c),
bility P of an individual in deme a migrating into deme a2 with
t1 i was calculated using a symmetric binomial distribution B(2t, 1/2) corrected by the reflecting condition when a, t. where d is the dominance level (21 , d , 1), x the distance
from the coast, s the intensity of selection, anda2the ratio
of the selection coefficient for x. L and 0 # x , L. If 2(t2 a) 2 i 2 1 . 0, For codominance (d 5 0) and a 5 1, Nagylaki (1975)
showed that a cline may be maintained given that k. p/4, then P5 (1/2)2t3
31
2ti
2
11
2t
2(t2 a) 2 i 2 1
24
with k25 2sL2/s2wheres is the standard deviation ofparent-offspring distance measured along one dimension. Such clines
cannot be characterized only by their slope, in contrast to else P5 (1/2)2t 3
1
2ti
2
. numerous other cases (Barton and Gale 1993), because theyThe migration variance was measured byε2t/2, which is the
variance of this distribution when a. t and whereεis the distance between demes. Selection coefficients were combined additively. The order of the processes was assumed to be repro-duction-migration-selection, as should be the case for C. pi-piens.
Migration and selection estimations:The method of estima-tion is based on the principle that all resistance allele frequen-cies should be clinal, decreasing from south to north (Figure 1). As a consequence, the mixing of genotypes by migration from populations along these clines should create heterozy-gote deficiencies at each locus (Wahlund effect) and positive linkage disequilibrium between loci. This disequilibrium is predicted to be maximal at a medium distance from the coast (x≈L) where the most dissimilar genotypes are mixed. Migra-tion and selecMigra-tion parameters were estimated conjointly such that the expected frequencies, computed using the simulation described above, and observed frequencies were as close as possible.
We focused our study on the differences between suscepti-ble and resistance alleles within and between loci rather than on the transient polymorphism or allele replacements at each locus. For such a purpose, we pooled individuals carrying at least one resistance allele at each locus. The phenotype was considered therefore to be a four-state ({S,O}, {S,E}, {R,O} and {R,E}; see Table 1) random variable, and the likelihood of a sample was computed from its multinomial distribution. Eleven parameters are needed to describe the system. Among them, three can be estimated from external data: the recombi-nation rate (r5 14.5%), the size of the treated area (L 5 20 km), and the epistasis for resistance (zero). Furthermore, we assumed that epistasis for fitness costs was negligible. These estimations and assumptions allowed us to investigate the se-lection intensities (sa,aafor the Ace.1 locus and se,ae, for the
Ester locus) and the migration variance (s2). To evaluate the
influence of the dominance level on the estimation of the migration variance, three cases of dominance for both loci were considered: recessivity (d5 21), codominance (d 5 0), and dominance (d5 1). The influence of the recombination rate was also investigated for codominance at both loci.
Model comparisons and tests: Maximum likelihood esti-mates (MLE) of parameters were computed conjointly using the Metropolis algorithm adapted from N. H. Barton (Szy-mura and Barton 1986). G-tests were computed between related models and scaled to the dispersion of residual devi-ance (Crawley 1993). The support limits of a particular pa-rameter were defined as the range of values within two units of log-likelihood from the maximum (Edwards 1972).
RESULTS
Resistance allele frequencies and linkage disequilib-ria:The frequencies of the different phenotypes com-bined at both loci are given in Table 2. The Hardy-Weinberg expectation was not rejected at the Ester locus (global test over populations P5 0.87). The linkage disequilibrium estimates between Ester and Ace.1 (D) and their corresponding P value are indicated in Table 2. A positive D is observed (Table 2, D. 0, combined test across populations P5 5.1025) that peaks (4–6%) near the ecotone transition, which is consistent with a linkage disequilibrium created by migration.
Descriptive models:At the Ace.1 locus, a clinal pattern is detected for both Ace.1Rand Ace.1RSalleles (Table 3).
TA B L E 2 Phenotype frequencies along the transect [RR] [RS] [SS] Locality km N [0] [1] [2] [4] [41] [42] [21] [0] [1] [2] [4] [41] [42] [0] [1] [2] [4] [41] D(%) P Perols 2.2 124 0.07 0.04 0.01 0.20 0.03 0.02 0.0 0.09 0.06 0.02 0.33 0.10 0.01 0.01 0.01 0.0 0.0 0.01 0.4 0.43 Maurin 3.4 186 0.04 0.02 0.0 0.10 0.03 0.0 0.0 0.15 0.06 0.0 0.48 0.09 0.01 0.01 0.0 0.0 0.02 0.01 2 0.02 1 Cournont 13 91 0.03 0.04 0.0 0.11 0.01 0.0 0.0 0.14 0.08 0.01 0.33 0.09 0.02 0.04 0.03 0.0 0.04 0.01 1.5 0.45 St. Gely 21 93 0.03 0.02 0.0 0.04 0.01 0.0 0.0 0.23 0.10 0.0 0.26 0.02 0.0 0.18 0.0 0.01 0.10 0.0 5.5 0.024 Triadou 25 62 0.03 0.02 0.0 0.06 0.0 0.0 0.0 0.16 0.06 0.0 0.31 0.0 0.0 0.19 0.05 0.0 0.11 0.0 4.1 0.097 Viols 30 176 0.01 0.01 0.0 0.0 0.0 0.0 0.0 0.20 0.02 0.0 0.19 0.01 0.0 0.36 0.03 0.02 0.14 0.02 3.8 0.046 St. Martin 34 154 0.01 0.0 0.0 0.02 0.0 0.0 0.0 0.29 0.02 0.0 0.18 0.01 0.01 0.35 0.02 0.0 0.09 0.0 5.1 0.01 NotreDame 35 86 0.0 0.0 0.0 0.02 0.0 0.0 0.01 0.23 0.03 0.0 0.14 0.0 0.0 0.45 0.0 0.0 0.12 0.0 6.3 0.018 St. Bauzille 44 132 0.02 0.0 0.0 0.01 0.0 0.0 0.0 0.23 0.01 0.01 0.14 0.01 0.0 0.39 0.05 0.0 0.13 0.01 1.8 0.46 Ganges 49 89 0.0 0.0 0.0 0.0 0.0 0.0 0.0 0.16 0.01 0.0 0.04 0.0 0.0 0.56 0.01 0.0 0.21 0.0 2 0.4 1 For each locality, distance is indicated from the coast in kilometers (km), the sample size (N ), the frequencies of the different phenotypes (see Table 1 for nomenclature), and the value of the estimated linkage disequilibrium D (in percent) and its associated P value (using an exact test; see text).
1387 Gene Flow in Culex pipiens
TABLE 3 1975 and Figure 2a), but is shifted 8 km into the un-treated area.
Descriptive fit tests
Effect of the linkage: As in the case of a single locus,
the ratio of selection intensities in treated and untreated
Locus Model Deviance %TD Scaled G-test
areas (a2) and the selection-migration ratio (k) depend
Ester a1, a2, a4 71.90 0.77 —
only on the relative magnitude of selection vs. gene flow
a15 0, a2, a4 132.64 0.58 ,0.00001
for each locus (data not shown). However, the linkage
a1, a25 0, a4 78.20 0.75 0.012
between the two loci (14.5%) has a noticeable effect
a1, a2, a45 0 211.11 0.32 ,0.00001
on the Ester locus: in order to maintain the Ester cline
Ace.1 aR, aRS 55.65 0.88 —
at the same frequency in the absence of selection on
aR5 0, aRS 189.66 0.58 ,0.00001
Ace.1, selection (or k2) would have to be 26% higher.
aR, aRS5 0 74.91 0.83 0.017
In contrast, to maintain the Ace.1 cline at the same
For each allele, the presence of a cline was tested using the
level, k2 need only be increased by 7% in the absence
descriptive models described in the text. “Model” indicates
of selection on the Ester locus.
the fitted parameters. At the Ester locus, parameters a1, a2,
and a4 correspond to the Ester1, Ester2, and Ester4alleles, respec- Dominance effect: The different hypotheses of
domi-tively. At the Ace.1 locus, aR and aRS refer to the Ace.1Rand
nance do not have an important effect neither on the
Ace.1RS alleles, respectively. “%TD” indicates the percent of
estimation of migration variance (s range 6.6–7.1) nor
the total deviance explained by the model. The P value of the
on its support limits (Table 5). In fact, for given
fre-scaled G-test is indicated in the last column.
quency gradients, the estimation depends mainly on the linkage disequilibrium pattern, as previously pointed (0.33 on the coast, Table 4) is thus strongly supported, out by Barton (1982).
and its cline explains well the pattern of apparent excess Recombination effect: The estimate of the migration
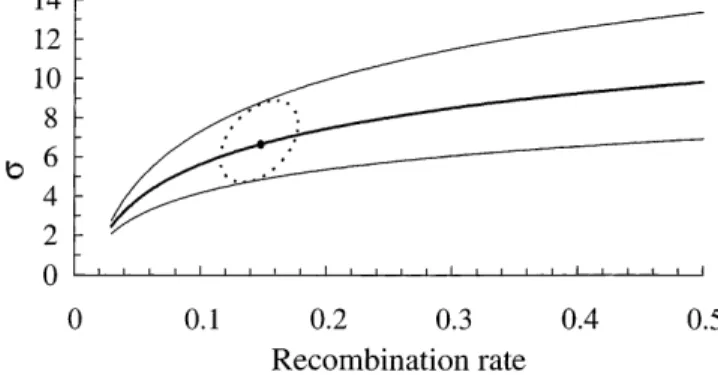
of heterozygotes in the transect. These two similar clines variance strongly depends on the recombination rate explain 88% of the total deviance at Ace.1 locus. How- between Ace.1 and Ester : for the same migration variance, ever, the frequency of the duplicated allele Ace.1RS is
the closer the loci the higher the linkage disequilib-underestimated by assuming Hardy-Weinberg propor- rium. The recombination rate (r) of 14.5% was esti-tions because a heterozygote deficiency due to migra- mated between Ester and Ace.1 based on 503 indi-tion is expected. At the Ester locus, the model explains viduals ( T. Lenormand, T. Guillemaud, D. Bourquet 77% of the total deviance. Significant and similar clinal and M. Raymond, unpublished results). Figure 3 shows patterns were found for all esterase resistance alleles, the joint support area for r and s, assuming codomi-even for Ester2, which is rare (Tables 3 and 4). These nance at both loci. Support limits ofs are not affected
results are consistent with the hypothesis that, for each by error measurements on the recombination rate (see locus, the selection pressures acting on resistance alleles Figure 3).
are similar, that is, that the main differences in selection Selection intensities: Estimations of selection intensities
pressure are between susceptible and resistance alleles. may not be as robust as the estimation ofs, because
Migration-selection models:The migration-selection they depend on the assumptions of dominance. How-models explain 92–93% of the total deviance (Table 5 ever, the different cases of dominance that were investi-and Figure 2). The maximum likelihood estimate of the gated are not equally likely (Table 5). In particular, parent-offspring standard deviation measured on one models considering dominance at Ace locus (models dimension iss 5 6.6 km.gen21/2(support limits 4.8–8.7 A–C in Table 5) are z20 times less likely than those km.gen21/2) when codominance is assumed at both loci. that consider recessivity (models G–I). In contrast, for It should be underlined that the expected linkage dis- a given dominance on the Ace.1 locus, there are no equilibrium does not peak at the ecotone transition, as noticeable differences between models considering dif-ferent dominance levels on the Ester locus. When consid-in the case of an consid-infconsid-inite environment (see Slatkconsid-in
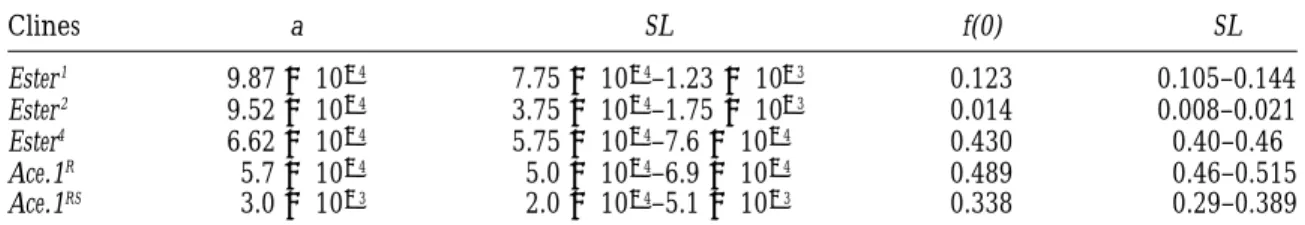
TABLE 4 Descriptive fit estimates
Clines a SL f(0) SL Ester1 9.873 1024 7.753 1024–1.233 1023 0.123 0.105–0.144 Ester2 9.523 1024 3.753 1024–1.753 1023 0.014 0.008–0.021 Ester4 6.623 1024 5.753 1024–7.63 1024 0.430 0.40–0.46 Ace.1R 5.73 1024 5.03 1024–6.93 1024 0.489 0.46–0.515 Ace.1RS 3.03 1023 2.03 1024–5.13 1023 0.338 0.29–0.389
Estimated parameters for each allelic cline, where the gene frequency is a function of distance to the sea f(x)5 f(0)e2ax2, with f(0) being the maximum frequency. “SL” indicates the support limits.
TABLE 5
Selection-migration models: different cases of dominance
Model da de s SL sa se a2a a2e Deviance (%TD) A 1 1 6.9 5.0–9.4 0.2 0.067 0.2 0.32 41.0 (91.8) B 1 0 7 5.0–9.2 0.2 0.064 0.21 0.52 40.2 (92.0) C 1 21 7.1 5.2–9.4 0.2 0.08 0.22 1.47 37.7 (92.5) D 0 1 6.7 4.9–8.9 0.13 0.056 0.45 0.35 38.0 (92.4) E 0 0 6.6 4.8–8.7 0.125 0.055 0.46 0.59 37.0 (92.7) F 0 21 6.8 4.9–9.0 0.13 0.062 0.49 1.58 37.5 (92.6) G 21 1 6.8 4.9–9.2 0.12 0.054 1.16 0.38 33.3 (93.4) H 21 0 6.7 4.8–8.9 0.11 0.05 1.21 0.65 33.3 (93.4) I 21 21 6.6 4.7–8.8 0.11 0.051 1.25 1.77 33.4 (93.4)
Three cases of dominance were considered at each locus. daand deare the dominance cases associated with
the Ace.1 and Ester loci, respectively. The MLE and the support limits (SL) ofs is indicated in each case, as well as the MLE of selection intensity (saand se) and selection ratio (a2aanda2e) associated with each locus.
The residual deviance of each model and the percent of total deviance explained by each model (%TD) are indicated in the last columns.
ering only the most likely models (E–I), selection inten- External estimation of parameters: We supposed that the
summer clines were observed at migration-selection sity is likely to be z0.12 on Ace.1 (sa) and z0.055 on
Ester (se). For codominance at both loci (model E), these equilibrium. This is of course not exactly true, because
selection intensities vary during the year. However, the selection intensities give an estimate of the insecticide
selection pressure (si ≈ 0.30 for Ace.1 and ≈0.16 for high selection pressure and migration variance esti-mated are consistent with very rapid adjustments of
fre-Ester) and of the intensities of the fitness costs (c≈0.11
and≈0.06 for Ace.1 and Ester, respectively). quencies. Moreover, frequencies, as well as selection intensities, are autocorrelated in time: adjustments to selection intensities require only limited changes in
fre-DISCUSSION
quency.
We assumed a symmetric binomial migration
distribu-Validity of the assumptions: The analysis of clinal
patterns allowed us to infer in a single step the different tion with a reflecting condition on the sea coast. Depar-tures from this assumption could exist due to several parameters that are relevant to describe the dynamics
of local adaptation, i.e., gene flow and selection coeffi- factors. First, the migration distribution may be more leptokurtic. This may not strongly affect the peak of cients in the different part of the environment for each
locus. Additionally, the model developed permits us to linkage disequilibrium at the ecotone transition (see Mallet et al. 1990), but further work is required to explain 92% of the total deviance of the data in a quite
economical manner. However, many simplifications settle this issue. Second, it is possible that density varia-tions may cause asymmetric flux of migrants. These were assumed, and external estimations were used for
some parameters. We will discuss these points in turn. variations in density may be caused by the control of mosquito populations in the treated area, which affects
Models of selection: We assumed that the different
resis-tance alleles at each locus were subjected to the same population sizes. However, the number of favorable lar-val breeding sites varies as well and would tend to com-selection pressure. This is probably not true since allele
replacements were observed over the last 20 years (Guil- pensate for this effect: the density of C. p. pipiens larval sites are associated with human activity, which is more lemaudet al. 1998). However, the rate of these
replace-ments is quite low, at least for the Ester locus, and can important in the treated (urban and peri-urban areas) than in the untreated areas (countryside). Third, be-be explained by fitness differences be-between resistance
alleles that are much lower (1–2%) than those between cause the density of hosts (for blood feeding) and of larval sites is likely to vary along the transect, the hypoth-resistance and susceptible alleles (Guillemaud et al.
1998). Additionally, the fitted selection intensities may esis of a constant migration variance may be violated if most of the migration variance is due to foraging behav-mainly represent those associated with the most
com-mon alleles. This is especially true for the Ester locus: ior (search for a blood meal and a site to lay eggs; Reisen et al. 1991). Fourth, the pattern of cytoplasmic among individuals that carry at least one resistance
al-lele, only 15% lack the Ester4 allele. The situation may incompatibilities caused by Wolbachia endosymbionts
may cause local variation of the effective migration vari-not be as clear for the Ace.1 locus, where both the Ace.1R
and the duplicate Ace.1RS alleles are present in non- ance (Magnin et al. 1987). For these reasons, the
effec-tive migration estimated in the Montpellier area may negligible frequencies and where the rate of allele
1389 Gene Flow in Culex pipiens
Figure 3.—Maximum likelihood estimates (bold line) of the standard deviation of parent-offspring distance (s in km·gen21/2) as a function of the recombination rate (r)
be-tween the Ace.1 and Ester loci. Outer lines correspond to the support limits of s. The small circle is the joint maximum likelihood of r ands, and the dashed ellipse the joint support area for both r ands.
quinquefasciatus. Over a period of 12 days, Reisen et al.
report an mdt between 0.6 and 1 km (1991) or 2 km (1992) for C. p. quinquefasciatus (which are both strongly biased; see above), and O’Donnell et al. (1992) esti-mated an mdt of 6.8 km for C. annulirostris. Given an average of 8–10 days from adult emergence to the first oviposition (Lowe et al. 1973; Smittle et al. 1973; Weid-haaset al. 1973), these estimates are in agreement with ours (6.6 km·gen21/2corresponds to an mdt of 0.66–0.82 km/day), although it appears that mark-recapture ex-periments should be performed on a larger scale to give more reliable estimates of dispersal for Culex species.
Migration-drift equilibrium: The relative magnitude of
gene flow vs. drift has been evaluated in southern France
Figure2.—Fitted and observed clines and linkage
disequi-by Chevillon et al. (1995), using allozymic markers.
librium. (a) Linkage disequilibrium D (see text); (b) {S,O}
Their study supports the hypothesis that migration
out-frequency; (c) {R,O} out-frequency; (d) {S,E} out-frequency; (e) {R,E}
weighs drift in C. p. pipiens populations, which is in good
frequency. Circles represent observed values and lines fitted
values for codominance at both loci (see text). agreement with our high estimate of migration variance. However, our estimate of s allows us to disentangle drift and migration and to estimate average effective
Comparison with other estimates: Direct measures of population densities. We reanalyzed the allozymic data
dispersal: Many studies have investigated the active dis- from Chevillon et al. (1995), using the method de-persal of Culex species by mark-recapture experiments. scribed in Rousset (1997). Samples were collected in Although none consider C. p. pipiens, plenty of data is 31 localities distributed along the Mediterranean coast available for C. p. quinquefasciatus, the tropical subspe- (southern France and northern Spain) and analyzed at cies of C. pipiens (Mattingly et al. 1951), and other five loci. A regression of FST/(12FST) estimates computed
Culex species. These dispersal estimations are often bi- for pairs of subpopulations on the logarithm of geo-ased toward low values either as a consequence of the graphical distance was performed using the Genepop small areas investigated (4 km, Morris et al. 1991; Rei- software (ver. 3.1a; Raymond and Rousset 1995). A senet al. 1991; 1.5 km, Schreiber et al. 1988) or of the significant isolation by distance was detected (Mantel absence of correction for dilution of sampling effort test, P5 0.0123). The slope of this regression was used with distance (Reisen et al. 1991, 1992). In all these to estimate 1/(4 De.ps2), where De is the density of studies, some individuals were trapped close to the limit mosquitoes (Rousset 1997). The estimate of De.s2 is of the trapping grid. Morris et al. (1991) report a mean 16.3 individuals. Using our estimate of s 5 6.6 distance traveled (mdt) per day for three Culex species km·gen21/2, the estimate of the density De is 0.37 individ-(0.73, 0.76, and 0.84 km for C. erraticus, C. nigripalpus, uals per km2. This result is surprising when compared and C. salinarius, respectively), and Schreiber et al. to the mosquito densities observed in the field during the breeding season (104–107 individuals/km2; Reisen (1988) report a mdt of 1.27 km after 36 hr for C. p.
et al. 1991, 1992; Lindquist et al. 1967). This strongly mating gene flow from selected loci, the selection sure is taken explicitly into account. This situation pres-suggests that mosquito populations are heterogeneous
in space, that they vary seasonally, and that they endure ents different advantages. First, there is no need to formulate ad hoc hypotheses concerning neutrality of severe bottlenecks. A simple explanation of these results
would be the low density of the founders in early spring. markers; second, few markers are needed; and third, predictable frequency patterns are expected and can High mortality rates during overwintering (up to 80–
90%; Minar and Ryba 1971; Sulaiman and Service be tested. However, this method requires that some genes be identified that are subjected to clear selection 1983) and between pupation and oviposition (90%;
Loweet al. 1973; Weidhaas et al. 1973) have been re- pressures and that some conclusion be made a priori concerning these selection pressures. Additionally, this ported, and weather-related mortality is likely to occur
in the spring due to a fall of temperature after warming method permits working at a restricted scale in time and space where assumptions of constant population periods. Finally, it is also possible that the De estimate
is not totally accurate due to the different scales of the sizes and homogeneity of space are the most reliable. In particular, it is possible to take explicitly into account two approaches.
Selection intensities: We found that insecticide selection specific features of the environment (e.g., presence of geographic barriers), if needed. The drawback is that on Ace.1 locus (si≈0.30) was higher than on Ester locus
(si≈ 0.16). This is consistent with the resistance ratio such estimates can hardly be representative of other environmental conditions because they are not aver-associated with these loci: the insensitive AChE1 confers
a higher level of resistance. However, even if selection aged over a long period of time and over large geo-graphic areas. However, they provide an “instantaneous” has been clearly associated with OP insecticides, it has
never been measured in natural populations. The evalu- measure of dispersal that is the most pertinent for the area, the period, and the scale considered, especially in ation of fitness costs is even less straightforward because
all fitness components can be influenced during both the case of recent local adaptation. In this respect, these measures may be comparable to mark-recapture esti-larval and adult stages. For example, esti-larval development
time, fecundity, susceptibility to parasites or predators, mates. However, direct measures of dispersal do not provide estimates of effective gene flow and may miss ability to blood feed, etc., can be modified by the
pres-ence of resistance genes (e.g., Wood and Bishop 1981; long-distance migrants because individuals are often trapped at the limit of the trapping grid.
Roush and McKenzie 1987). For C. p. pipiens, some
fitness costs on larval development time and female We have estimated gene flow using two selected ge-netic markers. This estimation is an essential step in fecundity have been experimentally found in natural
populations (Bourguet 1996). The presence of the understanding the dynamics of selected genes when selection pressures vary in space and time. We have
Ace.1Rallele increased the generation time by 4.3%. In
an exponential growth phase of the population (during focused on the selection-migration equilibrium on a local scale, considering gene flow as a “constraining the spring), this difference gives an estimation of fitness
cost (c) between 0.07 and 0.13 for an effective fecundity force” reducing the potential for local adaptation. How-ever, on a much wider scale, gene flow is also responsible between five and 25 offspring. This estimation may be
conservative, because only larval development time is for the spread of resistance alleles across the species range mainly by passive migration (Qiao and Raymond taken into account and indicates that our estimates are
not overestimated (c≈0.11 and 0.06 for Ace.1 and Ester, 1995; Guillemaud et al. 1996 and reference therein). At these two scales, gene flow may not be comparable, respectively).
Conditions for the maintenance of Ace.1 and Ester playing either a conservative or a creative role.
clines:Both clines maintain each other. Their concomi- We are very grateful to C. Chevillon, N. Pasteur, F. Rousset tant presence makes the conditions for their mainte- and J. Britton-Davidian for their helpful comments and discussion about the manuscript. This work was financed by Groupement de
nance less strict than if they were alone. However, this
Recherche 1105 du programme Environnement, Vie et Socie´te´s du
effect concerns mainly the least selected locus, Ester. We
Centre National de la Recherche Scientifique, the Re´gion
Languedoc-computed that the frequencies of Ester0 and Ace.1S in
Roussillon (no. 963223) and ACC SV3 (no. 9503037). T.L. was
sup-coastal populations would be 0.074 and 0.013 higher, ported by an ASC from Institut National de la Recherche Agronom-respectively, if each locus was considered independently ique. Contribution 98.062 of the Institut des Sciences de l’Evolution
de Montpellier (UMR CNRS 5554).
from the other. Using the estimates of migration and selection provided by model E (codominance at both loci), the Ester cline would disappear if the width of the
treated area (L) was reduced to 11 km. Similarly, the LITERATURE CITED
Ace.1 cline is not maintained when L , 7 km. In an Anonymous, 1990–1995 Rapport d’activite´ technique et scienti-fique. Entente Interde´partementale pour la De´moustication du
infinite and uniform environment, the minimum size
Littoral Me´diterrane´en, Montpellier, France.
of a potential adaptive pocket would therefore bez15
Barton, N. H.,1982 The structure of the hybrid zone in Uroderma
km for codominance at both loci. bilobatum (Chiroptera: Phyllostomatidae). Evolution 36: 863–866.
Barton, N. H.,and K. S. Gale, 1993 Genetic analysis of hybrid
esti-1391 Gene Flow in Culex pipiens
zones, pp. 13–45 in Hybrid Zones and the Evolutionnary Process, measure of clines width and linkage disequilibrium in Heliconius hybrid zones. Genetics 124: 921–936.
edited by R. G. Harrison. Oxford University Press, Oxford, UK.
Manly, B. F. J.,1985 The Statistics of Natural Selection. Chapman and Barton, N. H.,and G. M. Hewitt, 1985 Analysis of hybrid zones.
Hall Ltd., London. Ann. Rev. Ecol. Syst. 16: 113–148.
Mattingly, P. F., L. E. Rozemboom, K. L. Knight, H. Laven, S. R. Bourguet, D.,1996 Me´canismes biochimiques, plasticite´ et
e´volu-Drummondet al., 1951 The Culex pipiens complex. Trans. R. tion de la dominance. Ph.D. Thesis. Universite´ Montpellier II,
Ent. Soc. Lond. 102: 331–342. Sciences et Techniques du Languedoc, Montpellier, France.
Minar, J.,and J. Ryba, 1971 Experimental studies on overwintering Bourguet, D., M. Raymond, D. Fournier, D. Malcolm, P. Toutant
conditions of mosquitoes. Folia parasitologica (Praha) 18: 255–
et al., 1996a Existence of two acetylcholinesterases in the
mos-259. quito Culex pipiens complex (Diptera: Culicidae). J. Neurochem.
Morris, C. D., V. L. Larsonand L. P. Lounibos, 1991 Measuring
67:2115–2123.
mosquito dispersal for control programs. J. Am. Mosq. Cont. Bourguet, D., R. Capelaand M. Raymond, 1996b An insensitive
Assoc. 7: 608–615. acetylcholinesterase in Culex pipiens L. mosquitoes from Portugal.
Nagylaki, T.,1975 Conditions for the existence of clines. Genetics J. Econom. Entomol. 89: 1060–1066.
80:595–615. Bourguet, D., M. Raymond, J. Bisset, N. Pasteurand M. Arpagaus,
O’Donnell, M. S., G. Berry, T. Carvanand J. H. Bryan, 1992 Dis-1996c Duplication of the Ace.1 locus in Culex pipiens from the
persal of adult females of Culex annulirostris in Griffith, New South Caribbean. Biochem. Genet. 34: 351–362.
Wales, Australia. J. Am. Mosq. Cont. Assoc. 8: 159–165. Bourguet, D., M. Proutand M. Raymond, 1996d Dominance of
Pasteur, N., A. Isekiand P. Georghiou, 1981a Genetic and bio-insecticide resistance presents a plastic response. Genetics 143:
chemical studies of the highly active esterases A and B associated 407–416.
with organophosphate resistance in mosquitoes of the Culex pi-Bourguet, D., N. Pasteur, J. Bissetand M. Raymond, 1996e
Deter-piens complex. Biochem. Genet. 19: 909–919.
mination of Ace.1 genotypes in single mosquitoes: toward an
Pasteur, N., G. Sinegreand A. Gabinaud, 1981b Est-2 and Est-3 ecumenical biochemical test. Pest. Biochem. Physiol. 55: 122–128.
polymorphisms in Culex pipiens L. from southern France in rela-Chevillon, C., N. Pasteur, M. Marquine, D. Heyseand M.
Ray-tion to organophosphate resistance. Biochem. Genet. 19: 499– mond, 1995 Population structure and dynamics of selected
508. genes in the mosquito Culex pipiens. Evolution 49: 997–1007.
Pasteur, N., G. Pasteur, F. Bonhommeand J. Britton-Davidian, Chevillon, C., D. Bourguet, F. Rousset, N. Pasteurand M.
Ray-1988 Practical Isozyme Genetics. Ellis Horwood Ltd., Chichester,
mond, 1997 Pleiotropy of adaptive changes in populations:
U.K. comparisons among insecticide resistance genes in Culex pipiens.
Poirie´ ,M.,1991 Me´canisme de de´toxification implique´s dans la Genet. Res. 70: 195–204.
re´sistance aux insecticides: glutathion transfe´rases et este´rases Crawley, M. J.,1993 GLIM for Ecologists. Blackwell Scientific
Publica-non spe´cifiques. Ph.D. Thesis. Universite´ Montpellier II, Sciences tions, Oxford, UK.
et Techniques du Languedoc, Montpellier, France. de Stordeur, E.,1976 Esterases in the mosquito Culex pipiens pipiens
Poirie´ , M., M. Raymondand M. Pasteur, 1992 Identification of L.: formal genetics and polymorphism of adult esterases.
Bio-two distinct amplifications of the esterase B locus in Culex pipiens chem. Genet. 14: 481–493.
(L.) mosquitoes from Mediterranean countries. Biochem. Genet. Edwards, A. W. F.,1972 Likelihood. Cambridge University Press,
30:13–26. Cambridge.
Qiao, C.-L.,and M. Raymond, 1995 The same esterase B1 haplotype Endler, J. A., 1977 Geographic variation, speciation and clines.
is amplified in insecticide resistant mosquitoes of the Culex pipiens Princeton University Press, Princeton, NJ.
complex from the Americas and China. Heredity 74: 339–345. Felsenstein, J.,1976 The theoretical population genetics of variable
Raymond, M.,and M. Marquine, 1994 Evolution of insecticide selection and migration. Annu. Rev. Genet. 10: 253–280.
resistance in Culex pipiens populations: the Corsican paradox. J. Fisher, R. A., 1937 The wave of advance of advantageous genes.
Evol. Biol. 7: 315–337. Ann. Eugen. 7: 353–369.
Raymond, M.,and F. Rousset, 1995 Genepop version 1.2: popula-Guillemaud, T., S. Rooker, N. Pasteur and M. Raymond, 1996
tion genetics software for exact tests and ecumenicism. J. Hered. Testing the unique amplification event and the worldwide migra- 86:248–249.
tion hypothesis of insecticide resistance genes with sequence data.
Raymond, M., D. Fournier, J.-M. Bride, A. Cuany, J. Berge´ et al., Heredity 77: 535–543. 1986 Identification of resistance mechanisms in Culex pipiens Guillemaud, T., N. Makate, M. Raymond, B. Hirstand A.
Cal-(Diptera: Culicidae) from southern France: insensitive acetylcho-laghan,1997 Esterase gene amplification in Culex pipiens.
In-linesterase and detoxifying oxidases. J. Econom. Entomol. 79: sect Mol. Biol. 6: 319–327. 1452–1458.
Guillemaud, T., T. Lenormand, D. Bourguet, C. Chevillon, N.
Raymond, M., N. Pasteurand G. P. Georghiou, 1987 Inheritance Pasteur et al., 1998 Evolution of resistance in Culex pipiens :
of chlorpyrifos resistance in Culex pipiens L. (Diptera: Culicidae) allele replacement and changing environment. Evolution. (in and estimation of the number of genes involved. Heredity 58:
press). 351–356.
Lande, R.,1985 The fixation of chromosomal rearrangements in a
Raymond, M., D. Heckeland J. G. Scott, 1989 Interaction between subdivided population with local extinction and colonization. pesticide genes: model and experiment. Genetics 123: 543–551. Heredity 54: 323–332. Reisen, W. K., M. M. Milby, R. P. Meyer, A. R. Pfuntner, J. Spoehel Lindquist, A. W., T. Ikeshoji, B. Grab, B. De Meillonand Z. H.
et al., 1991 Mark-release-recapture studies with Culex mosquitoes Khan,1967 Dispersion studies of Culex pipiens fatigans tagged
(Diptera: Culicidae) in southern California. J. Med. Entomol. 28: with32P in the Kemmendine area of Rangoon, Burma. Bull. Org.
357–371.
mond. Sante´ 36: 21–37. Reisen, W.K., M. M. Milby and R. P. Meyer, 1992 Population Lowe, R. E., H. R. Ford, B. J. Smittleand D. E. Weidhaas, 1973 dynamics of adult Culex mosquitoes (Diptera: Culicidae) along Reproductive behavior of Culex pipiens quinquefasciatus released the Kern river, Kern county, California, in 1990. J. Med. Entomol. in natural populations. Mosq. News 33: 221–227. 29:531–542.
Magnin, M., N. Pasteurand M. Raymond, 1987 Multiple incompat- Rivet, Y., M. Raymond, J.-A. Rioux, A. Delabreand N. Pasteur, ibilities within populations of Culex pipiens L. in southern France. 1994 Resistance monitoring in Culex pipiens L. from central Genetica 74: 125–130. eastern France. J. Med. Entomol. 31: 231–239.
Malcolm, C., D. Bourguet, A. Ascolillo, S. J. Rooker, C. F. Garvey Rooker, S., T. Guillemaud, J. Berge´ , N. Pasteurand M. Raymond,
et al., 1998 A sex-linked Ace gene, not linked to insensitive acetyl- 1996 Coamplification of esterase A and B genes as a single unit cholinesterase-mediated insecticide resistance in Culex pipiens. in the mosquito Culex pipiens. Heredity 77: 555–561.
Insect. Mol. Biol. 7: 107–120. Roush, R. T.,and J. A. McKenzie, 1987 Ecological studies of insecti-Mallet, J.,and N. H. Barton, 1989 Inference from clines stabilized cide and acaricide resistance. Ann. Rev. Entomol. 32: 361–380. by frequency-dependent selection. Genetics 122: 967–976. Rousset, F.,1997 Genetic differentiation and estimation of gene Mallet, J., N. H. Barton, G. M. Lamas, J. C. Santisteban, M. M. flow from F-statistics under isolation by distance. Genetics 145:
1219–1228. Muedaset al., 1990 Estimates of selection and gene flow from
Schreiber, E. T., M. S. Mulla, J. D. Chaneyand M. S. Dhillon, collected Culex pipiens quinquefasciatus Say. Mosq. News 33: 215– 1988 Dispersal of Culex quinquefasciatus from a dairy in southern 220.
California. J. Am. Mosq. Cont. Assoc. 4: 300–304. Sulaiman, S.,and M. W. Service, 1983 Studies on hibernating popu-Severini, C., R. Romi, M. Marinucciand M. Raymond, 1993 Mech- lations of the mosquito Culex pipiens L. in southern and northern
anisms of insecticide resistance in field populations of Culex pi- England. J. Nat. Hist. 17: 849–857.
piens from Italy. J. Am. Mosq. Cont. Assoc. 9: 164–168. Szymura, J. M.,and N. H. Barton, 1986 Genetic analysis of a hybrid Sites, J. W., N. H. Barton and K. M. Reed, 1995 The genetic zone between the fire-bellied toads, Bombina bombina and Bombina structure of a hybrid zone between two chromosome races of variegata, near Cracow in southern Poland. Evolution 40: 1141– the Sceloporus grammicus complex (Sauria, Phrynosomatidae) in 1159.
central Mexico. Evolution 49: 9–36. Weidhaas, D. E., B. J. Smittle, R. S. Patterson, R. E. Loweand C. Slatkin, M.,1975 Gene flow and selection in a two locus system.
S. Lofgren,1973 Survival, reproductive capacity and migration Genetics 81: 787–802. of adult Culex pipiens quinquefasciatus Say. Mosq. News 33: 83–87. Slatkin, M.,1987 Gene flow and the geographic structure of natural
Wood, R. J.,and J. A. Bishop, 1981 Insecticide resistance: popula-populations. Science 236: 787–792. tions and evolution, pp. 97–127 in Genetic Consequences of Man-Slatkin, M.,and N. H. Barton, 1989 A comparison of three indirect
made Changes, edited by J. A. Bishop, and L. M. Cook. Academic
methods for estimating average levels of gene flow. Evolution 43:
Press, London. 1349–1368.
Smittle, B. J., R. E. Lowe, H. R. Fordand D. E. Weidhaas, 1973
Communicating editor: M. Slatkin Techniques for32P labeling and essay of egg rafts from