Catheter Based Magnetic Resonance Compatible
Perfusion Probe
by
Cara Lynne Toretta
Submitted to the Department of Nuclear Science and Engineering
in Partial Fulfillment of the Requirements for the Degrees of Bachelor of Science and Master of Science in Nuclear Science and Engineering
at the
Massachusetts Institute of Technology February 2007
© 2007 Massachusetts Institute of .Technology All rights reserved
Signature of Author
Certified by
,
,1
Aepart nt of Nuclear Science and Engineering
__ January 31, 2007
Dr. H. Frederick Bowman Senior Academic Administrator Thesis Supervisor
Certified by
V/
Iq. Jacquelyn C. Yanch
Professor of Nuclear Science-and Engineering Thesis Reader
Accepted by
I-
/. Dr. Jeffrey A. Coderre Dep rtment of Nuclear Science and Engineering Chairman, Department Committee on Graduate Students-MASSACHUSETTS INS-1ITUT1EL
OF
TECHNOLOGY
OCT 1
2 2007
ARCHIVES
- =ACatheter Based Magnetic Resonance Compatible
Perfusion Probe
by
Cara Lynne Toretta
Submitted to the Department of Nuclear Science and Engineering on January 31, 2007 in Partial Fulfillment of the Requirements
for the Degrees of Bachelor of Science and Master of Science in Nuclear Science and Engineering
Abstract:
Neurosurgeons are using a thermal based technique to quantify brain perfusion. The thermal diffusion probe (TDP) technology measures perfusion in a relatively small volume of brain tissue. The neurosurgeon chooses the specific brain location and probe placement based on their clinical concern. When an early indication of compromised perfusion is detected by the TDP, it is generally necessary to confirm the local, absolute perfusion measurement taken with the TDP, with magnetic resonance (MR) perfusion imaging. MR perfusion imaging provides an excellent, but relative, global assessment of compromised tissue perfusion. Due to the many clinical and diagnostic benefits of real-time, absolute quantification of blood flow acquired by the TDP, there has been increased interest in having the TDP MR compatible. This thesis considers what it would take to render the TDP MR compatible in both the active and passive modes. The analysis considers effects of the EM field on the probe, and the probe on the MR image. The presence of cardiac and respiratory induced brain motion has been shown to provide an artifact in TDP-perfusion data. Consideration is given to ways in which to minimize this motion induced perfusion artifact.
Thesis Supervisor: Dr. H. Frederick Bowman Title: Senior Academic Administrator
Thesis Reader: Dr. Jacquelyn C. Yanch
Table of Contents
Abstract Table of Contents List of Figures Chapter 1 -Introduction Chapter 2 -Perfusion 2.1 Function Anatomy2.2 Various Methods of Measuring Perfusion 2.2.1 Diffusible Tracer
2.2.2 MR Perfusion Techniques 2.2.3 DSC and ASL Techniques 2.2.4 Other Techniques
2.2.5 FAIR Technique 2.3 Continuous Perfusion Measuring
Chapter 3 - NMR Basics
3.1 NMR Theory
3.2 Phase Encoding to Study Velocity 3.3 Interventional MRI
Chapter 4 -Movement of the Brain, Spinal Cord, and Cerebrospinal Fluid
4.1 Introduction to Brain Motion 4.2 Functional Anatomy
4.2.1 Cardiac System 4.2.2 The Brain 4.3 Blood Flow
4.4 Cerebral Spinal Fluid
4.5 Blood Flow and Cerebral Spinal Fluid 4.6 Spinal Column
4.7 Cephalic and Caudal (Up and Down) Flow 4.7.1 Time after the R wave
4.8 Three-Dimensional Motion 4.9 Respiration
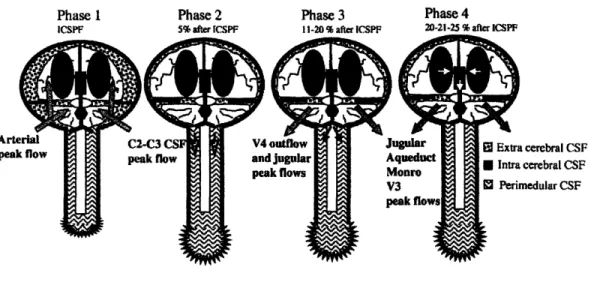
4.10 Cerebral Blood and CSF Flow Models
Chapter 5 - MR Perfusion Probe Considerations
5.1 Introduction to Probe Considerations 5.2 MR Compatible and Safe
5.3 Susceptibility 5.4 Device Movement 5.5 Magnetoresistance
5.5.1 Magnetoresistance and Doping
Page
41 41 42 42 46 48 52 61 66 67 70 76 79 80 81 81 81 82 90 96 100Chapter 6 - Comments and Recommendations for Further Work 103
6.1 Introduction 103
6.2 Thermal Diffusion Probe Considerations 103
6.3 Brain Motion Considerations\ 107
6.4 Recommendations and Suggestions for Further Works 110
List of Figures
Fig. 2.1: Schematic of the thermistor tip
Fig. 3.1: Diagram of the Laboratory and Rotating Frame of reference. Fig. 4.1: Electrocardiogram of a typical heart wave.
Fig. 4.2: The arterial blood supply to the brain from the Circle of Willis Fig. 4.3: The location of the main arteries in the brain
Fig. 4.4: The ventricles oriented inside the brain.
Fig. 4.5: Coronal view of the upper part of the brain and skull.
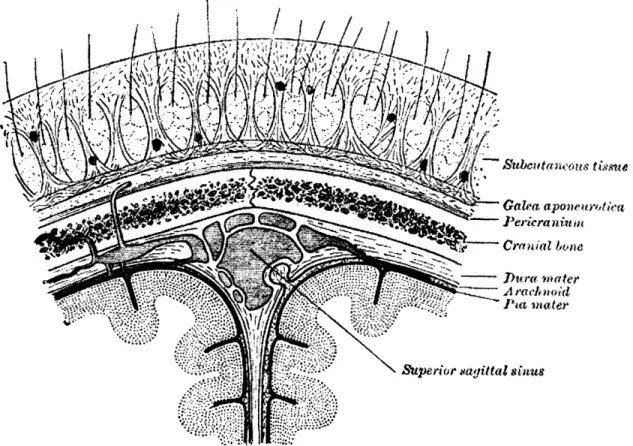
Fig. 4.6: Coronal view of the scalp centered around the superior sagittal sinus Fig. 4.7: Schematic of brain and CSF to depict the movement.
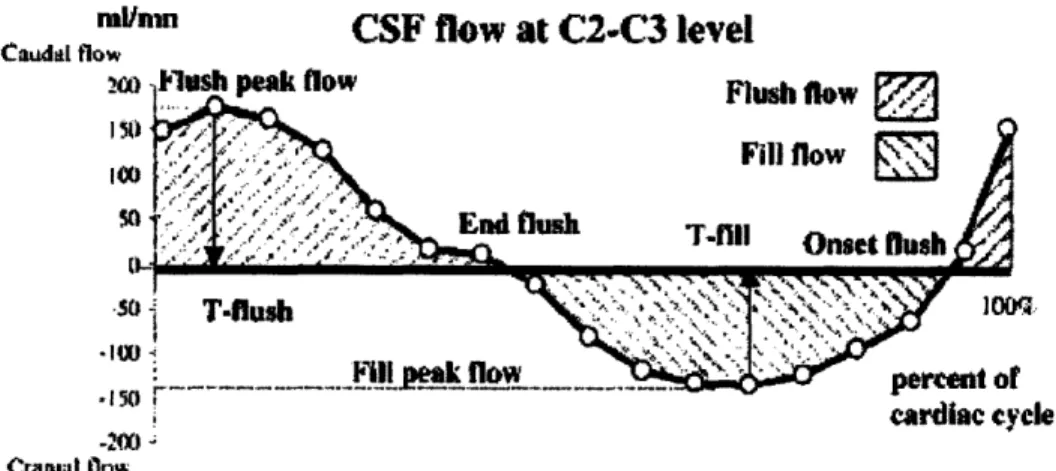
Fig. 4.8: CSF flow in a caudal and cranial motion Fig. 4.9: CSF flow due to brain expansion
Fig. 4.10: Volume changes in the blood and CSF
Fig. 4.11: Volume changes shown with respect to the arterial and venous pulsations
Fig. 4.12: Peak flows of specific anatomical areas Fig. 4.13: Blood and CSF relation
Fig. 4.14: Brainstem movement as a function of time
Fig. 4.15: Displacement in the tonsils, upper/lower brainstem, and posterior cerebellum
Fig. 4.16: Displacement of the hypothalums, frontal, pariental, and occipital lobes
Fig. 4.17: Displacement of brain structures
Fig. 4.18: Bar diagram of the physiological occurrences following the R-wave Fig. 4.19 a-e: Velocity of anatomical locations as a function of the cardiac cycle Fig. 4.20: Motion of the frontal part of the brain
Fig. 4.21: Motion of the Gray Nuclei
Fig. 4.22: Left and right velocity of the ventricles as a function of their position Fig. 4.23: Velocity profiles in three directions after the R-wave
Fig. 4.24: Brain stem displacement and flow velocity showing respiration Fig. 5.1: A susceptibility spectrum showing the relative susceptibilities Fig. 5.2: A mathematical diagram of the magnetic field
Fig. 5.3: Computer generated model, and actual artifact from a solid steel sphere
Fig. 5.4: Theoretical results of wire length vs. safety
Fig. 5.5: The magnetization, resistivity, and magnetoresistance of Lao.75Ca o.25MnO3
Fig. 5.6: Phase diagram of Lal-xCa xMnO3 as a function of temperature and
Chapter 1
-
Introduction
This project deals with the quantification of perfusion in brain tissue using the Thermal Diffusion Probe (TDP). The TDP provides local, real-time, continuous, and absolute values of perfusion. The TDP is currently used in neurosurgery by early adopters to monitor the level of brain perfusion (blood flow) during traumatic brain injury (TBI) and in those patients at risk for vasospasm subsequent to subarachnoid hemorrhage. The two major foci of this thesis are: 1) consideration of what it would take to render the TDP sensor probe MR compatible; and 2) consideration of cardiac induced brain tissue motion and the impact of that motion on the accuracy of TDP derived perfusion values.
Early indications of compromised brain perfusion detected regionally by the TDP are routinely confirmed by global CT-angiograms or MR perfusion scans. Currently, the non-MR compatible TDP sensor has to be removed from the patient before the MR scan
is conducted. Probe removal eliminates the acquisition of continuous perfusion data before, during, and after the scan. Following the MR scan, the clinician has to either forego post scan absolute monitoring or must insert a new TDP probe, which is costly. Furthermore, placement of a second probe risks the probe being situated in a different
location. This makes pre vs. post perfusion values a bit more complex to evaluate due to brain tissue flow heterogeneity. CT-angiograms and MR perfusion scans allow for global, though relative, analysis of compromised perfusion, while the TDP provides a local, though absolute, assessment of perfusion. Absolute perfusion values are extremely important for overall patient assessment. For example, if the flow in the human brain is
less than 15 ml/100g*min, the patient begins to lose brain function and if it is less than 7 ml/100g*min, the brain tissue begins to lose viability. Having a local /regional, but absolute measure of tissue perfusion improves patient diagnosis, early detection of ischemia and subsequent clinical management. While local/regional measures are valuable in identifying perfusion problems; global 3D perfusion assessment via CT-angiograms or MR perfusion scans are necessary to detect the extent of the problem. For these complementary reasons, clinicians have expressed interest in a TDP sensors which does not need to be removed during MR scans. This thesis considers what would be required to take MR scans with the TDP in place while operating in both active and passive modes.
Pulsatile flow components have recently been observed in brain perfusion data taken by the TDP that seems to match the frequencies associated with heart and respiration rates. This pulsatile flow component derives from a periodic motion artifact and may artificially elevate the measured perfusion levels. Cardiac and respiratory induced brain tissue motion gives rise to periodic relative probe-tissue motion, which causes a periodic
increase in power-time relationship, which often leads to an artificially elevated perfusion value. To remove or reduce this motion artifact, the motion frequency, direction, and amplitude have to be known and quantified. An appropriate thermal model may then be
developed and incorporated into the perfusion extraction algorithm to remove the effect of the motion artifact. Alternatively, one might design an appropriate probe
In conclusion, in addition to addressing what would render the TDP MR compatible, the work reported in this thesis seeks to identify the source(s), and to characterize the cardiac and respiratory induced brain motion that is present and which in turn influences the TDP power-time data. Once characterized, models, which are beyond the scope of this thesis, can be developed to isolate and remove the motion effects or positioning techniques may be conceived which will minimize the resulting relative probe-tissue motion and its associated artifact.
Chapter 2
-
Perfusion
2.1 Functional Anatomy
The cardiovascular system regulates blood flow. The main function of the cardiovascular system is to deliver nutrient carrying blood to the tissues while concurrently removing waste. The heart pumps the blood around the body through a closed system of blood vessels. The arteries carry blood away from the heart and are under higher pressure than the veins, which carry blood back to the heart. Arteries, or more accurately the pre-capillary arterioles feed the capillaries which have very thin walls that allow for the exchange of materials down their concentration gradient via diffusion. There is an exchange of oxygen, nutrients, waste, heat, and fluid across the capillary walls. Blood from the capillaries is collected by the venous system and returned to the heart. The cardiovascular system is also involved in the regulation of body temperature, blood pressure, and homeostasis.
The rate of blood flow, cardiac output, in the body operates in steady state, meaning that the rate of blood flow leaving the right ventricle (to the lungs) equals the rate of blood leaving the left ventricle (to the body). Once the blood leaves the heart, certain
percentages of the cardiac output go to each of the physiological systems. This results in variable blood flow between the organs in the body depending on local demand and vascular resistance. Blood flowing through specific vessels is dependant on the
The flow relationship is comparable to that of an electrical circuit. Ohm's law states that I = AV/R, where the current is I, the voltage is V, and the resistance is R. Blood flow is similar to current flow, pressure gradient is similar to voltage gradient, and the vascular resistance is similar to electrical resistance. This leads to the equation:
Q
= AP/R. WhereQ
is the flow (ml/min), AP is the pressure difference (mmHg), and R is the resistance (mmHg/ml/min). [15]This equation shows that the blood flow is inversely proportional to the resistance. Thus, if the vascular resistance decreases, the flow increases. Changing the resistance of a blood vessel is the chief means for changing blood flow within the cardiovascular system. Due to the strength of the walls of the arteries, this resistance change typically occurs in the pre-capillary arterioles which directly affect the flow to the capillaries. Considering that the cardiac output is in steady state, this puts the resistance of each physiological system in parallel. Where the overall resistance of the body is less than the individual resistances, this means that there is minimal loss of pressure in the major arteries. Within a physiological system, the resistance is in series, where the total resistance of the system is equal to the sum of the individual resistances. This makes the flow through each class
of vessels the same within the organ, and causes the pressure to decrease progressively with the arterioles having the highest pressure gradient, AP =
Q
x R. [15]Specific resistance is unique to each organ. Every organ has its own metabolic demand that determines the blood flow requirement which is established by regulating internal resistance. If part of an organ is in a compromised state, the resistance can change
allowing for more blood to flow to that area. Resistance of the vessels in the
cardiovascular system thus maintains the distribution of blood flow throughout the body. Specific vascular resistance in normal physiology directly relates to the amount of blood that is needed to keep the tissue in a normal, functional state. Every tissue has an optimal level of perfusion. Perfusion is defined as the rate of blood flow in tissue per unit mass. The units are milliliters of blood per 100 grams per minute, or ml/100g*min. As blood perfusion decreases from the optimal level, then there is an increased probability of loss of tissue function and ultimately tissue death.
It is essential for tissue survival and function that such compromised states are discovered and resolved in a timely manner. Rapid reversal of compromised states offers a better prognosis for tissue revival. Thus, the quantification of tissue perfusion is a long sought after capability with extensive clinical applications. Perfusion measurements are
extremely important in both the assessment and management of an injury or trauma.
2.2 Various Methods of Measuring Perfusion
Since the beginning of medical imaging there has been quite a few techniques used for measuring perfusion. They can be classified in two distinct categories corresponding to the tracer methods: exogenous tracer method and endogenous tracer method. [2] [3] An exogenous tracer is one that is isolated to the intravascular compartment, i.e. inside the blood vessel, and does not diffuse to the extracellular space. Endogenous, on the other
hand, is not restricted to the intravascular compartment and does diffuse freely to the extracellular space.
2.2.1 Diffusible Tracer
The diffusible tracer method relates the amount of tracer allotted to the patient, to the relative amount that is taken up by the tissue. A tracer is used to selectively sample the tracer's concentration or to record the emission from the tracer. One example of a diffusible tracer is Xenon-Enhanced CT. Xenon-CT has been a widespread technique used for many year. [3] Xenon is a very small molecule that is both water and lipid soluble and it moves freely after being inhaled and then dissolved in the blood. The concentration of the Xe gas reflects the input and uptake of Xe by the tissue. Due to the perfusion dependent washout attenuation of Xenon, it makes it a very good contrast agent and can be easily imaged through x-ray sensitive CT scanning.
Another widely used diffusive technique is single photon emission CT or SPECT. [3] This technique is based on the diffusion of the radioisotope technitium-99m (Tc-99m).
The radioisotope is attached to a compound that can diffuse into the cells and is
metabolized by neuronal and glial cells. On its first pass, most of the Tc-99m will attach to the respective cells and the uptake is proportional to the blood flow. The concentration distribution of the Tc-99m can be used to represent the distributed relative blood flow at the time of application.
The non-diffusible tracer techniques are used more often, and provide a more reliable method for perfusion imaging. [3] CT offers a very reliable way to measure perfusion with an endogenous tracer. It measures the changes of tissue density following an injection of a contrast agent that stays within the vascular space. With that assumption, very fast image slices are taken over a limited volume to determine density changes over time, arterial input, and venous outflow values. These are then put into a mathematical algorithm that calculates blood volume, flow, and transit time.
2.2.2 MR Perfusion Techniques
A technique that presents great promise for the future is MR perfusion imaging. MR imaging is a commonly used method that makes use of the natural magnetization of tissue to create an image. Magnetic resonance imaging is a very attractive technique because it offers the most accurate and highest resolution image, and does not use ionizing
radiation. [2]
Before MR perfusion is discussed, a basic foundation of MR imaging must be
established. [4] [5] A more detailed explanation of Nuclear Magnetic Resonance (NMR) information will be presented in Chapter 3. For the sake of understanding MR perfusion techniques, a summary will follow. There are many factors that pertain to the quality of the image, such as signal to noise ratio (SNR), spatial resolution, and tissue contrast.
and the area being imaged. Each organ has certain properties that pertain to certain parameters in an examination.
There is a critical SNR threshold above which MR images have clear resolution of the organs being imaged. Each of the three factors (SNR, spatial resolution, and tissue contrast) is largely dependent on intrinsic (tissue dependent) and extrinsic (operator-dependent) parameters. The most important intrinsic parameters are proton density and the magnetic relaxation time. These correspond to TI and T2. Extrinsic parameters include magnetic field strength, repetition time (TR), echo time (TE), matrix size, slice thickness, field of view, number of data acquisitions, radiofrequency coils, and other factors. Most important for MR perfusion imaging are the intrinsic parameters and their direct affect on TR and TE.
The intrinsic properties of the sample T I and T2 determines the quality of the image resolution. They will determine the repetition time and the echo time of the operator. TI refers to the time needed for the recovery of a longitudinal magnetization along the z axis to return to its equilibrium value following a 90 degree pulse. TI is the longitudinal relaxation time and is also called the spin-lattice relaxation time because it depends on the nuclei losing energy to the surrounding environment. Tissues with a short TI return to their magnetization equilibrium at a faster rate than tissues with a long T 1. Therefore TI determines when the next RF pulse can be applied. If it is applied before TI, there will be a reduction in the free induction decay. The free induction decay is the basic MR signal that occurs as an exponentially decaying oscillation of signal amplitude as a
function of time. Consequently, the differences in T1 relaxation of various tissues can be exaggerated by altering the time between RF pulses. If the time between 90 degree pulses is short, i.e. a short TR, then the differences in tissues with different T1 values will be emphasized. Those tissues with a short TI will be able to get closer to equilibrium before the next pulse and will not have a reduction in the free induction decay. Therefore the tissue with lower T1 will appear at a higher signal frequency. [4] If the opposite occurs, where TR is long then all tissue T1 values will be able to get back to equilibrium and there will be little contrast between the tissues. This is the basis of T I weighted imaging.
The other intrinsic relaxation T2, is net loss of magnetization in the transverse plane due to dephasing. [4] [5] With an RF pulse, all protons align in phase. Due to slight
differences in local magnetic field environments experienced by each proton, the individual precession frequency is slightly different. This is called transverse relaxation and is also often called spin-spin relaxation because it corresponds to interactions between neighboring spinning nuclei. T2 is always less than TI. To emphasize
differences in T2, the RF pulses applied to the external magnetic field are changed, this technique is called spin echo. Thus, T2 determines the spin echo or ER.
Spin echo is a serious of RF pulses that correspond to a certain sequence that will provide the best image resolution for the corresponding tissue. Usually the sequence is a 90 degree pulse followed by a 180 degree pulse. [4] Knowing TI, T2, the corresponding echo pulse sequence certain images can be made that are either TI or T2 weighted.
2.2.3 DSC and ASL Techniques
There are two main types of MR perfusion techniques: one is the first pass bolus tracking technique also known as dynamic susceptibility contrast (DSC), and the other is arterial spin labeling (ASL). [2] ASL is a method that saturates and inverts water protons
electromagnetically. The inverted protons mix with the non inverted protons in the blood. Imaging before and after the spin inversion detects tissue magnetization, which is
proportional to perfusion. This method is still in its experimental stages and although promising does produce high signal to noise and long acquisition times.
DSC, the more commonly used MR perfusion technique, uses a paramagnetic contrast agent that dephases the protons in the area surrounding the capillary network. This dephasing causes an alternation in the T2 relaxation in the adjacent tissue. There is a temporary change in the local magnetic field surrounding the perfused tissue caused by a bolus of paramagnetic tracer. The change in magnetic field is recorded as the signal changes. Using ultra fast imaging techniques in succession, yields an accurate measurement of the quickly varying signals. The signal variation corresponds to the
degree of T2 change which is ultimately proportionate to the perfusion.
The relative tracer concentrations can be analyzed on a time scale that corresponds to the signal-time data. These tracer curves represent the tissue parameters that reflect the blood volume, blood flow, and transit time. The blood volume means the volume of
blood in a given region of tissue and measured in mL/10g of tissue. Blood flow is the volume of blood passing through a given region in a certain time. It is measured in mL/100g/min. The mean transit time, MTT, is the average time it takes blood to pass through a given region of tissue. [2]
Quantitatively these parameters are determined from the graphs of tracer concentration-time data. The arterial input function is deconvolved to get the clearance or mean transit time through the capillary bed. Blood volume is calculated by integrating the area under the deconvolved tissue-concentration time curve and divided by the mean transit time. This gives total concentration in the tissue per time. The initial height of the tissue concentration-time curve can be taken as the blood flow, and the mean transit time can therefore be calculated as the ratio of blood volume to blood flow.
The tissue parameters (blood volume, blood flow, and transit time) are dependent on many factors: patient specific physiological factors and the specifics of the experiment. The parameters are strongly dependent on the bolus arrival time, and thus the amount and paramagnetic properties of the injection. These parameters are also dependent on the person and their cardiac output and their total-body volume. Therefore, no set standard exists for all patients, and only a relative scale can be used that compares the vast variations in the images. It has proven difficult to quantify this technique. There have been a few methods that have tried to quantify the results, but no reliable method has been installed permanently. The image, and the corresponding tissue parameters, give a reliable relative perfusion output.
Endogenous tracers provide another MR perfusion imaging method. [2] [3] The
endogenous, or diffusible, tracer technique measures the regional uptake of a tracer that
has diffused into the tissue compartment and is not limited to the intravascular space.
This method depends on the detection of signal loss from the water protons that flow
within the blood. The water protons are magnetically labeled by the application of a
specific radiofrequency pulse that saturates and inverts them electromagnetically.
Imaging before and after the inversion will detect the differences in tissue magnetization
and give a qualitative or quantitative result.
This newer method still has many unresolved disadvantages and inaccuracies, many
arising from the difficulty of keeping the spins labeled in a certain selected slice. The
protons on the edges of the slice transfer their magnetization to the ones that are not
selected causing an off resonance radio frequency that will cause a huge loss in the
observed signal. The other main loss in this method is due to T I relaxation from blood
flow from the labeled plane to the imaging plane.
There are methods to counteract these problems. They require longer acquisition times
and are very sensitive to any motion. This method does hold much promise, as a
quantitative result can be obtained in theory. A quantitative result would be very
important for an accurate analysis of an infarction, or tissue death, or ischemia, decreased
flow. A quantitative measure of relative ischemia could provide information on the
possibility of reviving the tissue and the associated physiological problems. Through more clinical trials hopefully this method will be the future for MR perfusion imaging.
Dynamic sequencing can be done with either a TI or T2 weighted imaging technique. The T2 weighted sequence is more often used in practice. Injection of a paramagnetic contrast agent causes a transient drop in signal intensity. These techniques are T2 (spin echo) or T2* (gradient echo) weighted. T2 weighted has the advantage of decreasing artifact at the tissue-bone and tissue-air interface and is more sensitive to smaller changes especially at the capillary level. The method does, however, require much more contrast agent than the gradient echo. Both T2 and T2* have short imaging times and has the option of multiple slice selection imaging.
TI weighted imaging does offer better spatial resolution and a lower dose of contrast material. [2] This method measures the reduction of the TI relaxation time, which results in a higher output on TI weighted images. This is in contrast to the susceptibility effects of the contrast agent in T2 and T2*. In that technique, the reduction of T2 and T2* relaxation times will lead to a lower signal on T2 and T2* weighted images. Combining
both methods will provide a more accurate diagnosis.
2.2.4 Other Techniques
Diffusion MR perfusion imaging is another technique, much like the labeling of water
ability is evaluated using a strong gradient coil that can provide rapid 180-degree
excitation. The random motion of the water molecules diffusing causes a phase shift and a signal loss. Conversely, where there is no diffusion, there will be no loss in regard to a phase shift and a very strong signal. Where there is decreased perfusion there will be less
diffusion. This method is also not quantitative but relative using signal strengths to record and obtain diffusion coefficients. A problem arises in the analysis of similar results, because a decrease of signal is observed when the water hits a membrane or large
molecule. Instead of looking at diffusion weighted imaging alone, it is often coupled with perfusion weighted imaging. Both these imaging modes combined offer a much better analysis.
Combining perfusion and diffusion weighted imaging will allow for a better assessment of relative reversible or irreversible ischemia. [3] [2] Having information from both types of images can offer information about whether or not the tissue can be revived. Typically if there is decreased perfusion, the diffusion will equilibrate with this decreased value. Thus, if an area has a low perfusion weighted image, but has a normal diffusion weighted image it could mean that the tissue has a potentially reversible ischemia. If the values are the same then chances are the tissue is irreversibly damaged. The method of
combining perfusion and diffusion weighted images is still under clinical investigation; where preclinical experiments offer positive results.
A hindrance to accurate perfusion measurements is found in the innate properties of the blood itself. The blood oxygenation level provides a local magnetic field that will alter
the signal near the local blood vessels. [6] The alteration is due to the deoxyhemoglobin acting as an endogenous paramagnetic contrast agent. This affect is called Blood
Oxygenation Level-Dependent contrast or BOLD contrast. When there is an increase in local neuronal activity, the metabolic rate is slow to rise to this increased level and therefore an increase in venous-blood concentration will occur. This results in a change in the signal that is detected. Aside from the image alternation it will cause, it can also be used to measure blood flow and perfusion. The BOLD contrast can locally see where the blood vessels are using oxygen due to relative changes in oxygenation levels.
2.2.5 FAIR Technique
There are some newer techniques that are used to measure perfusion imaging in MR. One is the advanced methods of quantifying an arterial spin tagged method is called Flow-Sensitive Alternating Inversion Recovery or FAIR. [6] [7] This method uses two images as a comparison, the first with a slice selection inversion pulse, and the second without a slice selection inversion pulse as a control. This method takes continuous
images of both the control and stimulated periods. The blood flow changes can be directly determined from the relative signal changes in FAIR. This technique does not use any contrast agent, which makes it very advantageous.
Another advantage of FAIR is its ability to quantify the perfusion. [7] The way to obtain a quantified blow flow through the FAIR technique is by collecting measurements of the magnetization, Mo, and Tl. This has been done with some success, but it is not yet as
accurate in quantification as SPECT or PET. With the evolving importance of
noninvasive perfusion measurements, the future for FAIR quantification is promising.
The most common application of MR perfusion is of cerebral blood flow. [2] [3] The measurement of brain perfusion for stroke victims especially, is very important. Often much of the brain tissue is damaged or dies after a stroke. For many years the only way to quantify and image brain perfusion was SPECT and PET. Yet the spatial resolution of these methods and others are low in comparison to MR imaging. The higher resolution and the usage of non-ionizing radiation make MR perfusion imaging a vast improvement. As the MR techniques improve, the developed MR perfusion imaging is expected to be the most widely used and accurate 3-D perfusion imaging method. Advances in MR assure the future for MR perfusion imaging.
2.3 Continuous Perfusion Measuring
While these MR methods offer a perfusion measurement, they do not offer continuous monitoring. Continuous quantification of the cerebral perfusion allows better
management of patients with compromised perfusion, and the best chance for tissue survival and retained/restored function. One method to measure blood perfusion continuously in real-time is using the thermal diffusion probe (TDP). The fundamental theory behind the TDP is that flowing blood carries heat away from the heat source convectively at a rate proportional to the flow.
The probe consists of a long polyurethane catheter that is 1mm in diameter. Two mixed metal oxide thermistors serve as the sensors: an active one at the distal end and a smaller passive one that is a few millimeters proximally. A thermistor is an electrical resistor, whose resistance has strong temperature dependence. The active thermistor is heated 20C above initial tissue baseline temperature. The passive thermistor continually measures the baseline temperature and continually updates the AT between the heated tip sensor an the tissue baseline. The measurement field is approximately a 4mm diameter sphere with the active bead at the center. Perfusion is extracted by the power-time data required to
maintain the active sensor at a certain temperature.
1mIvi•
I.
Figure 2.1 Schematic of the thermistor tip. Reproduced from Martin et al. [1].
Within in biological tissue, thermal energy in the form of heat is dispersed by conduction through the tissue and by convection with the flowing blood. The additional heat from the active thermistor, is thus also dissipated by conduction and convection. The
convection term is the one of interest, as it permits the quantification of blood perfusion. In order to accurately quantify blood perfusion, the conduction component must be
subtracted from the total heat transfer. Tissue conductivity can be simultaneously determined from the power-time data before the convective affect is developed. The perfusion extraction algorithm is complex. The model is derived from the governing
equations of heat transfer in biological tissue. The coupled biological heat transfer equations of the tissue and the embedded TDP are as follows:
1
aTm
_V 2TopblCbl
T(2.1)
a &
mk
m
1
_T
I
P
S=V
2T
-(2.2)
8
t
as &
k
Where:Tm = temperature elevationof the tissue
am = thermal diffusivity of the tissue
km = thermal conductivity of the tissue
co = local diffusion rate
Pbl = density of the blood
CbI = specific heat of the blood
T, = temperature elevation in heat bead
as= thermal difusivity of heat bead
k = thermal conductivity of heat bead
P = power dissipation V = volume of heat bead
To use these equations for the probe-tissue system, there are certain assumptions that are used. It has to be assumed that the system acts in an ideal way, assuming that the heated bead is spherical, the thermal contact is perfect and the volume of the heated tissue is at
least 5-times larger than the probe dimensions. Its also assumes that bio heat transfer laws govern. Solutions of the coupled probe-tissue thermal equations with appropriate initial and boundary conditions give rise to the time dependent temperature fields in both the tissue and probe which can be used to isolate the local perfusion in terms of power,
applied temperatures, and intrinsic thermal properties.
P
4mkmAT
1
km
1
5k+ 1+a
5k,
1+2a
a
f(t)
1+
i
km
5k+1+a
5k~
where
_ e-2aet
"•at
f(t)
e-a
F=
2,erfic
Aa
mPblCbl
•m
Where:
AT = temperature gradient
a = thermistor radius
(2.3)
In the TDP system, an onboard computer processes the acquired data in real-time through highly developed algorithms to obtain perfusion measurements as a function of time. This system has been validated through clinical experiments. It has shown to be in agreement with other proposed methods such as hydrogen clearance, Xenon-CT, and radioactive micro spheres. [1] [9] The TDP is being used in clinical setting. There is great interested to have the TDP perfusion probe work within a magnetic resonance (MR) environment. As more devices are used intraoperatively, a device that continuously monitors blood flow would be of high clinical value. Before the TDP can be placed inside the MR environment, there has to be a thorough assessment of the implications. This thesis looks at the some of these considerations.
Chapter 3 - NMR Basics
3.1 NMR Theory
One of the projects applications is Magnetic Resonance Imaging (MRI). In order to make design and other considerations, it will be useful to provide Nuclear Magnetic Resonance (NMR) and MRI basics.
Every type of nuclei reacts to a magnetic field in a certain unique way. If a magnetic field is induced, it will affect the spin and orientation of a nucleus. Measuring this affect is the basis of NMR imaging. [5]
Nuclei with an odd number of protons or neutrons, i.e. nonzero nuclear spin, have angular momentum. The nucleus of interest is 1H or the proton. The human body mainly
consists of water and fat, making the proton the most useful nucleus to study.
Considering the nucleus has a charge and it is spinning due to its angular momentum, a magnetic field is created is created. This is called the nuclear magnetic moment and denoted by g. The total angular momentum, J, is related to the magnetic moment through the gyromagnetic ratio, 'y. Each type of nuclei has a specific y.
The angular momentum is related to the dimensionless angular momentum operator or spin, I, through Plank's constant, h. The eigenvalues for the z-component of the angular momentum, I, is m = I, I-1,..., -I. Protons have a spin quantum number of I = 1/2. If a nucleus is put into a static magnetic field, Bo, that is defined along the z-axis, the interaction energy (defined as E=g-B) becomes:
E = ymhBo (3.2)
For a proton where I= 1/2 making m = ±A 2, the energy levels available to the spins are E=+1/2yhBO. The allowed transitions are Am = + 1, making the energy level difference:
AE = yhBo (3.3)
This corresponds to the energy level difference being related to the applied static field and the gyromagnetic ratio. The gyromagnetic ratio for a proton is 42.6 MHz/Tesla.
From equation (3.3), the resonance frequency can be determined. Considering that, AE = ho, this give the relation called the Larmor Frequency, CL:
0L = yBo (3.4)
This is the precise frequency of allowed energy transitions. If a certain nucleus is being studied, this frequency is applied and the spin states can make their transitions.
Without an applied magnetic field, there is no preferred orientation of the protons. Overall they produce no net magnetization. When a strong magnetic field is applied, the magnetic moments of the protons align parallel or antiparallel to the direction of the field. Although they align with and against the field, there is an overall bias toward the
direction of the magnetic field because it has a lower energy state. Thus, there is a resultant macroscopic magnetization in the line of the applied field. When the field is applied, there is a change in the angular momentum (dJ/dt = V x B) which equals the
torque. From this equation we can derive the net magnetization, M, where M=1 g.
dM/dt = yM x B (3.5)
The resultant cross product corresponds to a rotation of the magnetization around the magnetic field. Thus, the net magnetization, M, precesses around the applied magnetic field, B, at the Larmor Frequency, COL = YB. Considering there are other forces and interactions on the molecules, the magnetization does not precess forever in the direction of the applied field. Instead it reaches its net magnetization that is dependant on the thermal equilibrium value of the magnetization, Mo.
Mo= 72h2Bo/4kT (3.6)
The thermal equilibrium magnetization has a dependency on the Boltzmann energy, kT. To make the spins of interest more manageable conceptually and in the equations, the
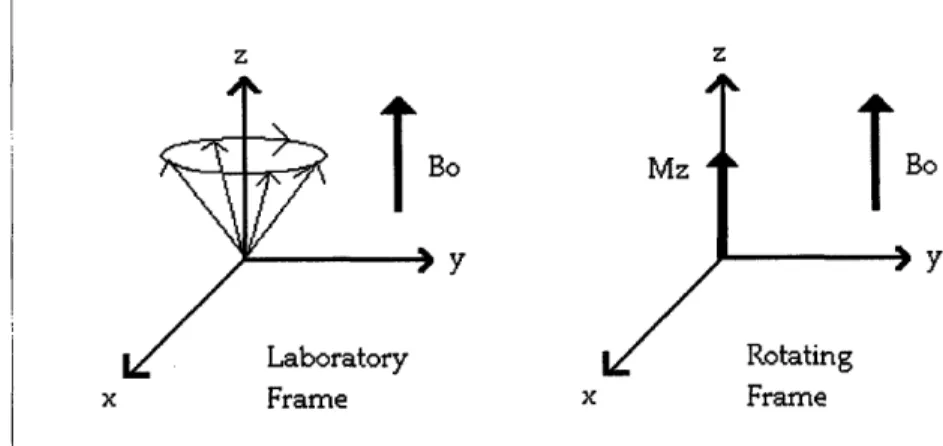
frame of reference is changed. In the laboratory frame, the frame is stationary and the spins are precessing. In the rotating frame, the frame is precessing at the same rate making the spins look stationary. Each arrow represents a spin precessing about the static field. When their z-plane component is summed, they have a net magnetization
about the z-axis.
z z BO Y Bo Y x Frame x Frame
Fig. 3.1: Diagram of the Laboratory and Rotating Frame of reference.
If another magnetic field, B1, is applied in the perpendicular direction to the static field,
the net magnetization, Mo, will be disturbed from its equilibrium position. The magnetization will not stay in this new direction; instead it will relax back to the
equilibrium value. This is precisely what is done in NMR. A radiofrequency pulse is applied perpendicular to the static field, causing the protons to instantaneously align with the pulse. The system relaxes through two methods: longitudinal and transverse
Longitudinal relaxation, also known as spin-lattice relaxation, brings the z-component of the magnetization back to its maximum value in the direction of the static field. Spin-lattice relaxation is dependent on the spins losing energy to its surroundings or Spin-lattice, and it is denoted by Ti. After the rf pulse, the magnetization in the z-direction goes to zero. Over time, the protons realign to their maximum vertical position.
M,(t)=M= o 1 - (3.7)
Transverse relaxation, also known as spin-spin relaxation, relaxes the magnetization in the x-y plane. It is dependent on the intrinsic properties of the sample and the field. The magnetic field is not exactly equivalent at every proton, causing each one to have a slightly different precession. After a while it will cause a fanning out effect of the net magnetization in the rotating frame, hereby decreasing the magnetization in the x-y plane. The localized magnetic fields inside a magnet are not completely homogenous, thus there is transverse loss due to these inhomogeneities. This is denoted through T2*, and is measured experimentally. T2* is always less than T2, meaning that experimentally the transverse magnetization decays faster than the theoretical value.
-t
M,y(t) = Moe 2 (3.8)
Putting it all together, equation (3.5) needs to be modified to incorporate the relaxation from the system. This is known as the Bloch Equation.
Mx / T2
dMId-= y(M
x B)+ My / T2 (3.9)
[.(Mo - Mz) / T7'
Inside the system, there is also magnetization loss from the diffusion of the moving spins. The magnetization equation can now be described by the Bloch-Torrey equation which takes into account the relaxation and diffusion of the system. Where D is the diffusion coefficient and v is the flow.
dMS= y(M x B) dt (Mo - Mz)k& + (M-M)k T1 relaxation T1 (3.10)
(Mxi + Myj) T2 relaxation
T2
-V * vM+V D VM diffusion
This equation provides the basis for NMR imaging.
The relaxation of the protons in the x-y plane produces a frequency that can be picked up by the NMR machine. An oscilloscope detects the signal that is generated by the
resultant small currents from the dephasing of the magnetization. The signal generated displaces a decaying cosine wave, as described by equation (3.8). The resultant wave is
called the free induction decay (FID). The information within the FID is a time domain signal. Using a Fourier transform, the data can be turned into a signal function that is dependent on frequency. The signal is also dependent on the number of protons dephasing. By manipulating the new orthogonal magnetic field, B1, a signal can be
detected from the sample. The field is created by inducing a magnetic field inside a coil that is surrounding the patient.
An important aspect of NMR imaging is the addition of a gradient field. In order to resolve the distribution of spins in space, a spatially varying magnetic field is added to the system. The main premise behind the gradient is to provide an environment where each region of spins experiences a unique magnetic field, and thus precess at different rates. If the electrons are precessing at spatially dependent magnetic fields, then that
corresponding frequency can be specifically collected in the readout. This allows for a two-dimensional image to be taken from a three-dimensional object.
A specific gradient is purposely added to the system to resolve a spatially dependent area. There are many types of gradients that can be implemented in any combination of the x, y, and z-planes; they are denoted by Gx, Gy and Gz. Often certain gradients are used in pulse sequences as certain combinations can elicit specific results. For the purpose of the thermistor application, it should be understood that there are three fields in an NMR
environment. Depending on the sequence, the strength of the static field is going to depend on the gradient used. Even if the thermistor probe is not in the selected slice, it is going to feel the affects of all three magnetic fields.
This presents the basics for NMR Imaging. The details past this point go beyond the scope of this thesis. The aspect of interest here is the magnetization of the tissue and how it will be affected by the three external magnetic fields.
3.2 Phase Encoding to Study Velocity
Images are density dependent, meaning that the data retrieved depends on the number of protons within the sample slice. The most accurate images are constructed when the sample is entirely stationary. Yet, in reality, a person's body is continually moving; as the heart continues to pump blood throughout the body, and the lungs continue to breathe. Considering nuclear magnetic resonance provides a two-dimensional slice of a three-dimensional sample, this property can be utilized to help determine internal movement, like blood flow or pulsatile movement.
When the NMR pulse selectively excites a specific plane of interest, only those protons are going to get phased. Within that plane, the protons have the same frequency. If there
is motion, then some or all of the moving particles will exit the plane; resulting in less detected spins for regions of movement. For example, if a slice of the brain is being imaged that has an artery, all the protons within that slice will be affected by the rf-pulse. As they are dephasing, the protons in the blood will leave the selected slice and thus not contribute to the detected signal. The static tissue will have a higher resultant frequency
than the moving blood. The velocity of the flowing material, will determine the strength of the signal void. If the velocity is fast enough, there could even be no signal detected.
To quantify velocity using this technique, the flowing area is compared to the static surrounding areas. This is done by a comparison of the data retrieved on each pixel follow a pulse sequence. Specific sequences are constructed that will allow for an accurate measurement of signal changes due to velocity. The method used most often is called the Phase Contrast Sequence, or is some modification of this sequence. It has been verified through many experiments. [10] [11] After velocities are found on a pixel basis, it is multiplied by the pixel area to obtain the flow volume. This quantity is typically measured in millimeters/sec, ml/sec.
Another application of this technique is to measure internal tissue movement. The same theory applies. If a tissue is moving, the moving area within the selected slice will exit the reading area and have less apparent spins on the reconstructed image. In the
subsequent chapter, many of the studies that provided results for brain motion were done with this type of imaging technique.
3.3 Interventional MRI
Magnetic resonance imaging (MRI) is a widely used practice that offers many benefits in comparison to other medical imaging techniques. To date, MRI has the best soft tissue contrast of all medical imaging. It has the ability to show biological tissue pathology to a
very precise degree, and tissue can be observed on many different planes without
resituating the patient. The images are taken very rapidly, and the patient is not exposed to ionizing radiation. MRI also has the capability to measure additional physical and functional variables including blood flow, and temperature, offering more information to the operator. The added information and precise images, makes MRI especially
important in the field of interventional work.
There are two types of interventional MRI techniques. The first is conducted initially at the magnet site, where an abnormality is located and instruments positioned around it. The patient is then removed and the procedure is done outside the magnet field. This technique has the advantage of using higher field strengths for imaging, as well as non-compatible instruments for the specific procedure.
The more widely used interventional MRI technique takes images and conducts the procedure within the imaging volume. The MR images are used in real-time as a guidance and monitoring system. Within this open MR scanner, more complex
procedures can be completed, but access to the patient and corresponding instruments is a factor. For this system, there are three different methods that utilize a low-field, medium-field, and a high-field. The low field does not offer a high enough resolution for most interventional procedures. High-field is the commonly used 1.5 T magnet, which often does not permit the required amount of space for an operator to perform on the patient. The mid-field is the best combination of both; it offers ample room and images that are of high enough resolution to be used as a guidance system.
The benefit to interventional MRI is the ongoing images of the patient while a procedure is being preformed. The magnet is usually set up in a doughnut shape with the patient in the middle. A surgeon has a better diagnostic and monitoring system to warrant a more favorable outcome, especially with surgeries where the abnormalities can only be seen on an MRI. The surgeon can see inside the patient's body without physically entering. Gaining more information about the patient is extremely important, along the same lines, more information for the surgeon is also beneficial. Having a device that continuously measures blood perfusion would be extremely helpful and important for an interventional application. Yet, before it can be used intraoperatively, the affects of the magnetic field on the TDP have to be determined and more fully understood.
Chapter 4
-
Movement of the Brain, Spinal Cord, and Cerebrospinal
Fluid
4.1 Introduction to Brain Motion
In monitoring brain perfusion, numerous situations were found in which the data from which perfusion is extracted revealed behavioral characteristics which could best be explained if periodic brain tissue motion existed. Periodic tissue relative motion could only exist if there were motion of the brain within the skull. As I was already
investigating what it would take to render the TDP MR compatible with the intent in using it in an MR field; and since MR is increasing being used to provide near real-time 3D quantitative maps of brain perfusion and since physiologically induced brain motion is a concern for MR images distortions - I decided to investigate the possibility of whether the brain motions recoded in the MR literature had any bearing on the motion like artifact observed in the TDP perfusion data. Consequently, this effect has added as a second focus of my thesis. Hopefully a study of the motion of the brain will offer an explanation and present a possible route to modify the perfusion algorithm, making brain perfusion measurements more accurate in the presence of such motion or offering a way to avoid this issue.
It was noticed that the artifact was producing a sinusoidal rhythm that was not in phase with the heart beat or the respiration rate. At first it was thought to be directly related to the blood flow through the brain, but later determined that there are many different
causes of brain motion, namely blood flow, cerebral spinal fluid, and respiration. Each of these is independent and dependent upon one another. The complexities of the human body, especially with the head, go beyond the scope of this thesis. I will offer a valuable overview of the system and a big-picture suggestion of how to fix the problem.
4.2 Functional Anatomy
4.2.1 Cardiac System
I will first comment on the cardiovascular system. The cardiovascular system plays an
integral role in the movement of the brain. The blood that enters and expands the brain is dependent upon the periodic contractions of the muscles in the heart. To understand how and when the brain is expanding, first the cardiac system must be assessed. [14][15]
The heart and its blood vessels can be split into two sides that serve different functions, the left and right. Each side has two chambers, the atrium, which is positioned above the second and larger chamber, the ventricle. The right side pumps blood through the
pulmonary circulation, which brings deoxygenated blood to the lungs to become
oxygenated. The left side of the heart pumps blood to the rest of the organs in the body, exiting the ventricle through the aorta. The cardiac system follows this main progression. Oxygenated blood fills the left ventricle from the left atrium. The heart contracts,
ejecting the blood through the aorta to be distributed to the rest of the body's organs. The blood is collected in the vena cava and on its way back to the heart. It enters the right
atrium, and fills into the right ventricle. Upon contraction again, the deoxygenated blood exits through the pulmonary artery to the lungs. From the lungs it travels through the pulmonary vein back into the left atrium to begin the process again.
Heart contraction has to do with specialized myocardial cells that have high electrical excitability. When prompted, the cells carry an action potential that causes a
depolarization of the cells following a repolarization back to the resting membrane potential. Due to the concentration of ions on the inside an outside of the cell membrane, each cell has a certain conductance potential, which is measured in millivolts. The action potential causes ion channels to open quickly making the membrane potential less
negative, this is called depolarization. As the action potential propagates to the next cell, the ion channels close and the cell slowly resumes its original membrane potential, thus repolarizing. After a certain refractory period, the cell is ready for the next action
potential. The depolarization and propagation of an action potential is what occurs in the heart causing its characteristic features.
The following electrocardiogram measures the electrical activity of the heart. This is a typical diagram for a healthy heart. Each of the areas marked by letters represents important stages in the cardiac cycle. The heart is depolarized, and repolarized as the action potential propagates, and this becomes important in the chronological assessment of the occurrences.
ST Segment
Fig 4.1: Electrocardiogram of a typical heart wave.
The potential is negative at the bottom going to positive at the top.
I. The P-wave corresponds to the depolarization and contraction of the atria forcing blood to fill the ventricle. The electrical impulse starts in the right atria and depolarizes both atriums. The depolarization of the heart travels down the muscle walls from the top of the atria to the bottom of the ventricles.
2. The P-R Interval is the time from depolarization of the atria to the start of depolarization of the ventricles.
3. The Q-R-S interval is three different waves that collectively represent the depolarization of the ventricles, and the contraction of the ventricles. The ventricles contract until the pressure inside the left ventricle exceeds the left
R-wave. The ventricle continues to contract until it exceeds the pressure in the aorta, and the aortic valve opens expelling highly pressurized blood into the arteries. This occurs a few hundred milliseconds past the Q-R-S interval. 4. The R-wave is the most prominent of all the waves. The heart rate is typically
recorded from R-wave peak to the next R-wave peak.
5. The S-T segment represents the end of ventricular depolarization to the beginning of repolarization.
6. The T-wave corresponds to the repolarizaton of the ventricles.
7. The Q-T Interval is the time from the beginning of ventricle depolarization to the end of ventricle repolarization.
The shape of the electrocardiogram will help to understand the motion in the brain. In the subsequent section, brain motion will be analyzed. Many of the reports use the R-wave as a marking point for their analysis.
4.2.2 The Brain
The brain contains a high percentage of the body's oxygenated blood. It has the highest density of capillaries, with the gray matter being denser than the white matter. This corresponds to the neurons needing more blood to perform actions. The brain has no way to store energy, and thus it needs a constant supply of oxygenated blood. Any
compromise to this delicate system can cause neural damage within seconds of ischemia. [16] To fully understand how the blood is flowing, anatomical direction need to be established. The orientation of the corresponding structures within the human brain has the following conventions.
Anatomical Planes
AXIAL PLANE to •o...
Anatomical Orientations
cranial * caudal
Terminology:
Inferior - Lower
Superior - Upper
Anterior or Ventral - Toward front
Posterior or Dorsal - Toward back
Cephalad or Cranial - Toward Head
Caudal or Caudad - Toward Tail end
Medial - Toward midline
4.3 Blood Flow
Recently oxygenated blood travels from the left ventricle through the aorta, which is the main artery in the body. The aorta forms an arch, where two subclavian arteries branch off carrying blood straight to the brain. The two subclavian arteries, common carotid and vertebral, branch to form the two pairs of arteries that feed the brain: the internal carotid
arteries, and the vertebral arteries. The internal carotid arteries supply most of the cerebral hemisphere, while the vertebral arteries mainly supply the brainstem,
cerebellum, and spinal cord. The internal carotid arteries ascend bilaterally through the neck into the base of the brain at the circle of Willis. The vertebral arteries come together at the base of the brain and form the basilar artery which then feeds into the circle of Willis. Due to the delicate pressure gradient of each artery, there is not much motion around the circle of Willis. If an artery is compromised, the circle of Willis can act as a mechanism to supply more blood.
Anteric cerebra a•rt erv I mern.a carotid arterv Basiia r a rterv AnteriC irtneror cerebell artery Middle ctcn, b'raL r.rtl ion kf te"poral re rnod Posterior inferittur cereterllr artery
Vertebral
arterv
Anterior commn unicakt ir arterv Posterior cerebralat erv (ol, ridbrain)
nommunkating
artvrv
ýBa~ilar
artenr
(to p rI.)
Fig 4.2: The arterial blood supply to the brain from the Circle of Willis. Reproduced from Purves et al. [14].
The internal carotid arteries branch forming two important cerebral arteries; the anterior cerebral artery and the middle cerebral artery. Both of these supply the forebrain with blood. The anterior cerebral artery travels from the circle of Willis in an anterior, then ascending direction, circumventing the lateral ventricle. The middle cerebral artery feeds the outer part of the forebrain. These arteries branch further to supply the cortex and the basal surface of the brain, as well as deeper structures including the basal ganglia and the thalamus.
The posterior area of the brain is supplied by three main arteries, the vertebral, basilar and posterior cerebral basilar. BefOre the vertebral arteries join to become the basilar arteries, they continue to branch creating the blood supply to the posterior part of the brain. The posterior circulation supplies the midbrain, brainstem, and posterior cortex.
Anterikir cerebra~l ,-rtrv 'xr~brd1 .~tkrv I" cerbra I arterv aI irker
Fig 4.3: The location of the main arteries in the Brain. Reproduced from Purves et al [14].
(1,3)
The blood leaves the branches of the arteries and enters the capillary bed. This causes the largest swelling of the brain. After the oxygen is taken up by the brain cells, the
deoxygenated blood enters the venous system. The venous system is less complex than the arterial system. The blood velocity is significantly slower, and the veins are primarily receptacles for the deoxygenated blood. The main vein of the brain runs down the middle of the brain between the two hemispheres. It is called the superior sagittal sinus, and it runs from right behind the forehead to the very back of the neck. At the base of the neck, it bifurcates and transcends down the neck through the internal jugular vein. The deep arteries of the brain empty into the straight sinus, which also joins at the back of the neck. Veins have much thinner walls than arteries. They have no muscular components and blood is moved through them from the pulsatile motion of arterial blood.
4.4 Cerebral Spinal Fluid
Many studies have shown that there is movement of the brain and spinal cord inside the body. Studies have also shown that the cerebrospinal fluid, which incases both of these structures, also has a flow. It has been noted by many that the brain and spine move in a piston-like fashion. [17][18][19][20][21]
The circulation of the cerebrospinal fluid is a complex and not completely understood phenomenon. The ventricular system of an adult brain has a volume of about 120-160ml of cerebrospinal fluid and on average produces at about 500ml/day. The density of the liquid drastically decreases the weight of the brain. [16][33]
Fig. 4.4: The ventricles oriented inside the brain. Reproduced from Gray's Anatomy [24].
CSF is created by the choroids plexus which are thin capillary cells that line the ventricles. The CSF travels from the choroids plexus into the lateral, third and fourth ventricles. It flows around the subarachnoid space surrounding the brain, and also travels down the spinal canal. Within the spine, there is circulation about the spinal cord and central canal. [33] Fluid motion in the spine is helped by physical movement of the vertebrae, as well as the pulsatile motion from the brain and spinal cord.
cerebral tiyi
Mcu~njc
Suhdf4rI S ~b#~r~4
Sip. aVa rtlta s r ria.
no4ter
Fig. 4.5: Coronal view of the upper part of the brain and skull. Reproduced by Gray's Anatomy [24].
The absorption of the CSF was originally thought to be in the arachnoid granulations, which are projections from the arachnoid layer into the venous sinus. Recently, it has been discovered that CSF is absorbed by the capillaries through the delicate balance of osmotic pressure within the vascular system. [21] Thus, the absorption is governed by the Starling hypothesis, which states that capillary membrane filtration is proportional to the hydrostatic pressure gradient minus the osmotic pressure gradient. To maintain
homeostasis, and ultimately counter the production rate of the CSF, there is an equal amount of absorption by the capillaries of the central nerves system. [21] Considering
there is fluid flow across the cerebral capillary membrane, some of the interstitial fluid passes through the capillary membrane into the CSF, thus there is a small variation between the CSF at the brain and the CSF at the outer edges. The interstitial fluid and CSF have similar characteristics, so overall this does not amount to much change, but still worth noting.
While there have been many theories about the flow of the cerebrospinal fluid, it has been shown that overall there is a dominant pulsatile movement of the CSF. [17] [19] [21] The ventricles have their own non-cardiac pulsations, and it is also postulated that the cranium has its own pulsatile rhythm. [33] Yet, the dominant force is the brain blood vessels filling with blood, causing the brain to move and pushing the CSF around the ventricles. Pulsatile blood flow causes non-uniform velocities of the CSF, and also causes a diffuse, multidirectional mixing of the fluid.
According to the Monro-Kellie doctrine, the volume of the brain, CSF, and intracranial blood is constant. [22] This is under the assumption that liquid is incompressible, and that the cranium is rigid. If one of the constituents increases in volume, another one has to decrease. This model is helpful in interpreting the movement of the brain and
associated CSF. During systole, blood rushes into the arteries inside the brain, the brain volume expands exerting a force on the surrounding CSF. The CSF exerts an equal and opposite force against the rigid dura mater everywhere except at the opening in the foramen magnum and the tentorial notch. These are both located at the base of the brain where the spinal cord connects. The pressure from the expanding brain pushes the CSF
![Figure 2.1 Schematic of the thermistor tip. Reproduced from Martin et al. [1].](https://thumb-eu.123doks.com/thumbv2/123doknet/14205709.480897/25.918.199.547.556.773/figure-schematic-thermistor-tip-reproduced-martin-et-al.webp)


![Fig 4.3: The location of the main arteries in the Brain. Reproduced from Purves et al [14].](https://thumb-eu.123doks.com/thumbv2/123doknet/14205709.480897/51.918.178.663.109.548/fig-location-main-arteries-brain-reproduced-purves-et.webp)
![Fig. 4.4: The ventricles oriented inside the brain. Reproduced from Gray's Anatomy [24].](https://thumb-eu.123doks.com/thumbv2/123doknet/14205709.480897/53.918.150.587.198.479/fig-ventricles-oriented-inside-brain-reproduced-gray-anatomy.webp)
![Fig. 4.5: Coronal view of the upper part of the brain and skull. Reproduced by Gray's Anatomy [24].](https://thumb-eu.123doks.com/thumbv2/123doknet/14205709.480897/54.918.154.772.131.610/fig-coronal-upper-brain-skull-reproduced-gray-anatomy.webp)