HAL Id: hal-00682550
https://hal.inria.fr/hal-00682550
Submitted on 7 Jun 2012
HAL is a multi-disciplinary open access
archive for the deposit and dissemination of
sci-entific research documents, whether they are
pub-lished or not. The documents may come from
L’archive ouverte pluridisciplinaire HAL, est
destinée au dépôt et à la diffusion de documents
scientifiques de niveau recherche, publiés ou non,
émanant des établissements d’enseignement et de
PORGY: A Visual Graph Rewriting Environment for
Complex Systems
Bruno Pinaud, Guy Melançon, Jonathan Dubois
To cite this version:
Bruno Pinaud, Guy Melançon, Jonathan Dubois. PORGY: A Visual Graph Rewriting Environment
for Complex Systems. Computer Graphics Forum, Wiley, 2012, Eurographics Conference on
Visual-ization (EuroVis 2012), 31 (3), pp.1265-1274. �10.1111/j.1467-8659.2012.03119.x�. �hal-00682550�
Eurographics Conference on Visualization (EuroVis) 2012 S. Bruckner, S. Miksch, and H. Pfister
(Guest Editors)
Volume 31(2012), Number 3
PORGY: A Visual Graph Rewriting Environment
for Complex Systems
B. Pinaud, G. Melançon and J. Dubois†
University of Bordeaux, LaBRI, UMR 5800, INRIA Bordeaux Sud-Ouest, France
Abstract
Graph rewriting systems (GRSs) operate on graphs by substituting local patterns according to a set of rewrit-ing rules. The apparent simplicity of GRSs hides an incredible complexity and turns the study of these systems into an involved task requiring high-level expertise. We designed PORGY, an interactive visual environment to fully support GRSs related tasks, exploiting a long historical tradition of GRSs with node-link representations of graphs. PORGY enables rule-based modeling and simulation steering through graphical representations and direct manipulation of all GRSs components. This paper contributes a design study and task taxonomy relevant to the interactive visualization of GRSs.
Categories and Subject Descriptors(according to ACM CCS): I.2.4 [Artificial Intelligence]: Knowledge Represen-tation Formalisms and Methods—; F.1.2 [CompuRepresen-tation by Abstract Devices]: Modes of CompuRepresen-tation—; F.4.2 [Mathematical Logic and Formal Languages]: Grammars and Other Rewriting Systems—
1. Introduction
Graph rewriting systems(GRSs) are easily described as a game where one iterates transformation rules on an initial graph until some condition is met. A rule describes a lo-cal pattern that must be identified in a graph and specifies how this pattern must be transformed or substituted. This simple description actually hides an incredible complexity which is evidenced by the vivid research community work-ing in this area. When modelwork-ing complex systems, graphical formalisms have clear advantages, particularly in the earlier specification phases because they are more intuitive and aid visualizing and communicating ideas about a system. The focus of this work is designing and building a visual and interactive environment supporting graphical manipulation and computation with GRS.
In a sense, (graph) rewriting was originally designed as an abstract device used within theoretical computer science (CS). GRSs form a computing model in discrete mathemat-ics, algebra, logic and even linguistics relying on solid logic, algebraic and categorical foundations, with applications in
† This work was supported by INRIA’s Associate team program and the EVIDEN project (ANR 2010-JCJC-0201-01).
specification, programming and simulation [EEK∗97]. Mod-eling based on graph rewriting is also sometimes called rule-based modeling. Graph rewriting is useful for modeling se-curity policies in autonomous systems [AK09], in model-driven software engineering [GGZ∗05] or for Interaction Nets, a low-level graphical computation paradigm [Laf90]. It has even been used for graph drawing [Rod98]. More re-cently, graph rewriting has been used to model biomolecu-lar interactions, which shows great promise [AK08,FBH09,
SXS∗11]. In each situation, the challenge is building a set of rules to model a phenomena studied by domain experts. Validating these rule-based models involves explicit compu-tations and analyses of these complex systems. Domain ex-perts must manipulate, abstract and refine the models they build, use simulation and deduction to compute or check the postulated properties and make testable predictions regard-ing possible outcomes, eventually usregard-ing experimental results to update the models.
Our work focuses on designing a visualization environ-ment to fully support GRSs based on sound requireenviron-ment analysis, developed in close collaboration with users and tight prototyping iterations. The paper describes a design study relying on Munzner’s nested model for visualization [Mun09]. Problem domain questions emerging from
numer-c
2012 The Author(s)
Computer Graphics Forum c 2012 The Eurographics Association and Blackwell Publish-ing Ltd. Published by Blackwell PublishPublish-ing, 9600 GarsPublish-ington Road, Oxford OX4 2DQ, UK and 350 Main Street, Malden, MA 02148, USA.
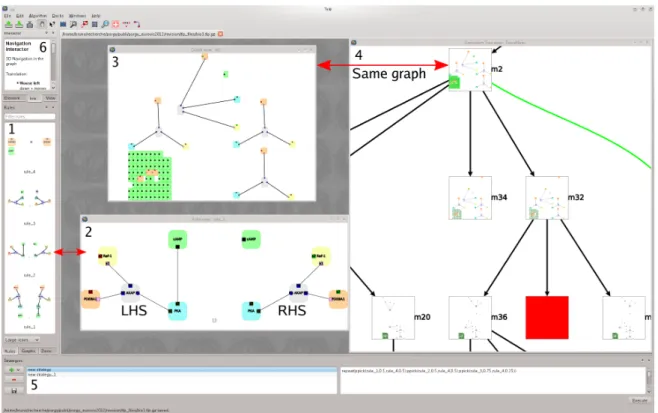
Figure 1: Overview of PORGY: (1) all rewriting rules; (2) editing a rule; (3) editing one state of the graph being rewritten; (4) portion of the derivation tree, a complete trace of the computing history; (5) the strategy editor; (6) configuration options.
ous working sessions with users were translated into design requirements corresponding either to tasks or necessary vi-sual encodings (Section2and Section3). Various visual rep-resentations were assembled into an integrated GRS interac-tive dashboard to design rule-based models and steer sim-ulations. Reasoning about a particular model involves test-ing various rewrittest-ing scenarios, backtracktest-ing to a previously computed graph and possibly updating rules. The GRS itself either models a real-world phenomenon or is studied from a purely theoretical CS perspective. Our contribution also includes two case studies illustrating the use of PORGY in the context of molecular biology and the study of interaction nets (Section5).
Related Work. GRS textbooks all rely on drawings to describe both theoretical concepts, results and examples. Conversely, most existing GRS applications instead offer users a text-based description of rules and graphs based on written specifications or programming languages (PRO-GRES [SWZ97], Fujaba [NNZ00] or GP [Plu09]). Building a visual environment allowing users to directly work with drawings at all times fulfills a clear need.
Most systems offer the ability to iterate rule applications and visualize how they affect a graph. AGG [ERT97] is a rule-based visual language supporting graph rewriting and
offering a dual view on rules and rewritten graphs. Boog-gie [HESL09] is oriented towards model-driven software engineering. It integrates GrGen.NET [GBG∗06] (a pro-gramming tool for graph transformation), provides a vi-sual rule interpreter, allows the formulation of sophisti-cated rule sequences and offers graph visualization based on Tulip [AAB∗12]. As in AGG, Booggie simultaneously dis-plays rules and a view of the actual graph on which rules are applied.
RuleBender [SXS∗11] is dedicated to biochemical rule-based modeling relying on the BIONETGEN lan-guage [FBH09] for the specification and simulation of rule-based models of biochemical systems. RuleBender shows the molecule network and rules in a same view, displaying rules as contact maps to exhibit (potential) molecule inter-action. Although many RuleBender features compare with our system, it clearly is limited to models for intracellular dynamics.
PORGY explicitly endorses non-determinism by allowing the simultaneous exploration of multiple rewriting scenarios and backtrack to test alternate strategies. Its derivation tree (see Section2) compares with most history mechanisms that are part of steered simulation environments (see [WFR∗10] and references therein). It records information as rewriting evolves, creating branch points to explore alternative
scenar-c
B. Pinaud, G. Melançon and J. Dubois / PORGY: A Visual GRS for Complex Systems
ios. PORGY’s underlying multilevel graph structure makes all these features possible (Section 4), enabling users to query rewriting histories and track properties along rewrit-ing scenarios. The expressiveness of our system does not re-strict it to any particular domain; it may thus be deployed in different application contexts.
2. Data and Task Abstraction
Graph rewriting formalism is extremely rich and complex, making the study of rule-based models quite challenging. The design of dedicated views and interactions to support the manipulation and simulation of a GRS relieves users from having to reason with heavy mathematical notations, draw examples or compute by hand. Our first contribution is characterizing the data and task abstraction that must be supported. This phase went through several iterations as we worked with experts from different application domains. As we elaborated our data/task taxonomy, we obtained a clear match between domain-oriented tasks, expressed by domain knowledge (Table1Col. 1), and design requirements on the GRS itself (Col. 2). This match is quite natural in the sense that graph rewriting was adopted by users as a model of their original problems. It also served our goals as some of our users are theoretical computer scientists involved in the study and development of graph rewriting theory. Inciden-tally, all tasks listed in [SXS∗11] focus on biochemical rule-based modeling and coincide with tasks listed here.
In this section, we first describe the mechanism used to modify a graph by either changing its topological struc-ture or modifying node or edge attributes (for a more formal description using proper mathematical notation, see [AFK∗11]). Next, we provide a characterization of the data and task abstractions we must support (Col. 2 and 3). Because all components of a rewriting system involve graphs, some terminology is necessary to dissolve possible ambiguities. The term graph is reserved for those graphs being modified. Moreover, nodes have explicit connection points for edges called ports – edges link to nodes through ports. Each port has a property called its “state”, which is mapped to a color; ports thus condition how nodes may con-nect/disconnect to/from each other.
Graph rewriting basics. A rewriting rule specifies how parts of a graph can be modified or rewritten. A rule is com-posed of a left-hand side (LHS), containing a description of the part of the graph with which it is concerned and a right-hand side(RHS), describing the modifications to perform. Figure1Panel 2 shows an example borrowed from molecu-lar biology. The effect of this rule is easily read from the dia-gram: assuming a graph contains a subgraph with five nodes (molecules) in the given configuration, the edge connecting the blue and green nodes is deleted. Moreover, the state of one port of the yellow and salmon nodes is also modified (color changed from red to green). Figure2gives an exam-ple of a rewriting step applying the rule presented above. The
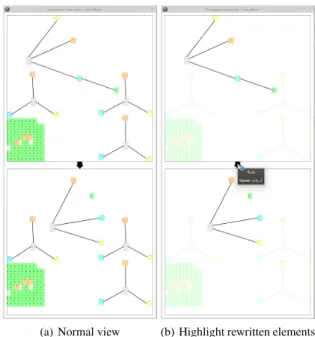
graph on which it acts, appears at the top. The output graph appears at the bottom. The mouse is used to highlight the rewritten elements.
(a) Normal view (b) Highlight rewritten elements
Figure 2: A rewriting step (rule of Figure1) before and after hovering over the edge linking the source (top) and destina-tion graphs (bottom).
More complex modifications are realized by combining rules in sequence. Such a sequence is called a derivation. Note that this graph rewriting calculus is non-deterministic since different rules may apply on a same graph and a rule may also apply in different places on a same graph. Task abstraction and design requirements. Table1lists domain-oriented tasks identified through user interviews, later confirmed through feedback on the usage of early pro-totypes. The first column states modeling problems phrased by domain experts (e.g., biologists), while the second col-umn translates this information into graph rewriting ques-tions phrased by CS experts. The third column lists all tasks we need to support. Our methodology relied on Munzner’s nested model [Mun09] at all development stages. The col-umn structure of the table is built from the nested model structure and reports our findings in accordance with these guidelines.
Editing rules. Providing a canvas to graphically design a ruleset either by drawing rules or importing previously de-fined rules is fundamental to PORGY (Table1, cells M1, G1, R1) Drawing the initial graph (G1) using simple edits, edit-ing nodes and edges in a dedicated panel (R1, A1) or easily importing it is just as important. This phase is critical when modeling system dynamics; rules capture expert knowledge
c
2012 The Author(s) c
M SYSTEMMODELING G GRAPHREWRITING QUESTIONS R TASKABSTRACTIONS DESIGNREQUIREMENTS A VISUAL / INTERACTION / ALGORITHMS M1 Design elementary molecular interactions
G1 Design the ruleset and the
initial graph G0 R1 Build/Edit G0/rules
A1 Support port graph editing M2 Define an evolution
scenario
G2 Define a rewriting strat-egy
R2 Build/Edit a rewriting strategy (e.g., reg. exp.)
A2 Drag and drop graphical en-tities between different views M3 Observe / Study system
evolution
G3 Iterate rule applications G4 Visualize their effects
R3 Grab a strategy or rule and trigger a computation R4 Replay rule applications
A3 Compute subgraph isomor-phism
A4 Show graph transformations (Animations / Small multi-ples)
M4 Keep track of computa-tions / Allow backtracking to check, adjust and/or mod-ify model
G5 Check for convergence or termination/premature end of computation
G6 Eventually fix the ruleset
R5 Trigger computations from any node of the derivation tree
R6 Show dead-end situations in the derivation tree
A5 Build and layout deriva-tion tree
A6 Tree drawing issues: grow branch from internal node, insure stability of layout M5 Query for the presence of
certain molecules at differ-ent stages
M6 Study behavior of given parameters as system evolves
M7 Alternate between param-eter behavior and model
G7 Local inspection/query of graph items (nodes, edges, subgraphs)
G8 Compute attributes or structural properties of graphs as rules are applied
R7 Select (group of) nodes R8 Test for the presence of
identical groups of nodes R9 Plot parameter evolution R10 Synchronize the plot with
the derivation tree R11 Allow selection of graph
items from the plot
A7 Emphasize selected items wherever shown A8 Manage subgraph
hier-archies
A9 Compute subgraph iso-morphism
A10 Synchronize underly-ing data structures (coor-dinated views)
M8 Study model computa-tional / structural proper-ties
G9 Check for confluence of computation
G10 Inquire about structure underlying ruleset
R12 Check whether graphs obtained from different rule sequences are the same R13 Check how/where graphs
are the same on an alternate view
A11 Compute subgraph isomor-phism
A12 Build quotient graph from equivalence relation (isomor-phism) between graphs A13 Maintain coherence with
synchronized views
Table 1: Questions/requirements for visual graph rewriting with corresponding data operations and tasks.
about the system they study. Experts carefully elaborate each rule, deciding on the structure of the RHS/LHS subgraphs, port attributes and how the rewriting acts.
The main challenge experts address when designing the rules is whether rules adequately model system behavior. Answering this question requires running a simulation (M3, G3). Although a user must be able to apply a single rule to a graph, it must also be possible to trigger the application of a derivation (G3, R3). Deciding on which rules to apply, how to combine them and how long they should be iterated has an obvious effect on the possible computation outcome. Defining an evolution scenario (M2) translates into specify-ing what/when/where rules apply, which in turn corresponds to a rewriting strategy (G2). A strategy is described by a for-mal grammar and specifies a set of admissible rules and how they combine into sequences. We thus needed to support the definition and editing of strategies, expressed using a formal language including control structures and specific operators (R2). Designing formal languages to specify rewriting strate-gies is beyond the scope of this paper and forms a whole chapter of port graph rewriting. More details on PORGY’s rewriting strategy language developed by our partners may be found in [FKN12].
Controlling non-determinism. The computing history of this non-deterministic calculus is managed using the deriva-tion tree(M4) Its root contains a user-defined start graph G0, and children nodes hold possible graphs that can be de-rived from G0by applying rules (R3). Rule sequences may be applied from any previously computed graph to produce a new branch (e.g., a derivation) in the tree (R5). Figure1
Panel 4 and Figure5(left) show a portion of a derivation tree. Black edges show single rule applications, while green curved edges correspond to the application of a strategy. The red node indicates a failure when trying to apply a rule (G5, R6). The tree appears as a living scrapbook with which the user interacts. The complexity of the rewriting system is, in a sense, captured within the derivation tree that obvi-ously forms a central object to study. The tree and its visual representation provides a device from which simulation are steered and GRS components are selected or inspected.
We have already emphasized that GRSs are non-deterministic, which is a key issue when studying these sys-tems. Determining whether or how/when/why some rules commute is central to the issue. It may well happen that rules can be applied in any order to get the same result – in other words, the application of certain rules may well be
c
B. Pinaud, G. Melançon and J. Dubois / PORGY: A Visual GRS for Complex Systems
parallelized. This property, called confluence, often is at the center of the analysis of a GRS (M8, G9, R12). Confluence might only occur locally and concern only a few rules (G7, G9). Discovering that confluence only occurs locally might correspond to phases that the system must undergo before reaching a stable state. Because confluence occurs whenever two distinct branches in the derivation tree produce isomor-phic graphs (G9, A11) confluence related issues required the design and implementation of dedicated interaction and al-gorithms (see Section4).
Tracking system evolution. The study of the rewriting sys-tem requires alternating between a local view of a rule or a given graph in the tree and a global view of the whole deriva-tion tree (M7). This need embodies the overall challenge: to understand how the global system behavior emerges from rules specifying how local modifications operate and a strat-egy indicating how the rules are applied. It is precisely by looking atthe graphs in the derivation tree, both at a lo-cal and global slo-cale, that a domain expert is able to judge the model’s adequacy or check postulated properties. Visual graph inspection by zooming and panning is obviously nec-essary to support this task.
Typically, when performing this local-global visual in-spection, questions concerning the presence of a given pat-tern emerge. Several simple questions must be answered (M6-7, G7-8): When did these nodes appear/disappear? How long have they been present? When was that binding (edge) created/destroyed? A visual query mechanism provides a simple method to answer these queries (R7); the details un-derlying this query mechanism are discussed below. In the same spirit, after selecting a branch of interest, a user should be able to replay the various transformations step-by-step and understand how things occurred (M3, R4, A4).
Numerical computations obviously complement a quali-tative system evaluation. Plotting a curve in a separate and coordinated view alongside the derivation tree appeared as an effective solution allowing to easily track system param-eters(M6). For instance, computing the evolution of a given type of node along a given derivation might be interesting because users expect this derivation to influence the overall system behavior. We designed the coordination of these two views so the plot could be directly computed from graphs se-lected along a branch. Conversely, these graphs were them-selves embedded into the plot so the derivation tree could be queried by selecting a portion of the curve.
3. Visual Encoding and Interaction
A decisive phase of our project was to decide on relevant graphical representations, visual encodings and interaction to support all tasks and requirements listed in Table1. GRS is a domain with a long tradition in graphical node-link representations for graphs, and to the best of our knowl-edge, all software systems supporting GRS-related tasks
dis-play graphs as node-link diagrams. This choice makes sense as node-link representations are well suited for connectiv-ity tasks, as opposed to other representations including ma-trix views [GFC05]. Moreover, the tasks our users perform mostly consist of comparing items in similar graphs and are not completely covered by taxonomies proposed in the liter-ature [LPP∗06]. The strong graphical conventions developed by the graph rewriting research community explain why our users discarded hybrid representations [vLKS∗11] and re-quired that PORGY be designed around node-link diagrams. Because the LHS of rules occur as subgraphs in the graph be-ing rewritten, the same type of representations had to be used for rules and the graphs on which the rules act. The graph-ical attributes for nodes (e.g., shape, color, display and port position) and edges (e.g., shape, color) were decided based on existing graphical conventions (textbooks).
The rewriting rules are used in two different ways: as the focus of interest when they are edited, inspected or modified (M4, G4, G7, R1) and as triggers for computations (G3, R3). Visual inspection of a rule relies on a visual representation of the graphs it comprises, so users must be able to access the node-link representation of a rule on demand. Because not all rules of a ruleset should be permanently displayed as full size graphs, rules are shrunk into glyphs on the side of the screen (Figure1Panel 1). Rules are accessed by dragging and dropping the glyph onto the central canvas.
Derivation tree. As discussed above, the derivation tree is a central object in the study of a rewriting system. The branch structure of the tree must be made explicit because a branch corresponds to a sequential application of rules (as if time evolved while traversing a branch, A5-6). The relatively lin-ear display of branches in a top-down hierarchical repre-sentation of trees moreover provides a sense of causality, which is relevant when studying GRS. Alternate represen-tations, including circular/radial tree layout or space filling, do not comply with this requirement. Moreover, nodes of the derivation tree correspond to graphs derived from rule appli-cations. The layout of the derivation tree is compound, and nodes display node-link representations of graphs. Zooming in allows users to visually inspect and directly manipulate graphs. The next section discusses implementation details.
Dragging and dropping a rule onto a node of the deriva-tion tree triggers its applicaderiva-tion (R3). By contrast, Ruleben-der [SXS∗11] focuses on biochemical networks where con-nections (edges) correspond to actual physical contact, rules andgraphs are embedded in a unified view (called the con-tact map). Embedding rules and a graph in a same view does not scale well as the size of graphs and number of rules in-crease, as we may expect the view to become cluttered and hard to achieve (the layout of rules overlapping parts of the graph indeed compares with the layout of overlapping sub-sets [SAA09]).
Assume a portion of a branch becomes the focus of in-terest. The user may wish to leave the derivation tree view
c
2012 The Author(s) c
to closely inspect those transformations that occurred in the graph (M7). Two different visualization allow users to have a closer look at how graphs evolved as they were rewritten (A4). Changes can be shown using animation, which in turn imposes requirements on the layout (Section4). Or through a small multiples view of graphs appearing along a branch, displayed in sequence – one for each step of a rule applica-tion (Figure3). These views are complementary, and both offer advantages depending on the task the user is perform-ing [APP10].
Figure 3: Small multiples view. The transformation (rule on the right) is detailed as a four step process. Red edges indi-cate how existing edges must be rewired to ports.
4. Data structures, algorithms and implementation We have implemented PORGY in C++ on top of Tulip [AAB∗12]. PORGY can be downloaded as a stan-dalone application fromhttp://tulip.labri.fr. In the following paragraphs, we discuss issues related to the implementation and design of the underlying algorithms re-lated to the various components of PORGY (Table1, Col. 4). Data structures. PORGY requires graph structures capable of dealing with basic properties (e.g., node and edge proper-ties, visual shapes and colors) or more complex capabilities (e.g., show and manipulate a compound derivation tree). The GRS complexity and data abstractions we must support are quite demanding on the underlying data structure.
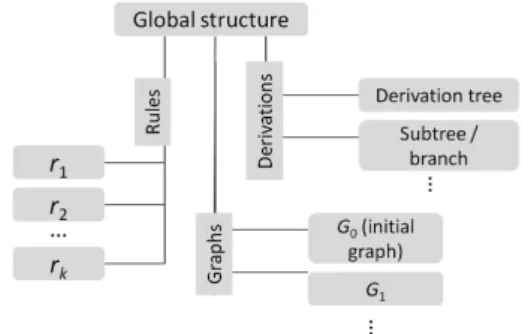
In a sense, the considered paradigm for the graph being rewritten is a dynamic graph evolving according to rewrit-ing rule applications, as if we were considerrewrit-ing only one graph whose topology evolves. However, on the data struc-ture level, we must have access to every graph derived from the original graph G0. This condition requires that all graphs derived from G0 share common nodes and edges through an adequate inheritance mechanism to insure coher-ence and achieve scalability. Figure4shows how the over-all data structure is organized, with a global entity including all lower-level structures and elements. The global structure
splits into three specialized entities respectively managing Rules, Derivations and Graphs. We exploit Tulip’s capabil-ity of efficiently managing subgraph hierarchies (A8) and instantiate each entity as a Tulip subgraph, part of a global graph entity:
• The Rules entity merely contains a series of distinct graphs. Each rule is defined with its own nodes and edges (rules do not share nodes or edges) and are mainly read when performing a rewriting operation.
• The Graphs entity is initialized with the elements of G0. Each graph derived from G0after the successful applica-tion of a rule is a subgraph of Graphs. This construcapplica-tion allows graphs to share common elements, hence saving memory and ensuring scalability.
• The Derivations entity stores all information to build the derivation tree. The nodes of the derivation tree refer to subgraphs of the Graphs entity. The Derivations entity also contains subtrees to support various operations per-formed on the derivation tree (R9, R10, R11 and R13).
Figure 4: Underlying PORGY’s data structures organized as a set of high-level entities.
Because graph elements are shared through the Graphs entity, we rely on Tulip’s inheritance mechanism to support some tasks. For instance, selecting a node n in a graph posi-tions a boolean property for n. Because n belongs to Graphs, the property value is inherited and becomes available to all graphs using n, so it can be highlighted in all graphs. In ad-dition, because nodes of the derivation tree contain graphs, ncan be easily highlighted in the nodes of the derivation tree. The same mechanism acts for layouts, so we ensure the node-link view of a subgraph is consistent through all com-ponents of which it is part.
Graph and subgraph isomorphisms. Applying rules re-quires finding isomorphic copies of the LHS subgraph (A3). Though the subgraph isomorphism problem is NP-Complete over the class of unlabeled graphs [GJS76], it becomes tractable when dealing with labeled graphs, as in our case (except that labels may not be unique). The LHS most of-ten acts on small subgraphs (half-dozen nodes in general). The subgraph search algorithm we implemented is inspired by Ullmann’s original algorithm [Ull76]. Subgraph search
c
B. Pinaud, G. Melançon and J. Dubois / PORGY: A Visual GRS for Complex Systems
raises a scalability issue: LHS subgraphs of rules are easily found, mainly because they are small, but at the same time, they can be found in large numbers.
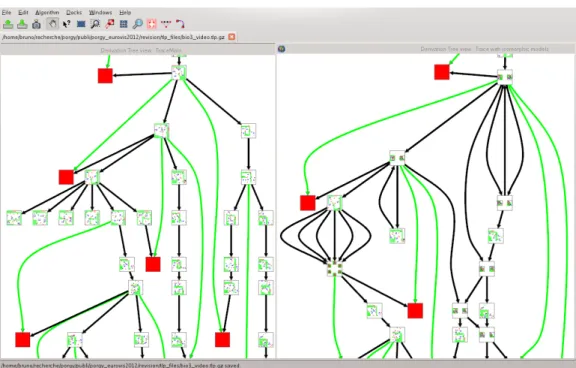
The subgraph isomorphism is also used to merge iso-morphic nodes of the derivation tree (R12-13) and turn the derivation tree into a graph (A11-12). Using Tulip’s features to manage graph hierarchies, groups of isomorphic graphs are created and stored as part of the Derivations entity. The edges of the resulting graph (Figure5) are deduced from edges between nodes of the derivation tree. The resulting graph may contain cycles (systems returning to a previous state) and multiple edges pointing at a same node, showing local confluence (see Section5).
Graph layouts. Laying out the graphs from the Rules and Graphsentities is domain-dependent. Biochemical calculus graphs were drawn using a force-directed layout based on GEM [FLM95]. Interaction nets involve tree-like graphs laid out using a Sugiyama-based algorithm [STT81]. PORGY may use any existing or customized layout algorithm for graphs and include it as a Tulip plug-in.
As already mentioned, the sequence of graphs occurring along a branch of the derivation tree can be seen as a dy-namic graph whose topology evolves. This condition im-poses requirements on the layout algorithm if we are to pre-serve the user’s mental map (although the importance of the mental map seems less important than expected [APP10]). Most layout algorithms consider sequences of incremental changes performed on the topology of a graph and solve the mental preservation problem by computing a consensus lay-out that minimizes moves between time slices [FT08]. The situation faced here adds an additional constraint because we do not consider sequences of incremental changes but rather a hierarchy of incremental changes.
The layout of rules also requires attention because users may import rules with no prior layout. Most authors (in graph rewriting theory) use symmetry as a central aesthetics to emphasize the changes operated by a rule. The heuristic we implemented lays out the RHS graph to optimize its aes-thetics and try to symmetrically match the LHS as much as possible. Although symmetry is a dominant aesthetic, there are cases where it must be broken. Because edges necessarily connect to ports, the LHS and RHS layouts must sometimes reorder ports to avoid edge crossings, for instance. This port reordering also applies to graphs in general.
Finally, care must be taken to draw the derivation tree. Al-though we referred to it as a tree, the presence of green edges for strategies turns it into a directed acyclic graph. Because it does contain a tree on top of which cross level edges are added, we were able to adapt the Sugiyama layout [STT81] to obtain the desired effect of each node being assigned to a layer coinciding with its depth in the tree. The routing of edges must be done carefully to ensure that they stay close to the tree branch they summarize.
5. Case Studies
Our first case study involves applying GRS to molecular bi-ology. Our second case study stems from theoretical CS. Ad-dressing two user communities was turned into an advantage that sought versatility and portability.
Biochemical network. Biochemical networks contain dif-ferent types of molecules interacting over time, maintain-ing necessary regulation mechanisms. The challenge for bi-ologists is building models that explain how/when specific molecules reach given concentrations and whether these quantities can be used to track the system, reliably pre-dict its evolution and simulate for instance a regulation mechanisms. Knowledge gained from wet lab experiments suggests that a regulation mechanism relates to the evolu-tion pattern of the concentraevolu-tion of a particular molecule type. Hypothesis were made that these concentrations should evolve stepwise, following a staircase pattern. Moreover, bi-ologists assumed that a non-deterministic combination of only four biochemical reactions (e.g., the rules) is com-plex and powerful enough to fully explain the studied phe-nomenon. More details on the biological background of this case study are available in [AC10,AFK∗11].
When addressing this type of problem using GRSs, rules are first drawn and laid out using a (port) graph editor (Table1, A1). The initial graph is defined by specifying a concentration of non-interacting molecules (i.e., number of nodes). The system can then be simulated through repeated rule applications, for as long as they can occur (M3, G3– 4). The constraints associated with rules are captured by de-signing an evolution scenario (M2), defining a strategy to forbid parallel applications of rules (which has no biological meaning) and allow for a non-deterministic but probabilis-tic choice of rules (G2). Choosing a rule is accomplished by dragging and dropping the involved rules onto the strategy panel and combining them with proper operators (A2). The development of the underlying formal language [FKN12] to describe strategies evolved as users (biologists and com-puter scientists) experimented with our environment. Sev-eral iterations were necessary, reasoning about the system and testing several different combinations of rules, to design adequate rulesets and strategies. The rule given in Figure1
Panel 2 is one of these reactions and is applied to the graph of Figure2.
Simulating this in silico system, experts hope that the model relying on non-deterministic rule combinations will successfully replicate a known behavior: that the concentra-tion of a specific molecule increases stepwise (M6). Drag-ging and dropping a strategy over a graph (or the correspond-ing node of the derivation tree) triggers its application and simulates the repeated action of all possible reactions un-der the specified conditions (M3, R3). The applicability of a strategy on a node of the derivation tree is computed in real-time to provide visual feedback (the hovered node in
c
2012 The Author(s) c
Figure 5: Derivation tree before (left) and after (right) isomorphic nodes (graphs) have been merged together. Cycles indicate that the previous effect of a rule was canceled. Multiple parents situations reveal confluence.
the derivation tree is highlighted in green to indicate the ap-plicability of the strategy). Visually inspecting the sequence of graphs produced by the strategy reveals how these re-actions may combine (M3, G4, R4, A4). The initial graph simply consists of unlinked molecules. As reactions occur, molecules become increasingly involved in the network. The relative amount of yet unused molecules can be visually as-sessed for a first impression of the model accuracy or cor-rectness.
Numerical validation of the model is performed by track-ing molecule concentration (M6). Selecttrack-ing a branch in the derivation tree, a plot is computed out of graph attributes evolving throughout the rewriting process (G8, R9). The plot (Figure6) is realized as an alternative layout for a branch, embedding nodes as points in the plot (and edges as lines). The nodes are positioned following the concentration of molecules of a given type, coinciding with the number of nodes of a given type in the corresponding graph. The stair-case shape of the plot confirms the ability of the designed model to explain the regulation mechanism as expected by the biologist. Because all views are synchronized (A10) and nodes of the derivation tree are embedded into the plot, the user may select part of the plot and query the derivation tree to visualize when a given state is reached (R7, R9, A7, A10). Interaction Nets. Interaction nets define a programming language based on graph reduction, implementing linear logic [Mac02]. Agents (vertices) have specific ports and
con-Figure 6: Evolution of the concentration of molecules (nb. of nodes) of a given type for a series of graph. Nodes are selected from within the plot (left) to query the derivation tree (right) and find when a given concentration is reached.
nect following precise patterns to form a net. Rules specify how connections are duplicated, erased or rewired to sim-plify nets and build theorem proofs. When designing an in-teraction net, specifying agent types and rewriting rules, the challenge is showing that rules indeed simulate linear logic
c
B. Pinaud, G. Melançon and J. Dubois / PORGY: A Visual GRS for Complex Systems
(sequent calculus). A careful study of the net, tracking its structural parameter, is often necessary to assess the impact of explicit duplication and erasure on performance, bench-marking a net against another known linear logic implemen-tation.
Researchers developed three different rulesets for interac-tion nets implementing basic arithmetic. A first model for in-teger addition in N was built using only two rules exploiting properties of Peano’s successor function. Integer subtraction required a completely different model (agents of a different type) relying on three rules. Extending the model to integer multiplication is difficult and requires using eight different rules, a duplication agent turning multiplication into a se-quence of addition and an eraser agent. Our environment was used to benchmark these models against more traditional λ-calculus approaches, showing the expression power of inter-action nets [Gou10].
GRS performance is about whether different rule se-quences have the same effect on a graph (confluence – M8, G9-G10). Selecting a graph from the derivation tree, users may query for other tree nodes containing isomorphic graphs, giving a first impression of how confluence occurs in the system (R12). To determine whether the system builds through different phases, we impose an equivalence relation on the tree and fold it into a graph (R13); isomorphic nodes are contracted into a single node from which cycles may emerge (A11-12). The structure of the quotient graph con-tains high-level information about system behavior. Com-pared to more traditional approaches, interaction nets en-force linearity – each port connects to a single edge, from which we can derive strong confluence. This property re-veals itself through clear diamond-shape parallel paths in the quotient view and proved extremely useful in the study of interaction nets. In a near future, PORGY will be used in classrooms to illustrate interaction nets concepts and run examples.
Interaction nets researchers have been extremely receptive to this visualization tool. They believe that the development of our environment improves on past efforts to develop a fully visual functional programming environment [MPV07] and are confident that our environment will develop a wide user base in their community.
6. Conclusion
We have presented the visual environment PORGY support-ing rule-based modelsupport-ing. The need for such a visual envi-ronment was motivated by the fact that most textbooks and papers present GRS concepts, results and examples graphi-cally. PORGY enables users to directly work with drawings at all times, from rule design to model simulation and val-idation, making it quite unique among all available appli-cations supporting GRS. To our knowledge, no other visual GRS deals with non-determinism to allow simultaneous ex-ploration of multiple rewriting scenarios.
In a typical mode of use, domain experts set up their own rules and describe how they should be applied by specifying a rewriting strategy. The challenge for experts is to be able to design the right set of rules, as well as the right strategy. The derivation tree is used to run simulations, explore and reason about the GRS. The learning curve certainly is quite steep for users that are less familiar with rule-based modeling. Those familiar with GRS concepts and theory find all the graphical components and their combination quite natural and “usual”. Other modes of use might emerge as our system extends to a larger palette of application domains.
Parameter tracking (see Figure6, Section5) is for now somehow limited, as the system only allows to track param-eters that readily follow from graph topology, one at a time. Building complementary visualization of multiple parame-ters (using scatterplots or multiple histograms, for instance) is certainly desirable. Additional work is required to allow port nodes to carry domain specific attributes that would not be inferred from topology.
The required amount of work to properly deal with rules, both graphically and internally, came as a surprise. The graphical definition of rules by GRS experts are extremely context-dependent and sometimes ambiguous. Most of the time graphical description of rules (sketches) will indicate how certain elements are transformed while the remain-ing elements remain “unchanged”. Although this structure preservation principle may be clear to a human reader, we needed to make this explicit in the system, as well as on the screen, and take special care to disambiguate rule appli-cation. Moreover, in some cases the layout of rules follow graphical conventions carrying domain semantics. Some ap-plications require to keep RHS graphs as close as possible to their LHS, while other domains may turn the RHS upside-down to reveal the effect of a transformation. Unfortunately, there is no universal layout for drawing rules as application domains often follow specific graphical conventions. At this time, we used force-directed layouts for molecular biology and Sugiyama style layouts for interaction nets.
Graphs output through series of rewrites form a special case of (time-stamped) dynamic graphs. We thus plan to re-visit dynamic graph layouts; for now, our environment uses customized versions of existing algorithms [GN00,FT08]. The scalability of our environment would allow a systematic computation of all possible rule applications (up to a certain numbers of steps), unfolding the computation onto a large derivation tree. Focus+context exploration has been sug-gested as a possible solution when exploring a large deriva-tion tree. Debugging features, tracking rule applicaderiva-tion and inserting breaking points to stop computation when entering given situations are also part of our future plans.
Acknowledgements. The authors wish to thank their col-laborators, users and GRS experts – O. Andrei, M. Fernan-dez, H. Kirchner, O. Namet, for useful discussions and en-lightening remarks during all phases of this work.
c
2012 The Author(s) c
References
[AAB∗12] AUBERD., ARCHAMBAULTD., BOURQUIR., LAM
-BERTA., MATHIAUTM., MARYP., DELESTM., DUBOISJ., MÉLANÇONG.: The Tulip 3 Framework: A Scalable Software Library for Information Visualization Applications Based on Re-lational Data. Tech. Rep. RR-7860, Inria, Jan. 2012.2,6
[AC10] ANDREIO., CALDERM.: A Model and Analysis of the AKAP Scaffold. In Proc. of CS2Bio (2010), Krivine J., Troina A., (Eds.), vol. 268 of ENTCS, pp. 3–15.7
[AFK∗11] ANDREI O., FERNÁNDEZ M., KIRCHNER H., MELANÇON G., NAMETO., PINAUDB.: PORGY: Strategy-Driven Interactive Transformation of Graphs. In TERMGRAPH (2011), Echahed R., (Ed.), vol. 48, pp. 54–68.3,7
[AK08] ANDREIO., KIRCHNERH.: A Biochemical Calculus Based on Strategic Graph Rewriting. In 3rdInt. Conf. on
Alge-braic Biology(2008).1
[AK09] ANDREI O., KIRCHNER H.: A port graph calculus for autonomic computing and invariant verification. In TERM-GRAPH(2009), ENTCS, Elsevier.1
[APP10] ARCHAMBAULTD., PURCHASEH., PINAUDB.: An-imation, small multiples, and the effect of mental map preserva-tion in dynamic graphs. IEEE Trans. on Visualizapreserva-tion and Com-puter Graphics 17, 4 (2010), 539–552.6,7
[EEK∗97] EHRIGH., ENGELSG., KREOWSKIH.-J., , ROZEN
-BERGG. (Eds.): Handbook of graph grammars and computing by graph trasnformation, vol. 1–3. World Scientific, 1997.1
[ERT97] ERMEL C., RUDOLF M., TAENTZER G.: The AGG approach: Language and environment. In Handbook of Graph Grammars and Computing by Graph Transformations, vol. 2. World Scientific, 1997, pp. 551–603.2
[FBH09] FAEDER J. R., BLINOV M. L., HLAVACEK W. S.: Rule-Based Modeling of Biochemical Systems with BioNetGen. In Systems Biology, Methods in Molecular Biology. Humana Press, 2009, pp. 133–168.1,2
[FKN12] FERNANDEZM., KIRCHNERH., NAMETO.: A strat-egy language for graph rewriting. In Proc. of Logic-Based Pro-gram Synthesis and Transformation (LOPSTR)(2012), LNCS, Springer, p. To appear.4,7
[FLM95] FRICKA., LUDWIGA., MEHLDAUH.: A fast adaptive layout algorithm for undirected graphs. In Graph Drawing 94, vol. 894 of LNCS. Springer, 1995, pp. 388–403.7
[FT08] FRISHMANY., TAL A.: Online dynamic graph draw-ing. IEEE Trans. on Visualization and Computer Graphics 14, 4 (2008), 727–740.7,9
[GBG∗06] GEISSR., BATZG. V., GRUNDD., HACKS., SZA
-LKOWSKIA.: GrGen: A Fast SPO-Based Graph Rewriting Tool. In ICGT (2006), vol. 4178 of LNCS, Springer, pp. 383–397.2
[GFC05] GHONIEMM., FEKETEJ.-D., CASTAGLIOLAP.: On the readability of graphs using node-link and matrix-based rep-resentations: a controlled experiment and statistical analysis. In-formation Visualization (Palgrave) 4, 2 (2005), 114–135.5
[GGZ∗05] GRUNSKEL., GEIGERL., ZÜNDORFA., EETVELDE
N., GORPP., VARRÓD.: Using graph transformation for prac-tical model-driven software engineering. In Model-Driven Soft-ware Development. Springer, 2005, pp. 91–117.1
[GJS76] GAREY M. R., JOHNSON D. S., STOCKMEYER L.: Some simplified NP-Complete graph problems. Theoretical Computer Science 1(1976), 237–267.6
[GN00] GANSNERE. R., NORTHS. C.: An open graph visual-ization system and its applications to software engineering. Soft-ware — Practice and Experience 30, 11 (2000), 1203–1233.9
[Gou10] GOUDSMIT J.: An optimal implementation of the lambda-calculus. Software Technology Colloquium, 2010.9
[HESL09] HELMS B., EBEN K., SHEAK., LINDEMANN U.: Graph grammars - a formal method for dynamic structure trans-formation. In 11thInt. Dependency and Structure Modelling
(DSM) Conf.(2009), pp. 93–103.2
[Laf90] LAFONTY.: Interaction nets. In Proc. of the 17thACM
Symp. on Principles of Programming Languages(1990), ACM Press, pp. 95–108.1
[LPP∗06] LEE B., PLAISANT C., PARR C. S., FEKETE J., HENRYN.: Task taxonomy for graph visualization. In AVI Work. on Beyond Time and Errors: Novel Evaluation Methods For in-formation Visualization (BELIV)(2006), ACM.5
[Mac02] MACKIEI.: Encoding linear logic with interaction com-binators. Information and Computation 176 (2002), 2002.8
[MPV07] MACKIE I., PINTO J. S., VILAÇA M.: Visual pro-gramming with recursion patterns in interaction nets. In 6thInt.
Work. on Graph Transformation and Visual Modeling Techniques (2007), Elec. Comm. EASST.9
[Mun09] MUNZNERT.: A nested process model for visualization design and validation. IEEE Trans. on Visualization and Com-puter Graphics 15, 6 (2009), 921–928.1,3
[NNZ00] NICKELU., NIEREJ., ZÜNDORFA.: The FUJABA environment. In ICSE (2000), pp. 742–745.2
[Plu09] PLUMPD.: The Graph Programming Language GP. In CAI(2009), vol. 5725 of LNCS, Springer, pp. 99–122.2
[Rod98] RODGERSP.: A graph rewriting programming language for graph drawing. In Proc. of IEEE Symp. on Visual Languages (1998), pp. 32–39.1
[SAA09] SIMONETTOP., AUBERD., ARCHAMBAULTD.: Fully automatic visualisation of overlapping sets. Computer Graphics Forum 28, 3 (2009), 967–974.5
[STT81] SUGIYAMAK., TAGAWAS., TODAM.: Methods for Visual Understanding of Hierarchical Systems Structures. IEEE Trans. Systems, Man and Cybernetics 11, 2 (1981), 109–125.7
[SWZ97] SCHÜRRA., WINTERA. J., ZÜNDORFA.: The PRO-GRES Approach: Language and Environment. In Handbook of Graph Grammars and Computing by Graph Transformations, Ehrig H., Engels G., Kreowski H.-J., Rozenberg G., (Eds.), vol. 2. World Scientific, 1997, pp. 479–546.2
[SXS∗11] SMITHA. M., XUW., SUNY., FAEDERJ. R., MARAI
G. E.: Rulebender: Integrated visualization for biochemical rule-based modeling. In 1stIEEE Symp. on Biologial Data
Visualiza-tion(2011).1,2,3,5
[Ull76] ULLMANN J. R.: An algorithm for subgraph isomor-phism. Journal of the ACM 23, 1 (1976), 31–42.6
[vLKS∗11] VONLANDESBERGER T., KUIJPER A., SCHRECK
T., KOHLHAMMERJ.,VANWIJKJ., FEKETEJ.-D., FELLNER
D.: Visual analysis of large graphs: State-of-the-art and future research challenges. Comp. Graph. Forum 30, 6 (2011), 1719– 1749.5
[WFR∗10] WASERJ., FUCHSR., RIBI ˇCI ´CH., SCHINDLERB., BLÖSCHLG., GRÖLLERM. E.: World Lines. IEEE Trans. on Visualization and Computer Graphics 16, 6 (Nov. 2010), 1458– 1467.2
c