HAL Id: inserm-01192820
https://www.hal.inserm.fr/inserm-01192820
Submitted on 3 Sep 2015
HAL is a multi-disciplinary open access
archive for the deposit and dissemination of
sci-entific research documents, whether they are
pub-lished or not. The documents may come from
teaching and research institutions in France or
abroad, or from public or private research centers.
L’archive ouverte pluridisciplinaire HAL, est
destinée au dépôt et à la diffusion de documents
scientifiques de niveau recherche, publiés ou non,
émanant des établissements d’enseignement et de
recherche français ou étrangers, des laboratoires
publics ou privés.
achieved by French national programmes?
Jonathan Sicsic, Carine Franc
To cite this version:
Jonathan Sicsic, Carine Franc. Obstacles to the uptake of breast, cervical, and colorectal cancer
screenings: what remains to be achieved by French national programmes?. BMC Health Services
Research, BioMed Central, 2014, 14, pp.465. �inserm-01192820�
R E S E A R C H A R T I C L E
Open Access
Obstacles to the uptake of breast, cervical, and
colorectal cancer screenings: what remains to be
achieved by French national programmes?
Jonathan Sicsic
*and Carine Franc
Abstract
Background: In France, equality in access to screening has been one of the main thrusts of public policies
implemented between 2009 and 2013 (the national cancer plan). Our aim in this study was to analyse the obstacles to and levers for breast, cervical, and colorectal cancer screening uptake and their trends over time.
Methods: Based on representative data from the French Health Care and Health Insurance Survey (three independent, cross-sectional surveys: 2006, 2008, and 2010), multivariate logistic regressions were used to model the association between the nonuse of screening for the three cancers and various independent variables. Then, interactions with survey year dummies allowed the changes in the determinants of these cancer screenings over time to be estimated.
Results: Whereas the incentives for screening were strengthened during the period considered, cervical and breast cancer screenings decreased, and colorectal cancer screenings increased sharply (from 18.2% (95% CI = [17.0-19.4]) in 2006 to 38.9% (95% CI = [37.4-40.5] in 2010. Under-users of the three cancer screenings were primarily unskilled workers (ORcervix= 1.64 [1.38-1.95]), individuals without complementary health insurance (ORbreast= 2.05 [1.68-2.51]),
or individuals with free complementary health insurance who more rarely use outpatient care. Moreover, individuals reporting either risky behaviours, namely heavy smokers (ORcolorectal= 1.70) and high-risk drinkers (ORcervix= 1.42) or
very safe behaviours, namely neither smoking nor drinking, underused screenings. Despite the implementation of national programmes for breast and colorectal cancer screenings, the disparities and inequalities in screening uptake did not decrease over the study period.
Conclusions: These results demonstrate the need for additional primary prevention efforts targeting the identified under-users by focusing on, for instance, individuals with a very healthy lifestyle. Health authorities could also intensify their efforts to promote increased access to screening for the most disadvantaged individuals. Keywords: Breast cancer screening, Cervical cancer screening, Colorectal cancer screening, Inequalities
Background
Cancer is one of the leading causes of disease and mor-tality [1]. Breast and colorectal cancer are among the most commonly diagnosed cancers worldwide [2]. Stu-dies published in the mid-1990s have shown that pre-vention practices and cancer screening both play a key role in reducing cancer prevalence, morbidity, and mor-tality [3-5]. A recent report from the French National Cancer Institute [6] reaffirms this finding and highlights
the central role that primary care physicians play in pro-viding cancer screening. However, recent analyses of the inequalities in screening uptake in France as well as other northern countries are in general agreement, highlighting the persistent role of socioeconomics (e.g., income, educational level, private health insurance ac-cess) and family structure [7-11]. For instance, concern-ing breast and cervical cancer, poor, unmarried women with lower levels of education and less access to health care are less likely to be tested [11,12]. Beck and Gautier [13] emphasise the positive impact of being older, living in a couple, having children, and more frequently
* Correspondence:jonathan.sicsic@inserm.fr
Cermes3, UMR8211, Inserm U988, Site CNRS, 7, rue Guy Moquet, 94801 Villejuif Cedex, France
© 2014 Sicsic and Franc; licensee BioMed Central Ltd. This is an Open Access article distributed under the terms of the Creative Commons Attribution License (http://creativecommons.org/licenses/by/4.0), which permits unrestricted use, distribution, and reproduction in any medium, provided the original work is properly credited. The Creative Commons Public Domain Dedication waiver (http://creativecommons.org/publicdomain/zero/1.0/) applies to the data made available in this article, unless otherwise stated.
consulting a general practitioner (GP) on colorectal can-cer screening uptake. Kobayashi et al. highlight health literacy and Lo et al. highlight dislike of the test as bar-riers to colorectal cancer screening in England [14] (and Great Britain [15], respectively).
Policy mechanisms have been implemented based on these findings, and cancer screening remains one of the main thrusts of the French2009–2013 Cancer Plan, with a stated priority of combating inequalities in access to and use of screening. There is no national programme for cervical screening (only experiments are ongoing), but national screening programmes targeting breast can-cer and colorectal cancan-cer have been established in France since 2004 and 2009, respectively. The national screening programme for breast cancer targets women between 50 and 74 years of age and consists of sending a voucher through the mail that allows each eligible woman to benefit from a free screening at a radiological centre participating in the programme. The national screening programme for colorectal cancer targets men and women between 50 and 74 years of age and consists of sending a faecal occult blood test (FOBT) (accompanied by direc-tions on how to perform the test) through the mail, for a free laboratory analysis. In addition to these programs, in-centives directed towards GPs have been implemented in France, targeting breast cancer screening since 2009 and cervical cancer screening since 2012. These incentives consist of financial bonuses to referral GPs who have screened 80% of their eligible patients. Yet, the impact of these schemes has not been evaluated thus far.
Numerous studies have examined the determinants of cancer screening uptake, but few studies have analysed how these determinants have changed over time, par-ticularly in response to the recent implementation of mass screenings and/or national programmes. The re-sults of preliminary studies indicate that in France, the impact of the social gradient seems to have decreased in 2010 (vs. 2005); however, the inequalities in access for the poorest individuals have persisted [16]. In a different context, De Maio et al. [17] show that the impact of income and educational level on cervical cancer scree-ning use remained stable between 2005 and 2010 in Argentina, but in the case of breast cancer, the impact of education has decreased.
In the context of the strengthening of prevention policies through the implementation of national screening pro-grams, financial incentives, and a third National Cancer Plan, one would expect the screening rates for breast and colorectal cancers to have increased and the inequalities re-lated to socioeconomics and/or health care access to have decreased between 2006 and 2010. The objective of this paper is to model the determinants of the failure to partici-pate in cervical, breast, and colorectal cancer screenings in France and to study the trends in these determinants over
time, i.e., between 2006 and 2010. The goal is twofold: first, to contribute to the debate on the efficacy of policies implemented to reduce screening disparities and/or in-equalities and, second, to identify potential remaining ob-stacles to screening to better target and tailor policies promoting screening use. Throughout the paper, the term “inequalities” refers to observed disparities in cancer screening uptake that are assumed to arise from access to care or systemic barriers. The term“differences” refers to the associations between other variables/determinants (e.g., socioeconomic status, risky behaviours) and cancer screening uptake, for which determining whether they are related to the choices of patients or the equity of the health care system is not possible.
Methods
The ESPS survey
The Health Care and Health Insurance Survey (Enquête Santé et Protection Sociale, ESPS) was conducted by the Research and Information Institute for Health Economics (IRDES) annually between 1988 and 1997 and has been conducted every 2 years since 1998. The ESPS is admi-nistered to a representative, population-based sample of French households that are randomly drawn from public health insurance files. It combines interviews (telephone or face to face) and self-administered questionnaires [18]. The declarative data provide information on both the household (income, household type, region of residence) and its members (e.g., socioeconomic characteristics, health care, and prevention behaviours). All of the benefi-ciaries of health insurance belonging to the ESPS sample, as well as members of their households, were surveyed every four years. The sampling database was renewed in 2010; thus, the 2006, 2008 and 2010 ESPS samples com-prised different subpopulations. The response rates were 63% in 2006, 65% in 2008, and 66% in 2010.
Ethics
This study was planned as a research project. All precau-tions were taken by the IRDES to ensure anonymity of the data. The construction of the ESPS samples as well as data analysis was approved by the CNIL (Commission Nationale de l’Informatique et des Libertés, French law no. 78–17, authorisation number: 1147702)a. According to the French law, written informed consent was not required for this type of study. The three ESPS databases are avail-able upon request and research collaboration with the IRDES.
Dependent variables
We were interested in 3 outcomes: cervical, breast, and colorectal cancer screenings following the French Health Authority’s guidelines. The first outcome of interest was whether a woman between 25 and 65 years
old received a Pap smear for cervical cancer within the past 3 years. The second outcome of interest was whether a woman aged between 50 and 74 years re-ceived a mammogram for breast cancer in the past 2 years. The third outcome of interest was whether an individual aged between 50 and 74 years performed a FOBT for colorectal cancer in the past two years. Independent variables
The determinants of the cancer screening uptake were grouped into 3 categories: (1) socioeconomic charac-teristics, (2) health and health care consumption, (3) risky behaviours and prevention use. For category 1, we considered age, region of residence, social class (following the French National Institute of Statistics and Economic Studies codification), marital status, and complementary health insurance status (private/free/ no)b. In category 2,a dichotomous variable indicating whether the individual reported having a chronic dis-ease (yes/no) was used, and individuals’ opinion of their health was measured with a 4-category, self-rated health variable constructed from a 10-point Likert scale (0 = lowest health state, 10 = best health state). Health care consumption was measured based on the number of consultations with a GP over the past 12 months and the number of consultations with a specialist over the past 12 months. In category 3, risky behaviours were measured via the levels of tobacco and alcohol con-sumption. Four classes were defined to describe risky behaviours related to tobacco use: nonsmokers, ex-smokers, light smokers (i.e., smoking 10 or fewer ciga-rettes per day), and heavy smokers (i.e., smoking more than 10 cigarettes per day). Similarly, four alcoholism profiles were constructed following a well-established typology based on the Alcohol Use Disorders Iden-tification Test (AUDIT-C) questionnaire [19,20]: non-drinkers, safe consumers, occasionally risky consumers, and high-risk consumers. To address prevention use, we included screening activity for other cancers for which individuals were eligible. Thus, in the model for individual breast cancer screening uptake, we included whether the woman had received a FOBT in the past 2 years as a predictor, and in the model for individual colorectal cancer screening (females only), we included whether the woman had received a mammogram in the past 2 years as a predictorc.
Descriptive statistics
The descriptive statistics were used, first, to assess the levels and trends in cervical, breast and colorectal can-cer screening uptake and, second, to examine whether the distributions of the independent variables were simi-lar across the surveys.
Analytical strategy
The three ESPS samples (2006, 2008, and 2010) were pooled, and a multivariate logistic model was estimated to determine the association between the failure to ob-tain a screening for each of the three cancers with the independent variables, thereby enabling us to highlight persistent differences in screening behaviours. Because all three screenings are applicable to women but only one (colorectal) is applicable to men, separate analyses were conducted by sexed. Two distinct models were estimated for breast cancer screening (colorectal cancer screening): model 1 did not include the FOBT (mammo-gram) variable as a predictor; whereas model 2 did. Be-cause the inclusion of these variables was suspected to introduce bias into the models, we choose to report the results of model 1. Specific categories of nonresponse were created for each independent variable and included in the models, but we do not report their results, as we were not interested in their effects.
Then, to analyse the changes in the determinants of the failure to obtain screenings over time, we analysed the in-teractions between the determinants of interest (e.g., age, social class, complementary health insurance, risky be-haviours) and survey year dummies (i.e., 2008 vs. 2006 and 2010 vs. 2006 for the breast cancer and cervical screening models and 2010vs. 2008 for the colorectal can-cer screening model), and in the final model, we included the interactions that were statistically significant at the 5% level (selected through backward deletion).
Results
Descriptive statistics
The results regarding the trends in cervical, breast, and colorectal cancer screenings between 2006 and 2010 are displayed in Figure 1, Figure 2 and Figure 3.
Whereas 75.3% (95% CI = [74.1%-76.5%]) of women re-ported having received a test for cervical cancer in 2006, this rate decreased significantly to 71.9% (95% CI = [70.5%-73.3%]) in 2010. The screening rate for breast cancer decreased (but not significantly at the 5% level) between 2006 and 2010, from 77.6% (95% CI = [75.8%-79.3%]) in 2006 to 74.0% (95% CI = [72.1%-75.9%]) in 2010. Overall, colorectal cancer screening uptake in-creased significantly between 2006 and 2010, from 18.2% (95% CI = [17.0%-19.4%]) in 2006 to 38.9% (95% CI = [37.4%-40.5%] in 2010. As shown in Figure 3, the increase was sharper for women, whose screening uptake increased from 16.9% (vs. 19.6% for males) in 2006 to 40.0% (vs. 38.0% for males).
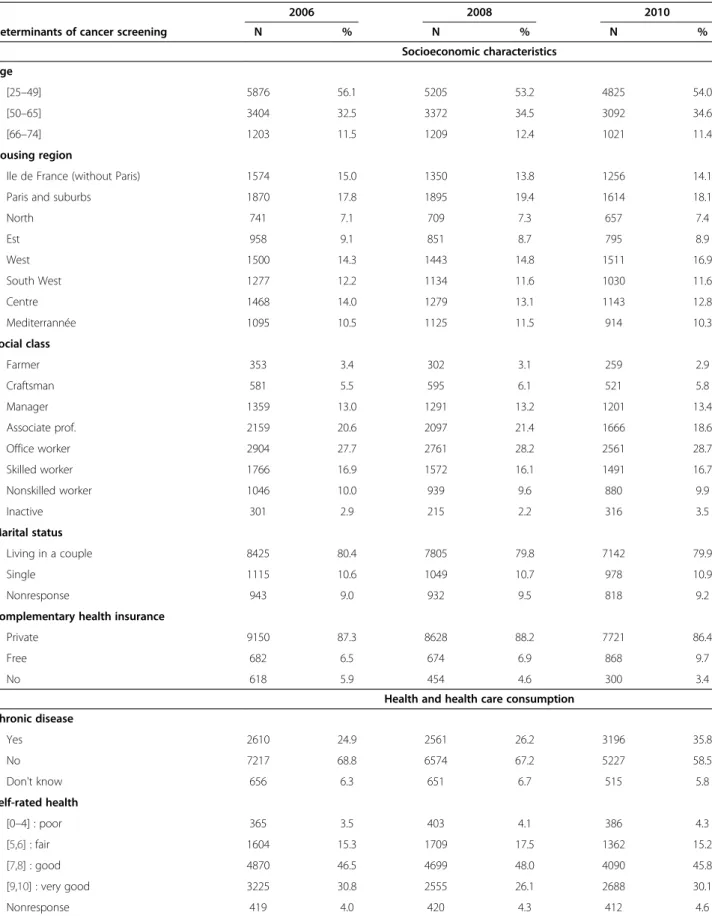
Table 1 presents the distribution of the independent variables according to the survey year. For most deter-minants of cancer screening uptake, the proportion of respondents in the various categories did not change across the surveys. The main exceptions are having free
health insurance (9.7% in 2010vs. 6.5% in 2006), having a chronic disease (58.5% in 2010 vs. 68.8% in 2006), having seen a specialist a least once (47.1% in 2010 vs. 42.0% in 2008) and never drinking alcohol (19.3% in 2008vs. 24.2% in 2010).
Multivariate analyses Cervical screening
The results of the main-effects and interactions models for cervical screening are displayed in Table 2 (only one interaction was significant at the 5% level).
All of the variables explained the failure to obtain a test for cervical cancer in the multivariate analyses (N = 13,177 observations used). Compared to younger women (25–34 years), women aged 45–54 years or 55–65 years were more likely not being screened (OR45–54= 1.56
[1.37-1.78], OR55–65= 2.39 [2.08-2.74]. The negative impact
of age on cervical screening has increased over time: com-pared to women aged 25–34 years in 2006, women aged 45–65 years had a higher likelihood of not being screened in 2010. Compared to women having an intermediate pro-fession, living in a couple, and having private comple-mentary health insurance, women who were farmers, office workers, skilled/unskilled workers, or unemployed; who were single; who did not have private health insu-rance; who had free complementary health insurance (the CMU-C) were significantly more likely to report not being screened. In addition, women who reported having a chronic disease, having good, fair, or poor self-rated health, and using medical care less often (no consultation with a specialist and fewer than two visits to a GP over the past 12 months), were more likely to not have received a screening compared to women who reported greater ac-cess to medical care, no chronic disease, and very good self-rated health. Finally, regarding so-called risky life-styles, the results regarding the probability of not being screened for cervical cancer followed a U-shaped curve: compared to not smoking, being an ex-smoker or a light smoker decreased whereas being a heavy smoker increased the likelihood of not being screened (ORex-smoker= 0.84
[0.74-0.94], ORlight-smoker= 0.81 [0.70-0.92], ORheavy smoker=
1.36 (1.18-1.56). Similarly, compared to safe drinkers, not drinking alcohol or being a high-risk drinker increased the likelihood of not being screened (ORneverdrink= 1.44
[1.30-1.59], ORhighrisk= 1.42 [1.09-1.85]). All else being
equal, the survey year had a significant impact on whether women reported being screened: women had a higher probability of not being screened for cervical cancer in 2010 than in 2006 (OR2010= 1.15 [1.03-1.27].
Breast cancer screening
The results of the main-effects model for breast cancer screening are displayed in Table 3 (no interactions were significant at the 5% level).
75.3 74.4 71.9 64.0 66.0 68.0 70.0 72.0 74.0 76.0 78.0 80.0 2006 2008 2010 P e rc enta g e
Cervical screening uptake
Figure 1 Trends in cervical screening uptake between 2006 and 2010. 77.6 75.6 74.0 64.0 66.0 68.0 70.0 72.0 74.0 76.0 78.0 80.0 2006 2008 2010 P e rcenta g e
Breast cancer screening uptake
Figure 2 Trends in breast cancer screening uptake between 2006 and 2010. 19.6 22.4 38.0 16.9 23.7 40.0 10.0 15.0 20.0 25.0 30.0 35.0 40.0 45.0 2006 2008 2010 P e rcenta g e
Colorectal cancer screening uptake
males females
Figure 3 Trends in colorectal cancer screening between 2006 and 2010.
Table 1 Descriptive statistics: the distribution of the independent variables in the three ESPS surveys
2006 2008 2010
Determinants of cancer screening N % N % N % Socioeconomic characteristics Age [25–49] 5876 56.1 5205 53.2 4825 54.0 [50–65] 3404 32.5 3372 34.5 3092 34.6 [66–74] 1203 11.5 1209 12.4 1021 11.4 Housing region
Ile de France (without Paris) 1574 15.0 1350 13.8 1256 14.1 Paris and suburbs 1870 17.8 1895 19.4 1614 18.1
North 741 7.1 709 7.3 657 7.4 Est 958 9.1 851 8.7 795 8.9 West 1500 14.3 1443 14.8 1511 16.9 South West 1277 12.2 1134 11.6 1030 11.6 Centre 1468 14.0 1279 13.1 1143 12.8 Mediterrannée 1095 10.5 1125 11.5 914 10.3 Social class Farmer 353 3.4 302 3.1 259 2.9 Craftsman 581 5.5 595 6.1 521 5.8 Manager 1359 13.0 1291 13.2 1201 13.4 Associate prof. 2159 20.6 2097 21.4 1666 18.6 Office worker 2904 27.7 2761 28.2 2561 28.7 Skilled worker 1766 16.9 1572 16.1 1491 16.7 Nonskilled worker 1046 10.0 939 9.6 880 9.9 Inactive 301 2.9 215 2.2 316 3.5 Marital status Living in a couple 8425 80.4 7805 79.8 7142 79.9 Single 1115 10.6 1049 10.7 978 10.9 Nonresponse 943 9.0 932 9.5 818 9.2
Complementary health insurance
Private 9150 87.3 8628 88.2 7721 86.4
Free 682 6.5 674 6.9 868 9.7
No 618 5.9 454 4.6 300 3.4
Health and health care consumption Chronic disease Yes 2610 24.9 2561 26.2 3196 35.8 No 7217 68.8 6574 67.2 5227 58.5 Don't know 656 6.3 651 6.7 515 5.8 Self-rated health [0–4] : poor 365 3.5 403 4.1 386 4.3 [5,6] : fair 1604 15.3 1709 17.5 1362 15.2 [7,8] : good 4870 46.5 4699 48.0 4090 45.8 [9,10] : very good 3225 30.8 2555 26.1 2688 30.1 Nonresponse 419 4.0 420 4.3 412 4.6
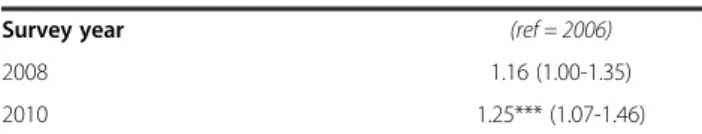
For this cancer screening (N = 6,229 observations used), women who reported not being screened more commonly were unskilled worker (OR = 1.62 [1.26-2.09]) or unemployed (OR = 1.61 [1.14-2.28]), single (OR = 1.45 [1.17-1.80]), and did not have a private complementary health insurance (OR = 2.08 [1.57-2.75]) or received free complementary health insurance (OR = 1.79 [1.36-2.37]). In addition, reporting a chronic disease (OR = 1.29 [1.11-1.59]), self-reporting poor health (OR = 1.87 [1.38-2.54]), having a low number of consultations with a GP (OR = 1.40 [1.21-1.62]) or a specialist (OR = 3.00 [2.59-3.47], being a heavy smoker (OR = 1.84 [1.44-2.37]) and never drinking alcohol (OR = 1.84 [1.44-2.37]) significantly in-creased the probability of not being screened. All else being equal, women were more likely to have not been screened for breast cancer in 2010 than in 2006. We performed a complementary analysis including FOBT up-take in the model and found a significant impact of the variable: all else being equal, not having received FOBT in-creased the odds ratio associated to not having performed a mammogram by 3.82 [3.18-4.60].
Colorectal cancer screening
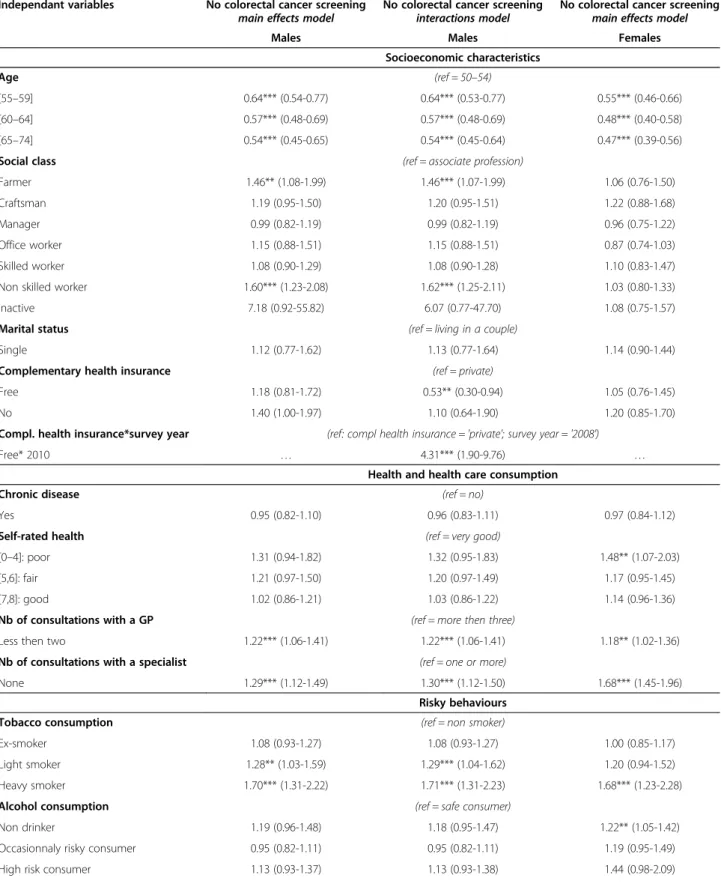
The results of the main-effects and interactions models for colorectal cancer screening are displayed in Table 4
(N = 5,927 observations used for males and N = 6,229 observations used for women).
For the two genders, the determinants of not being screened were being younger (50–54 years of age), being an unskilled worker, having less health care consumption (fewer than 3 visits to a GP or no visits to a specialist over the past twelve months), and being a heavy smoker. All else being equal, the likelihood of not being screened for colorectal cancer was significantly lower in 2010 than in 2008. There were differences regarding the impact of other determinants on FOBT uptake between males and females: females reporting poor health (OR = 1.48 [1.07-2.03]) and never drinking alcohol (OR = 1.22 [1.05-1.42]) had a higher likelihood of not being screened, but it was not the case for males. Conversely, being a light smoker increased the likelihood of not being screened for males (OR = 1.28 [1.03-2.22]) but not for females. One interaction was significant in the model for males: compared to having private complementary insurance, having free complementary health insurance (the CMU-C) was associated with a reduced probability of not being screened for colorectal cancer in 2008 (OR = 0.53 [0.30-0.94]) but a higher probability of not being screened in 2010 (OR = 4.31 [1.90-9.76]). We performed a second ana-lysis for females in which we included whether they had received a mammogram in the past two years into the Table 1 Descriptive statistics: the distribution of the independent variables in the three ESPS surveys (Continued)
Nb of consultations with a GP
Two or less 4884 46.6 4539 46.4 4133 46.2 Three or more 4983 47.5 4693 48.0 4208 47.1
Nonresponse 616 5.9 554 5.7 597 6.7
Nb of consultations with a specialist
None 4154 39.6 3690 37.7 3302 36.9 At least one 4578 43.7 4112 42.0 4208 47.1 Nonresponse 1751 16.7 1984 20.3 1428 16.0 Risky behaviours Tobacco consumption Non-smoker 3608 34.4 3434 35.1 2992 33.5 Ex-smoker 2825 27.0 2562 26.2 2101 23.5 Light smoker 1357 12.9 1412 14.4 1495 16.7 Heavy smoker 1428 13.6 1241 12.7 1161 13.0 Nonresponse 1265 12.1 1137 11.6 1189 13.3 Alcohol consumption Non drinker 2234 21.3 1893 19.3 2164 24.2 Safe consumer 4590 43.8 4338 44.3 3676 41.1 Occasionnaly risky consumer 2575 24.6 2288 23.4 1997 22.3 High risk consumer 531 5.1 748 7.6 629 7.0
Table 2 Multivariate logistic regression models of the absence of cervical screening (N = 13,177 women)
Independant variables No cervical screening main effects model No cervical screening interactions model OR (95 CI) OR (95 CI) Socioeconomic characteristics Age (ref = 25–34) [35–44] 1.05 (0.92-1.20) 1.01 (0.81-1.25) [45–54] 1.56*** (1.37-1.78) 1.19 (0.97-4.47) [55–65] 2.39*** (2.08-2.74) 2.05*** (1.65-2.56) Age *survey year (ref: age = '25-34'; survey year = '2006')
[45–54]*2008 … 1.50*** (1.11-2.03)
[45–54]*2010 … 1.54*** (1.13-2.09)
[55–65]*2010 … 1.40** (1.03-1.91)
Social class (ref = associate profession)
Farmer 1.78*** (1.29-2.45) 1.78*** (1.29-2.45) Craftsman 1.19 (0.91-1.54) 1.18 (0.91-1.54) Manager 0.89 (0.74-1.08) 0.89 (0.74-1.08) Office worker 1.19*** (1.05-1.34) 1.18*** (1.05-1.33) Skilled worker 1.24** (1.01-1.53) 1.24** (1.00-1.52) Non skilled worker 1.64*** (1.38-1.95) 1.64*** (1.38-1.95) Inactive 2.31*** (1.85-2.89) 2.29*** (1.84-2.86) Marital status (ref = living in a couple)
Single 1.82*** (1.61-2.06) 1.82*** (1.60-2.05) Complementary health insurance (ref = private)
Free 1.54*** (1.33-1.78) 1.54*** (1.33-1.78) No 2.05*** (1.68-2.51) 2.06*** (1.68-2.52)
Health and health care consumption
Chronic disease (ref = no)
Yes 1.28*** (1.15-1.43) 1.28*** (1.14-1.42) Self-rated health (ref = very good)
[0–4] : poor 2.04*** (1.62-2.58) 2.04*** (1.61-2.58) [5,6] : fair 1.52*** (1.31-1.76) 1.53*** (1.32-1.77) [7,8]: good 1.21*** (1.08-1.34) 1.21*** (1.09-1.35) Nb of consultations with the GP (ref = more then three)
Less than two 1.20*** (1.09-1.33) 1.21*** (1.10-1.33) Nb of consultations with a specialist (ref = one or more)
None 3.43*** (3.11-3.79) 3.43*** (3.11-3.79) Risky behaviours
Tobacco consumption (ref = non smoker)
Ex-smoker 0.84*** (0.74-0.94) 0.83*** (0.74-0.94) Light smoker 0.81*** (0.70-0.92) 0.80*** (0.70-0.92) Heavy smoker 1.36*** (1.18-1.56) 1.36*** (1.18-1.56) Alcohol consumption (ref = safe consumer)
Non drinker 1.44*** (1.30-1.59) 1.45*** (1.30-1.60) Occasionnaly risky consumer 1.09 (0.95-1.25) 1.09 (0.95-1.25) High risk consumer 1.42*** (1.09-1.85) 1.43*** (1.10-1.86)
model and found that this variable had a significant im-pact: not having received a mammogram increased the odds ratio associated to not having received a FOBT by 3.85 [3.20-4.63].
Discussion
This study aimed to examine the determinants of and trends in the failure to receive breast, cervical, and colo-rectal cancer screenings in France between 2006 and 2010, a period in which various incentive policies were implemented. We focused on three types of cancer that were either the focus of recent debate or the subject of mass screening policies that were implemented following national and international guidelines. However, the supply context and incentive policies related to these types of screening differ. A national programme for breast cancer screening has been in place since 2004 and highly pub-licised for many years. Mammography is generally pre-scribed by a GP or gynaecologist and performed in a radiology centre. A Pap smear is most often performed by a gynaecologist or GP before it is sent to a laboratory for analysis, but a national programme has not been estab-lished (only experiments are ongoing). This test has been the focus of a number of economic evaluations aiming to provide recommendations for the vaccine against human papillomavirus. A national programme for colorectal can-cer screening that targets the entire population over the age of 50 years was recently implemented. Colorectal cancer screening is most often prescribed by a GP but may also be recommended by a gastroenterologist or anatomopathologist.
Our results show that the rates of cervical and breast cancer screening use in France decreased between 2006 and 2010. These results, which are consistent with those of other studies obtained in different contexts and coun-tries [21], are particularly disappointing given the main-tenance or reinforcement of certain incentive policies (Cancer Plan 2009–2013). In contrast, the rate of colo-rectal cancer screening uptake increased substantially bet-ween 2006 and 2010. This result can be explained by the introduction of a national cancer screening programme in 2009 that combined two actions: a voucher mailed to eligible individuals on the demand side and a lump sum payment to GPs on the supply side.
According to our results, young age, low socioeconomic status, and poor or fair self-rated health had the strongest
negative impact on cervical screening uptake relative to breast and colorectal cancer screening uptake. This result could be explained by the absence of a national pro-gramme for cervical screening and, as a consequence, reduced media attention on cervical screening and/or by the costs associated with cervical screening (i.e., the screening is not free) [22]. Furthermore, the context of cervical screening differs from that of other types of cancer screening, as cervical screening is often provided directly by a gynaecologist during a consultation, which increases inequalities related to access to care. Women who lived in a couple were more likely to consult a gynae-cologist for contraceptive treatment and thus were more likely to be screened. In addition, the higher screening up-take for women aged between 25 and 34 years was likely related to consultation for one or several pregnancies, which are associated with more frequent visits to spe-cialists. By extension, the provision of cervical screening may be related to the proximity of a gynaecologist (i.e., living in a more urban area where the density of specialists is much higher). Indeed, having consulted a gynaecologist in the past 12 months constituted a very strong deter-minant of Pap smear and mammography uptake. We performed separate analyses including gynaecologist visits adjusted for all other covariates and found that this variable had a substantial impact on cervical screening uptake (OR = 7.8 [6.2-9.4]) and a less pronounced impact on mammography screening (OR = 3.5 [2.5-4.7]). These results confirm the need to strengthen efforts to reduce inequalities in access to specialists, especially for cancers that are not the subject of a national programme (e.g., cervical cancer).
Concerning breast cancer screening, socioeconomic characteristics had affected the likelihood of undergoing a mammogram, but the effect was less pronounced than that for cervical screening. A possible explanation for this result is that the combination of highly publicised information campaigns for breast cancer in France and the national screening programme indeed targeted a larger population, but economic inequalities have per-sisted: not having private complementary health insu-rance (whether free or not) decreased the probability of screening. In France, not having complementary health insurance and, to a greater extent, receiving free comple-mentary health insurance are often associated with low to very low household income. Moreover, even though Table 2 Multivariate logistic regression models of the absence of cervical screening (N = 13,177 women) (Continued)
Survey year (ref = 2006)
2008 1.02 (0.92-1.13) 0.86 (0.68-1.09) 2010 1.15** (1.03-1.27) 0.90 (0.71-1.15)
Note: The results were adjusted for the region of residence. Nonresponse categories were included in the models, but their coefficients were not reported in the final table. Significance level: *** = 1%; ** = 5%.
mammograms are free of charge in the context of orga-nised cancer screening, lower overall access to the health system (e.g., physician care) may prevent individuals from receiving the test. Thus, even though a national programme was implemented in 2004, i.e., before the study period, inequalities in access to breast cancer screening persist and do not seem to have declined over time.
Regarding colorectal cancer screening, despite the intro-duction of a national programme in 2009, age-related screening disparities have persisted: individuals under 54 years of age were less likely to have been tested. The complementary health insurance variable had no effect on colorectal cancer screening uptake, in contrast to cervical and breast cancer screening uptake, over the study period. However, among males, inequalities related to having free complementary health insurance (the CMU-C) were significant in 2010. Moreover, individuals with less access to health care (GPs or specialists) were less likely to be tested. Thus, health authorities could intensify efforts to promote increased access to screening for the most disadvantaged populations. For this purpose, a national programme is one mechanism among many and should likely be complemented by targeted primary prevention policies aimed at reducing these inequalities.
Another interesting result of our paper concerns the im-pact of individual risk behaviours and the use or nonuse of other screening tests. The results for individuals who engaged in high-risk behaviours in terms of alcohol and tobacco consumption were consistent with our expec-tations and the results of previous studies [23,24]. One possible rationale for their lower screening uptake could relate to economic trade-offs based on time preferences [25] and/or fear of disease. However, surprisingly, indivi-duals reporting very healthy behaviours (never consuming alcohol, never smoking) also had lower levels of screening uptake. This result is interesting, as it suggests that more targeted primary prevention policies are needed for these individuals, for instance, by combating the notion that cancer only affects individuals with more risky lifestyles. Limitations of the study
The main shortcomings of the study are related to the declarative nature of the data. Specifically, so-called Table 3 Multivariate logistic regression model of the
absence of breast cancer screening (N = 6,229 women)
Independant variables No breast cancer screening Main effects model
OR (95 CI) Socioeconomic characteristics Age (ref = 50–54) [55–59] 0.75*** (0.62-0.89) [60–64] 0.78*** (0.64-0.94) [65–74] 1.06 (0.89-1.27) Social class (ref = associate profession) Farmer 1.08 (0.76-1.55) Craftsman 1.09 (0.78-1.51) Manager 1.00 (0.76-1.33) Office worker 1.18 (0.98-1.42) Skilled worker 1.28 (0.96-1.70) Non skilled worker 1.62*** (1.26-2.09) Inactive 1.61*** (1.14-2.28) Marital status (ref = living in a couple) Single 1.45*** (1.17-1.80) Complementary health insurance (ref = private) Free 1.79*** (1.36-2.37) No 2.08*** (1.57-2.75)
Health and health care consumption Chronic disease (ref = no) Yes 1.29*** (1.11-1.50) Self-rated health (ref = very good) [0–4] : poor 1.87*** (1.38-2.54) [5,6] : fair 1.20 (0.96-1.49) [7,8]: good 1.06 (0.88-1.28) Nb of consultations with the GP (ref = more then three) Less than two 1.40*** (1.21-1.62) Nb of consultations with a specialist (ref = one or more) None 3.00*** (2.59-3.47) Risky behaviours Tobacco consumption (ref = non smoker) Ex-smoker 0.92 (0.77-1.10) Light smoker 1.08 (0.85-1.36) Heavy smoker 1.84*** (1.44-2.37) Alcohol consumption (ref = safe consumer) Non drinker 1.27*** (1.09-1.48) Occasionnaly risky consumer 1.14 (0.90-1.44) High risk consumer 1.26 (0.88-1.80)
Table 3 Multivariate logistic regression model of the absence of breast cancer screening (N = 6,229 women) (Continued)
Survey year (ref = 2006) 2008 1.16 (1.00-1.35) 2010 1.25*** (1.07-1.46)
Note: The results were adjusted for the region of residence. Nonresponse categories were included in the models, but their coefficients were not reported in the final table. Significance level: *** = 1%; ** = 5%.
Table 4 Multivariate logistic regression models of the absence of colorectal cancer screening (N = 5,927 males and N = 6,229 women)
Independant variables No colorectal cancer screening main effects model
No colorectal cancer screening interactions model
No colorectal cancer screening main effects model
Males Males Females
Socioeconomic characteristics
Age (ref = 50–54)
[55–59] 0.64*** (0.54-0.77) 0.64*** (0.53-0.77) 0.55*** (0.46-0.66) [60–64] 0.57*** (0.48-0.69) 0.57*** (0.48-0.69) 0.48*** (0.40-0.58) [65–74] 0.54*** (0.45-0.65) 0.54*** (0.45-0.64) 0.47*** (0.39-0.56) Social class (ref = associate profession)
Farmer 1.46** (1.08-1.99) 1.46*** (1.07-1.99) 1.06 (0.76-1.50) Craftsman 1.19 (0.95-1.50) 1.20 (0.95-1.51) 1.22 (0.88-1.68) Manager 0.99 (0.82-1.19) 0.99 (0.82-1.19) 0.96 (0.75-1.22) Office worker 1.15 (0.88-1.51) 1.15 (0.88-1.51) 0.87 (0.74-1.03) Skilled worker 1.08 (0.90-1.29) 1.08 (0.90-1.28) 1.10 (0.83-1.47) Non skilled worker 1.60*** (1.23-2.08) 1.62*** (1.25-2.11) 1.03 (0.80-1.33) Inactive 7.18 (0.92-55.82) 6.07 (0.77-47.70) 1.08 (0.75-1.57) Marital status (ref = living in a couple)
Single 1.12 (0.77-1.62) 1.13 (0.77-1.64) 1.14 (0.90-1.44) Complementary health insurance (ref = private)
Free 1.18 (0.81-1.72) 0.53** (0.30-0.94) 1.05 (0.76-1.45) No 1.40 (1.00-1.97) 1.10 (0.64-1.90) 1.20 (0.85-1.70) Compl. health insurance*survey year (ref: compl health insurance = 'private'; survey year = '2008')
Free* 2010 … 4.31*** (1.90-9.76) …
Health and health care consumption
Chronic disease (ref = no)
Yes 0.95 (0.82-1.10) 0.96 (0.83-1.11) 0.97 (0.84-1.12) Self-rated health (ref = very good)
[0–4]: poor 1.31 (0.94-1.82) 1.32 (0.95-1.83) 1.48** (1.07-2.03) [5,6]: fair 1.21 (0.97-1.50) 1.20 (0.97-1.49) 1.17 (0.95-1.45) [7,8]: good 1.02 (0.86-1.21) 1.03 (0.86-1.22) 1.14 (0.96-1.36) Nb of consultations with a GP (ref = more then three)
Less then two 1.22*** (1.06-1.41) 1.22*** (1.06-1.41) 1.18** (1.02-1.36) Nb of consultations with a specialist (ref = one or more)
None 1.29*** (1.12-1.49) 1.30*** (1.12-1.50) 1.68*** (1.45-1.96) Risky behaviours
Tobacco consumption (ref = non smoker)
Ex-smoker 1.08 (0.93-1.27) 1.08 (0.93-1.27) 1.00 (0.85-1.17) Light smoker 1.28** (1.03-1.59) 1.29*** (1.04-1.62) 1.20 (0.94-1.52) Heavy smoker 1.70*** (1.31-2.22) 1.71*** (1.31-2.23) 1.68*** (1.23-2.28) Alcohol consumption (ref = safe consumer)
Non drinker 1.19 (0.96-1.48) 1.18 (0.95-1.47) 1.22** (1.05-1.42) Occasionnaly risky consumer 0.95 (0.82-1.11) 0.95 (0.82-1.11) 1.19 (0.95-1.49) High risk consumer 1.13 (0.93-1.37) 1.13 (0.93-1.38) 1.44 (0.98-2.09)
social desirability bias may have resulted in an over-estimation of screening uptake. In France, the Institute for Public Health Surveillance (INVS) provides an an-nual estimation of breast cancer screening (since 2004) and colorectal cancer screening (since 2009). Concerning breast cancer, 49.3% of individuals were screened in 2006, 52.5% in 2008 and 52.0% in 2010e, and concerning colorectal cancer, 34% of individuals were screened bet-ween 2009 and 2010f. Thus, the screening rates in the ESPS samples seem to overestimate INVS’s rates (even though they are not comparable for breast cancer scree-ning because the “inclusion” period is not the same), but they are consistent with other self-reported measures provided for instance by the French National Institute for Prevention and Health Education (INPES) [13].
Other determinants of screening, such as cancer-related family history [26], beliefs and knowledge [27-30], or the availability of doctors [31,32], remained unidentifiable in our study. Other studies have also shown the impact of in-come on the probability of being screened [18,33]. Owing to numerous missing values and to avoid increasing the risk of multicollinearity with the health insurance and social class variables, we did not adjust for income.
Conclusion
Our results demonstrate that persistent obstacles to screening, which are primarily related to socioeconomic characteristics, health care access, and risky behaviours, remain. However, we could not precisely determine if low screening uptake result from lower patient uptake (i.e., patient choice) or from less access to screening ser-vices (i.e., system-level barriers). Further studies should more specifically investigate the associations among attitudes/beliefs, individual barriers in access to care, and screening uptake.
Greater coordination between the different actors in-volved in cancer screening also seems necessary because, in the context of French national programmes—particu-larly the breast cancer screening programme—the GP or gynaecologist is not always aware of whether their pa-tients have received a mammogram. Some studies argue that the GP’s role should be to coordinate the patient’s various screenings [34,35]. Indeed, GPs are the most relevant actors in the prescription of colorectal cancer screening [36], and they play an important (advisory) role in breast cancer and cervical screenings [37].
Endnotes
a
For a complete description of the authorisation: http://legimobile.fr/fr/cnil/del/aut/2010/2010-003/.
b
In France, private complementary health insurance is generally purchased to cover reinsurable copayments that are not covered by public health insurance: for any given service, the reimbursement is computed as a percentage of regulated prices, and some providers are also allowed to charge additional fees. Below a certain income threshold, individuals can benefit from a form of free complementary health insurance called the CMU-C. Individuals benefiting from the CMU-C are generally more socially and economically disadvantaged.
c
We did not include breast cancer and colorectal can-cer screening as predictors of can-cervical cancan-cer screening uptake because the age groups differed.
d
We thank an anonymous referee for offering two other rationales for this stratification: first other factors affecting colorectal screening may differ by sex (e.g. health con-sumption, risky behaviours); second, this stratification is useful for examining whether breast cancer screening compliance predicts the likelihood of colorectal screening among women. e http://www.invs.sante.fr/Dossiers-thematiques/Maladies- chroniques-et-traumatismes/Cancers/Evaluation-des- programmes-de-depistage-des-cancers/Evaluation-du-programme-de-depistage-du-cancer-du-sein. f http://www.invs.sante.fr/Dossiers-thematiques/Maladies- chroniques-et-traumatismes/Cancers/Evaluation-des- programmes-de-depistage-des-cancers/Evaluation-du-programme-de-depistage-du-cancer-colorectal. Competing interest
The authors declare that they have no competing interests.
Author’s contribution
We attest that each author has provided 1) substantial contributions to the conception and design of the study, 2) a draft or revision of the article, and 3) final approval of the version of the article to be published. JS performed the statistical analyses and drafted the manuscript. CF participated in the methodology assessment, helped in interpreting the results and in drafting the manuscript. All authors read and approved the final manuscript. Each author has participated sufficiently in the work to take public responsibility for an appropriate portion of the content.
Acknowledgements
We are indebted to the Research and Information Institute for Health Economics (IRDES) for providing the data. Only the authors are liable to the results and interpretations. We benefited from grants for this research provided by the national institute for cancer (INCa).
Table 4 Multivariate logistic regression models of the absence of colorectal cancer screening (N = 5,927 males and N = 6,229 women) (Continued)
Survey year (ref = 2008)
2006 1.15 (0.99-1.35) 1.12 (0.95-1.23) 1.52*** (1.30-1.77) 2010 0.45*** (0.39-0.52) 0.42*** (0.36-0.49) 0.45*** (0.39-0.52)
Note: The results were adjusted for the region of residence. Nonresponse categories were included in the models, but their coefficients were not reported in the final table. Significance level: *** = 1%; ** = 5%.
Received: 21 March 2014 Accepted: 16 September 2014 Published: 4 October 2014
References
1. Organization WH: The Global Burden of Disease: 2004 Update. World Health Organization: WHO Press; 2008.
2. Ferlay J, Shin H-R, Bray F, Forman D, Mathers C, Parkin DM: Estimates of worldwide burden of cancer in 2008: GLOBOCAN 2008. Int J Cancer J Int Cancer 2008, 2010(127):2893–2917.
3. Kerlikowske K, Grady D, Rubin SM, Sandrock C, Ernster VL: Efficacy of screening mammography. A meta-analysis. JAMA J Am Med Assoc 1995, 273:149–154.
4. Quinn M, Babb P, Jones J, Allen E: Effect of screening on incidence of and mortality from cancer of cervix in England: evaluation based on routinely collected statistics. BMJ 1999, 318:904–908.
5. Walter LC, Lewis CL, Barton MB: Screening for colorectal, breast, and cervical cancer in the elderly: a review of the evidence. Am J Med 2005, 118:1078–1086.
6. INCA: La situation du cancer en France en 2011, Rapports & synthèses. INCA: Observation des cancers; 2011 [Rapports & Synthèses. INCA].
7. Lantz PM, Weigers ME, House JS: Education and income differentials in breast and cervical cancer screening. Policy implications for rural women. Med Care 1997, 35:219–236.
8. Lofters AK, Moineddin R, Hwang SW, Glazier RH: Low Rates of Cervical Cancer Screening Among Urban Immigrants. Med Care 2010, 48:611–618. 9. Couture M-C, Nguyen CT, Alvarado BE, Velasquez LD, Zunzunegui M-V:
Inequalities in breast and cervical cancer screening among urban Mexican women. Prev Med 2008, 47:471–476.
10. Chattopadhyay SK, Ebrahim SH, Tao G, McKenna MT: Use of cervical cancer screening among insured women: the extent of missed opportunities. Health Policy 2005, 73:194–201.
11. Arrossi S, Ramos S, Paolino M, Sankaranarayanan R: Social inequality in Pap smear coverage: identifying under-users of cervical cancer screening in Argentina. Reprod Health Matters 2008, 16:50–58.
12. Martín-López R, Jiménez-García R, Lopez-de-Andres A, Hernández-Barrera V, Jiménez-Trujillo I, Gil-de-Miguel A, Carrasco-Garrido P: Inequalities in uptake of breast cancer screening in Spain: analysis of a cross-sectional national survey. Public Health 2013, 127(9):822–827.
13. Beck F, Gautier A: Les pratiques de dépistage des cancers en France. Baromètre cancer 2010. Inst Natl Prév Educ Pour Santé INPES. (http://www. inpes.sante.fr/Barometres/BaroCancer2010/pdf/depistages-cancers.pdf). 14. Kobayashi LC, Wardle J, von Wagner C: Limited health literacy is a barrier
to colorectal cancer screening in England: evidence from the English Longitudinal Study of Ageing. Prev Med 2014, 61:100–105.
15. Lo SH, Waller J, Wardle J, von Wagner C: Comparing barriers to colorectal cancer screening with barriers to breast and cervical screening: a population-based survey of screening-age women in Great Britain. J Med Screen 2013, 20:73–79.
16. Beck F, Gautier A: Les inégalités sociales de santé au prisme du baromètre cancer 2010. INPES 2012. n°419, 4–6. (http://www.inpes.sante.fr/ Barometres/BaroCancer2010/pdf/inegalites-sociales.pdf).
17. De Maio FG, Linetzky B, Ferrante D: Changes in the social gradients for Pap smears and mammograms in Argentina: evidence from the 2005 and 2009 National Risk Factor Surveys. Public Health 2009, 2012(126):821–826. 18. Duport N, Ancelle-Park R: Do socio-demographic factors influence
mammography use of French women? Analysis of a French cross-sectional survey. Eur J Cancer Prev Off J Eur Cancer Prev Organ ECP 2006, 15:219–224.
19. Bush K, Kivlahan DR, McDonell MB, Fihn SD, Bradley KA: The AUDIT alcohol consumption questions (AUDIT-C): an effective brief screening test for problem drinking. Ambulatory Care Quality Improvement Project (ACQUIP). Alcohol Use Disorders Identification Test. Arch Intern Med 1998, 158:1789–1795.
20. Com-Ruelle L, Dourgnon P, Jusot F, Latil E, Lengagne P: Identification et mesure des problèmes d’alcool en France: une comparaison de deux enquêtes en population générale. QES IRDES 2005, No 97:No 97. 21. Martinez-Huedo MA, Lopez de Andres A, Hernandez-Barrera V,
Carrasco-Garrido P, Martinez Hernandez D, Jiménez-Garcia R: Adherence to breast and cervical cancer screening in Spanish women with diabetes: associated factors and trend between 2006 and 2010. Diabetes Metab 2012, 38:142–148.
22. Walsh B, Silles M, O’Neill C: The importance of socio-economic variables in cancer screening participation: A comparison between population-based and opportunistic screening in the EU-15. Health Policy 2011, 101:269–276. 23. Hsia J, Kemper E, Kiefe C, Zapka J, Sofaer S, Pettinger M, Bowen D, Limacher
M, Lillington L, Mason E: The Importance of Health Insurance as a Determinant of Cancer Screening: Evidence from the Women’s Health Initiative. Prev Med 2000, 31:261–270.
24. Selvin E, Brett KM: Breast and cervical cancer screening: sociodemographic predictors among White, Black, and Hispanic women. Am J Public Health 2003, 93:618–623.
25. Becker GS, Mulligan CB: The Endogenous Determination of Time Preference. Q J Econ 1997, 112:729–758.
26. Simou E, Foundoulakis E, Kourlaba G, Maniadakis N: Factors associated with the use of preventive services by women in Greece. Eur J Public Health 2011, 21:512–519.
27. Lostao L, Joiner TE, Pettit JW, Chorot P, Sandín B: Health beliefs and illness attitudes as predictors of breast cancer screening attendance. Eur J Public Health 2001, 11:274–279.
28. Tacken MAJB, Braspenning JCC, Hermens RPMG, Spreeuwenberg PMM, van den Hoogen HJM, de Bakker DH, Groenewegen PP, Grol RPTM: Uptake of cervical cancer screening in The Netherlands is mainly influenced by women’s beliefs about the screening and by the inviting organization. Eur J Public Health 2007, 17:178–185.
29. Klug SJ, Hetzer M, Blettner M: Screening for breast and cervical cancer in a large German city: participation, motivation and knowledge of risk factors. Eur J Public Health 2005, 15:70–77.
30. Hall NJ, Rubin GP, Dobson C, Weller D, Wardle J, Ritchie M, Rees CJ: Attitudes and beliefs of non-participants in a population-based screening programme for colorectal cancer. Health Expect 2013. doi:10.1111/hex.12157.
31. Bingham A, Bishop A, Coffey P, Winkler J, Bradley J, Dzuba I, Agurto I: Factors affecting utilization of cervical cancer prevention services in low-resource settings. Salud Pública México 2003, 45(Suppl 3):S408–416. 32. Agurto I, Bishop A, Sánchez G, Betancourt Z, Robles S: Perceived barriers
and benefits to cervical cancer screening in Latin America. Prev Med 2004, 39:91–98.
33. Rigal L, Saurel-Cubizolles M-J, Falcoff H, Bouyer J, Ringa V: Do social inequalities in cervical cancer screening persist among patients who use primary care? The Paris Prevention in General Practice survey. Prev Med 2011, 53:199–202.
34. Carcaise-Edinboro P, Bradley CJ: Influence of Patient-Provider Communication on Colorectal Cancer Screening. Med Care 2008, 46:738–745.
35. Fon Sing M, Leuraud K, Duport N: Characteristics of French people using organised colorectal cancer screening. Analysis of the 2010 French Health, Healthcare and Insurance Survey. Prev Med 2013, 57:65–68. 36. Federici A: The role of GPs in increasing compliance to colorectal cancer
screening: a randomised controlled trial (Italy). Cancer Causes Control CCC 2006, 17:45–52.
37. Jensen LF, Mukai TO, Andersen B, Vedsted P: The association between general practitioners’ attitudes towards breast cancer screening and women’s screening participation. BMC Cancer 2012, 12:254. doi:10.1186/1472-6963-14-465
Cite this article as: Sicsic and Franc: Obstacles to the uptake of breast, cervical, and colorectal cancer screenings: what remains to be achieved by French national programmes?. BMC Health Services Research 2014 14:465.