HAL Id: hal-02135629
https://hal.archives-ouvertes.fr/hal-02135629
Submitted on 21 May 2019
HAL is a multi-disciplinary open access
archive for the deposit and dissemination of
sci-entific research documents, whether they are
pub-lished or not. The documents may come from
teaching and research institutions in France or
abroad, or from public or private research centers.
L’archive ouverte pluridisciplinaire HAL, est
destinée au dépôt et à la diffusion de documents
scientifiques de niveau recherche, publiés ou non,
émanant des établissements d’enseignement et de
recherche français ou étrangers, des laboratoires
publics ou privés.
Impact of biomass diversity on torrefaction: Study of
solid conversion and volatile species formation through
an innovative TGA-GC/MS apparatus
Maria Gonzalez Martinez, Capucine Dupont, Sébastien Thiéry, Xuan Mi
Meyer, Christophe Gourdon
To cite this version:
Maria Gonzalez Martinez, Capucine Dupont, Sébastien Thiéry, Xuan Mi Meyer, Christophe Gourdon.
Impact of biomass diversity on torrefaction: Study of solid conversion and volatile species formation
through an innovative TGA-GC/MS apparatus. Biomass and Bioenergy, Elsevier, 2018, 119, pp.43-53.
�10.1016/j.biombioe.2018.09.002�. �hal-02135629�
0
1ATAO
Open Archive Toulouse Archive Ouverte
(OATAO)
OATAO is an open access repository that collects the work of some Toulouse
researchers and makes it freely available over the web where possible.
This is
version published in:
Official URL:
To cite this version:
a
Any correspondence concerning this service should be sent to the repository administrator:
tech-oa tao@listes-diff.inp-toulouse.fr
Impact
of biomass diversity on torrefaction: Study of solid conversion and
volatile
species formation through an innovative TGA-GC/MS apparatus
María
González Martínez
a,b,c,∗,
Capucine Dupont
d,
Sébastien Thiéry
a,
Xuân-Mi Meyer
b,c,
Christophe
Gourdon
b,ca Université Grenoble Alpes, CEA, Laboratory of Bioresources Preparation (LPB), F-38000, Grenoble, France b Université de Toulouse, INPT, UPS, Laboratoire de Génie Chimique, 4 Allée Emile Monso, F-31030, Toulouse, France c CNRS, Laboratoire de Génie Chimique, F-31030, Toulouse, France
d IHE Delft Institute for Water Education, Department of Environmental Engineering and Water Technology, Delft, the Netherlands
Keywords: Torrefaction Biomass TGA-GC/MS Solid mass loss Volatile species
A B S T R A C T
The objective of this work is to compare the kinetic behavior of a large set of European biomasses during torrefaction, both in terms of solid transformed and volatile species released, and to determine whether biomass behaviors can be classified according to main biomass families, namely deciduous wood, coniferous wood, agricultural coproducts and herbaceous crops. 14 biomasses representative of European diversity were torrefied in chemical regime following a non-isothermal procedure (200 to 300 °C, 3 °C min1) in a thermogravimetric
analyzer coupled with a gas-chromatograph mass spectrometer through a system of heated storage loops (TGA-GC/MS). Coniferous and deciduous wood were found to have similar behaviors in terms of solid evolution profile and species produced, while being different in terms of kinetics. On the contrary, agricultural biomass appeared to be a highly heterogeneous group where different biomass subtypes should be selected in order to represent the diversity of behaviors during torrefaction. Biomass macromolecular composition, together with the biological origin and the structural matrix of biomass, were shown to be determining factors of biomass behavior in tor-refaction.
1. Introduction
The estimations of the National Renewable Energy Action Plans
(NREAPs) point out that biomass will significantly contribute to satisfy
the energy demand in Europe in the next years. This will require to mobilize unused forest resources, agricultural by products and biode
gradable waste [1]. In this context, thermochemical conversion of
biomass can play a crucial role in the large scale valorization of un
derexploited biomass and biowaste resources [2]. This process is
especially suitable for biomass with low moisture content. This kind of biomass includes diverse types of materials, namely coniferous and deciduous wood, agricultural by products and herbaceous crops.
Lignocellulosic biomass is formed by a mostly crystalline cellulose
microfibril network surrounded by a matrix of hemicelluloses and small
amounts of lignin which give the definitive strength to the structure
[3,4]. The proportions and distribution of these macromolecular com
ponents in biomass physical structure is complex and depends on the type of biomass. Besides, interactions between cellulose, hemicelluloses
and lignin confer a significant resistance to the structure [3].
Torrefaction is a mild thermochemical treatment of biomass, typi cally occurring between 200 and 300 °C during a few tens of minutes, at
atmospheric pressure and in default of oxygen [5,6]. The solid product
obtained has properties close to coal in terms of heating value, carbon
content, hydrophobicity, grindability as well as flowability, and is
therefore suitable as fuel for combustion, co combustion or gasification [7 9].
During torrefaction, biomass releases some volatile species. They are classified into non condensable or permanent gases, mainly CO and
CO2, and condensable species, namely water and various compounds
such as acetic acid or phenol [5]. According to Anca Couce and
Obernberger [10], for a torrefaction at 250 °C, permanent gases re
present about 6 to 12% and condensable species, including water, correspond to 22 to 30% of the product composition in mass percentage of initial wet biomass, the volatile fraction increasing with torrefaction
temperature [11]. Regarding the total gaseous products, about 15% of
the mass loss is transformed into permanent gases (CO, CO2), 30 to 50%
produces water, and the rest of the products are condensable species
[5,8,12]. The production of some of these volatile species can damage
∗Corresponding author. Université Grenoble Alpes, CEA, Laboratory of Bioresources Preparation (LPB), F-38000, Grenoble, France.
E-mail address: maria.gonzalez-martinez@outlook.com(M. González Martínez).
the torrefaction installation, as for example a high acid production. However, other species may also be valorized as source of high added
value“green” chemicals [13 15]. For example, acetic acid has been
pointed out as a green herbicide [16] that does not persist in the en
vironment [17]. It is crucial to characterize the production of volatile
species, as well as the solid transformation, in order to optimize the control of the torrefaction process and to design industrial torrefaction units.
There have been many torrefaction studies during the last ten years in literature. However, only one or few biomasses were considered in
each study [18 27]. Furthermore, those torrefaction studies frequently
focused either on solid transformation or on volatile/gaseous species release, without considering systematically both aspects simultaneously [28 32].
Up to now, the thermogravimetric analyzer or thermobalance (TGA) is the most common apparatus at lab scale devoted to the study of biomass torrefaction [15,33,34], while experimental pilot plants rather
include torrefaction furnaces [5]. In thefirst case, solid kinetics are
analyzed continuously, which is usually replaced in pilot plants by a global mass balance. On the other hand, analytical devices allowing the detection and quantification of the gaseous species released in torre faction can be included in experimental set ups and coupled to the thermobalance. These analyzers are usually FTIR (Fourier Transform Infrared Spectroscopy), HPLC (High Performance Liquid Chromato graphy) and GC (Gas Chromatography). These techniques can be used individually or combined with MS (Mass Spectrometry) or FID (Flame
Ionization Detection) [10,11,25]. Permanent gases can be analyzed on
line by these techniques or collected in a gas bag for later analysis [21].
However, quantification of volatile species is usually limited with the
proposed set ups. In the case of a gas analysis by chromatographic methods, the time required for each gaseous fraction to be analyzed limits the number of gaseous fractions that can be analyzed during a single torrefaction experiment (residence time from several minutes to 1 h). This is especially problematic for the study of volatile species re lease in dynamic torrefaction versus temperature, but also in isothermal
torrefaction, for analyzing the influence of the residence time on the
gaseous release. Other experimental set ups in the literature suggest cooling down of the condensable fraction in a solvent by using a cold
trap system, usually between 0 and 80 °C, followed by an off line
chromatographic analysis [5]. This quantification of the volatile species
fraction is limited, particularly for the chemical compounds released in minor amounts.
Based on this background, the objective of this work is to char acterize the torrefaction behavior of various biomass types, both in terms of solid mass loss and volatile species release versus temperature and time. To achieve this goal, solid reduction and volatile species re leased in torrefaction were studied at lab scale in a thermobalance coupled with a gas chromatograph mass spectrometer device through a heated storage loop system (TGA GC/MS). The introduction of this storage system allows analyzing volatile species released at several torrefaction times, independently of the GC/MS analysis time. As a
result, the production profiles of the volatile species released in torre
faction can be studied in function of time and temperature, as well as the solid transformation.
2. Materials and methods
2.1. Raw biomass description and characterization
Biomass samples were selected in order to represent European di versity, while taking into account their potential availability. They were classified in the following families:
•
Coniferous wood: pine, pine forest residues and Scot pine bark.•
Deciduous wood: ash wood, beech, poplar and willow.•
Herbaceous crops: miscanthus and reed canary grass.•
Agricultural by products: corn cob, grape seed cake, sunflower seedshells and wheat straw (2 types).
Pine forest residues, Scot pine bark, reed canary grass and one sample of wheat straw were harvested in Sweden. All the other samples, including the other sample of wheat straw, were harvested in the South of France.
Ash wood and pine were received as woodchips and dried at 60 °C during 24 h. This temperature was chosen to mainly remove water but retain extractives in biomass. Pine forest residues, Scot pine bark,
beech, willow and poplar were first convectively dried by blowing
heated air (40 to 60 °C) through a perforatedfloor, until all the mate
rials reached about 5% moisture content (w.b., water basis). Due to their low moisture content, miscanthus, reed canary grass and the agricultural byproducts did not require any drying operation before shredding. Miscanthus and the French wheat straw were received as pellets. All biomasses, except grape seed cake and sunflower seed shells, were then shredded with a Lindner Micromat 2000 (Linder Recylingtech GmbH, Spittal, Austria) with 15 mm screen size. Finally,
all biomasses were ground below 500μm using a Universal cutting mill
Fritsch Pulverisette 19 (Fritsch GmbH, Idar Oberstein, Germany). Biomasses were then sampled following standard XP CENT/TS 14780. This procedure ensures sample homogeneity and representativeness in
torrefaction experiments [35].
Biomass properties were measured according to European standards on solid biofuels when existing and internal methods based on best
practices otherwise (Table 1). Details about these methods can be found
in Ref. [36]. Values are expressed in % wmf (weight moisture free
basis).
Biomass properties were found to be in agreement with literature
Table 1
Macromolecular composition measured for the different biomass samples.
Biomass Cellulose Hemicelluloses Lignin Extractives Ash
% wmf % wmf % wmf % wmf % wmf
Method Internal method XP CEN/TS
14775 Deciduous wood Ash-wood 39.0 21.9 26.3 10.0 2.8 Beech 44.0 27.0 26.3 1.8 0.8 Poplar 44.3 22.6 26.2 4.2 2.7 Willow 43.3 22.1 24.5 7.8 2.2 Coniferous wood Pine 36.7 26.1 27.5 8.4 1.3 Pine forest residues 23.3 29.2 26.9 18.5 2.2
Scot pine bark 23.3 19.5 39.6 14.8 2.7
Herbaceous crops Miscanthus 45.7 22.8 20.2 8.6 2.7 Reed canary grass 39.2 25.5 23.2 6.0 6.2 Agricultural by-products Corn cob 39.8 36.1 15.6 6.7 1.8 Grape seed cake 7.5 21.0 60.2 7.3 4.0 Sunflower seed shells 35.9 25.6 25.1 10.4 3.1 Wheat straw (French) 33.8 21.7 20.5 15.7 8.3 Wheat straw (Swedish) 38.7 25.1 20.5 7.2 8.5
[37 39]. Woody biomasses, in particular softwood bark, tended to have higher contents in lignin than agricultural biomasses. Woody biomasses were also characterized by lower ash contents. Extractives content ap peared to be higher in coniferous wood and in some agricultural bio
masses, namely sunflower seed shells and wheat straw. This result may
be considered with caution as different methods are commonly used for woody and agricultural biomasses, and here the method was that used for wood. Hemicelluloses were found in variable amounts among samples. Interestingly, the highest amount was found in corn cob and the lowest amount in grape seed cake, despite the fact that these bio masses are both from agricultural type. Hemicelluloses are mainly composed of xylan for all biomass types except for resinous wood, in
which glucomannan predominated (Table 2).
The macromolecular composition of herbaceous crops was inter mediate to that of woods and agricultural biomasses. Willow presented a characterization close to that of herbaceous biomasses. Indeed, willow can be considered as a short rotation coppice (SRC) because of its particular growing procedure, being usually harvested at an early age,
which leads to a higher ash content and a lower lignin content [25,40].
Finally, it is noteworthy that the two wheat straws from different
origins had very close ash and lignin contents but significantly different
proportions of cellulose, hemicellulose and extractives.
2.2. TGA-GC/MS
Torrefaction experiments were performed in a thermogravimetric analyzer (TGA, 92 16.18 SETARAM TGA 92). About 100 mg of biomass sample were loaded in a three plate crucible of 10 mm in diameter, corresponding to a maximum bed thickness of 2 mm of biomass per plate, and suspended in the TGA oven. The position of the three plate crucible in the TGA oven was checked to guarantee the same thermal
behavior in the three biomass layers [15].
Samples were torrefied under a 50 mL min1 heliumflow in the
thermobalance. Afirst preheating of the sample was carried out from
ambient temperature to 200 °C at 3 °C min1. By continuing at this
heating rate, the sample was heated from 200 to 300 °C, and then kept at 300 °C for 30 min, which was considered the effective torrefaction temperature range. As a result, 200 °C was chosen as the reference temperature for the comparison of the TGA data, as at this temperature the moisture content can be considered as negligible. Helium was chosen as carrier gas because of the further GC/MS analysis of the
torrefaction gases. Tests performed with N2were shown to give the
same results in terms of mass loss kinetics.
Preliminary experiments have confirmed that the selected crucible
configuration and experimental conditions ensure chemical regime
[35], so that the phenomena involved can be analyzed in function of the
biomass type and its composition, independently of heat transfer lim itations.
Condensable species released were sampled every 10 °C, between
200 and 300 °C, thanks to a heated storage loop system
(Chromatostock, Antelia). Then, each volatile fraction was analyzed in GC/MS (Perkin Elmer Clarus 580/Clarus SQ8S, EI ion source, split less injection), in order to determine its chemical composition. 55 chemical species were detected in the chromatogram analysis (m/z = 28 to 300,
NIST library for the identification). 23 of these chemical species were
quantified thanks to calibrations with chemical standards. The main advantages of introducing the intermediate heated storage loop system
is to overcome the difference between the experimentation time, which
is about 33.3 min for the dynamic torrefaction, and the time required for the analysis of each condensable species sample in GC/MS, which is 70 min. Furthermore, no condensation is required, so that volatile species can be conserved in gaseous state before their analysis.
The repeatability of the torrefaction experiments was checked by carrying out each experiment twice in TGA GC/MS for a given biomass. The standard deviation in mass loss calculations was below 0.5%. The relative uncertainty on volatile species yield typically lay between 10 and 25%, which was found to be satisfactory when considering the uncertainties due to sampling and to the small amounts to be detected. 3. Results and discussion
3.1. Solid mass loss
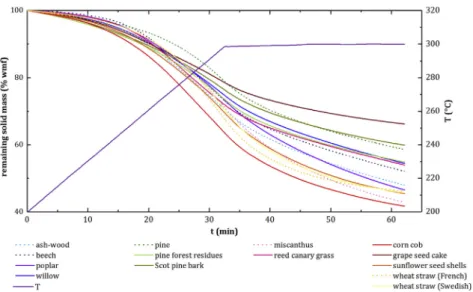
Solid mass loss was calculated versus temperature and time for a
dynamic torrefaction between 200 and 300 °C, at 3 °C min1, followed
by an isothermal torrefaction at 300 °C for 30 min (Fig. 1). The corre
sponding degradation rate curves were also calculated (Fig. 2).
In the literature, several studies have considered a single biomass per family for the study of solid kinetics in torrefaction [14,26,27,32]. To check this hypothesis, one biomass was selected per biomass family: ash wood for deciduous wood, pine for coniferous wood, one wheat straw for agricultural coproducts and miscanthus for herbaceous crops
(represented by dotted lines inFigs. 1 and 2).
Thefinal solid mass loss varied according to the 14 biomasses be
tween about 20 and 36% at the end of the dynamic stage and between
about 33 and 58% after the isothermal stage (Fig. 1). There is therefore
about a factor 2 between mass losses according to biomasses, which means that torrefaction conditions in industrial units should be tuned depending on biomass type.
Biomass Glucan Xylan Mannan Galactan Arabinan Acetyl groups
%a % wmfb
Method TAPPI T249 cm-85/TAPPI T249 cm-85/ASTME1758- 01 (2007)– internal method (aceyl groups)
Deciduous wood Ash-wood 69.2 24.9 2.0 1.1 2.7 3.6 Beech 63.9 29.1 3.0 2.0 2.0 8.3 Poplar 68.9 22.7 4.3 2.0 2.2 5.9 Willow 69.1 21.8 2.8 3.0 3.4 4.9 Coniferous wood Pine 70.6 8.2 16.9 2.8 1.6 1.7 Pine forest residues 58.8 10.7 14.4 8.7 7.5 2.7 Scot pine bark 64.3 7.9 9.9 7.1 10.9 1.6 Herbaceous crops Miscanthus 69.9 26.1 0.5 0.7 2.9 2.6 Reed canary grass 61.0 29.9 0.4 3.1 5.6 5.0 Agricultural by-products Corn cob 52.4 39.4 0.0 2.5 5.7 5.0 Grape seed cake 33.6 48.2 7.4 5.2 5.6 3.1 Sunflower seed shells 59.5 30.7 1.0 2.2 6.6 7.5 Wheat straw (French) 63.7 29.7 0.8 1.6 4.2 1.7 Wheat straw (Swedis-h) 61.0 32.5 0.3 1.6 4.6 3.7 a % of total monosugars.
b % wmf = water-mass-free (not normalized).
Table 2
The highest mass loss was obtained for corn cob (58.3%), closely followed by miscanthus (57.1%) and sunflower seed shells (54.6%), while the lowest mass loss was found for grape seed cake (33.8%). Such result shows the large diversity of the agricultural byproducts and the impossibility to describe them through one single representative type. However, the role of the macromolecular composition of biomass (Table 1) on its degradation through torrefaction is confirmed. Hemi cellulose rich biomasses suffered a more enhanced solid mass in tor refaction than lignin rich biomasses, represented oppositely by corn cob and grape seed cake. A high cellulose content, such as for miscanthus (45.7%), beech (44.0%) and poplar (44.3%), results in a more enhanced degradation from 300 °C. It is noteworthy that among the agricultural
biomasses, the two wheat straws had very similarfinal mass losses of
53.9 and 54.4% respectively, which would tend to suggest that torre faction behavior might be associated to each species. Eventually, woody biomasses were found to be in the middle of the mass loss range, with about 5% of difference among the different samples considered (53.5 to 47.9%). It is interesting to note that, among these woody samples, all coniferous samples showed lower mass loss than the deciduous samples. This result is in agreement with the hemicellulose composition of coniferous woods, mainly based on mannan sugars, which were re ported to be less reactive than xylan based sugars from deciduous wood hemicelluloses [26].
By analyzing biomass dynamic torrefaction per family, strong
differences were found in degradation profiles of agricultural by products. This might be principally derived from their dissimilar mac
romolecular composition (Table 1), with hemicellulose contents going
from 26.1 to 36.1%, cellulose contents from 7.5 to 39.8% and, in versely, lignin contents from 60.2 to 15.6%. These values correspond to grape seed cake and corn cob, respectively. As in this case, biomasses exhibiting an opposite macromolecular composition were transformed in torrefaction through strongly different patterns of degradation (Fig. 1). These results suggest that agricultural biomasses should be therefore seen as a very heterogeneous group. On the contrary, the selected deciduous wood present rather close solid degradation profiles,
which might respond to their similar composition (Table 1). However,
this criterion does not seem to be sufficient to describe biomass trans
formation in torrefaction. Herbaceous biomasses (reed canary grass and miscanthus) present a similar cellulose, hemicellulose and lignin con tent to that of deciduous wood, but their degradation pattern in tor refaction is different, presumably because of the differences in the biological structure of these two biomass families. Furthermore, a more detailed characterization of biomass macromolecular composition
could help to explain this difference. Thus, in the case of lignin, soft
wood lignin is reported to be composed of G (guaiacyl ) units, while
hardwood lignin is known to be composed of G and Se (syringyl ) units
[41]; lignin from herbaceous plants also contains He (hydroxyphenyl )
units [42]. The three coniferous wood samples also seemed to behave
Fig. 1. Remaining solid mass loss versus temperature and time obtained for the different raw biomasses in torrefaction in TGA-GC/MS.
Fig. 2. Degradation rates versus temperature and time obtained for the different raw biomasses in torrefaction in TGA-GC/MS.
100 = == : - : - - - , - - - - . - - - . - - - . - - - , 7 1320 1 ~ - 300 C' E ~ 80
l
~
:si ]..
. 5 60 C ·; E ~ 280 û 260 i!......
240 220 40 ~ - ~ - - ~ - ~ - - ~ - ~ - - ~ - ~ - ~ ~ - ~ - ~ ~ - ~ - ~ - ~ 200 0 · · · ash-wood · · - · -beech - -poplar - -willow - -T 10 20 · · · pine 30 t[min)- -pine forest residues - -Scot pine bark
40 50
· · · miscanthus
- -reed canary grass
60
- -corncob
- -grape seed cake
- -sunflower seed shells
· · · wheat straw (French) wheat straw (Swedish)
2,5 ~ - - - - ~ - - - - ~ - - - - ~ - - - - ~ - - - - ~ - - - - ~ - -320
?
2,0 E;:;-s
~l
1,5 ~ s:::
§ 1,0 :c"
"d:::
i
0,5 .-··.·. 300 280 u 260 ::..,...
240 220 0,0t
~
- - - ' - - ~ - - - ' - - ~ - - - ' - - ~ ~ - - ' - - - ~ - - ' - - - ~ - - ' - - - ' 200 · · ·ash-wood · beech - -poplar - -willow - -T 10 20 · · · · ·pine 30 t(min)- -pine forest residues - -Scot pine bark
40
· · · · ·miscanthus
- -reed canary grass
50 60
- -corncob - -grape seed cake - -sunflower seed shells
·wheatstraw (French) wheatstraw (Swedish)
similarly, but differently to deciduous wood, which might be derived
from these differences in their lignin structural units.
In the isothermal torrefaction stage at 300 °C, some agricultural biomasses such as wheat straws, sunflower seed shells and miscanthus show a more pronounced diminution of the degradation rate, compared to that of wood, which tends to stabilize.
Two main degradation rate profiles could be identified in the dy
namic part of the curves (Fig. 2). The first profile corresponds to a
progressive acceleration of the degradation during the heating period. This is the case of wheat straws, miscanthus, pine, Scot pine bark and pine forest residues. The second typical biomass degradation pattern corresponds to an initial acceleration of the solid degradation until 250 to 270 °C, followed by a slower solid degradation until 300 °C. This
behavior could be observed for grape seed cake, willow, sunflower seed
shells and most deciduous woods, namely beech, poplar and ash wood. Finally, two extreme cases of this second behavior are observed, for reed canary grass and for corn cob. For reed canary grass, the solid degradation increases until 275 °C, and then the degradation rate slightly decreases. For corn cob, the acceleration of the degradation rate occurs before 280 °C and then stabilizes until 300 °C. The deceleration of the solid degradation in the isothermal torrefaction (300 °C, 30 min, Figs. 1 and 2) is more pronounced for wheat straws, followed by mis canthus, sunflower seed shells and corn cob. Finally, grape seed cake, hardwood and softwood deceleration is more attenuated. It is also in
teresting to highlight that, for an equivalent final mass loss, the de
gradation profile can be different. This is the case of corn cob cake and miscanthus.
By analyzing in depth degradation rate profiles (Fig. 2), grape seed
cake degradation profile seems to be particularly marked by the de gradation pattern of lignin. The relative stabilization of its degradation rate between 250 and 300 °C could be explained by its high lignin content (60.2%) and its very low cellulose content (7.0%), which is in
agreement with previous studies [26]. On the contrary, this stabiliza
tion of the degradation rate does not happen for Scot pine bark: despite its high lignin content (39.6%), a high cellulose content (23.3%) might compensate the mass loss at high torrefaction temperatures (270
to 280 °C). Scot pine bark degradation rate profile is closer to that of
coniferous wood, more sharpened at intermediate and high torrefaction temperatures (250 to 300 °C). This difference could be due to the higher cellulose content of pine compared to those of pine forest residues and of Scot pine bark, as cellulose decomposition occurs around 300 °C. On the other hand, the enhanced acceleration of corn cob degradation at low to intermediate temperatures (215 to 275 °C) could result from a
higher polysaccharide content (39.8% for cellulose and 36.1% for hemicelluloses). No evidence was found to justify the stabilization of the corn cob degradation rate at higher torrefaction temperatures. The higher weight loss of deciduous wood compared to that of coniferous
could be explained by their different hemicellulose composition: xylan
based hemicelluloses from hardwood would be more reactive than softwood hemicelluloses, mainly composed of mannans and gluco mannans (Table 2) [11,43].
These results underline that torrefaction behavior strongly depends on biomass type and on its macromolecular composition. However, this
criterion would not seem to be sufficient to describe particularities of
biomass degradation profiles in all cases. A deeper analysis on the
specific macromolecular components would be required, i.e. the char
acterization of the lignin structure on He, G and Se units. Biomass
structure, derived from its biological origin, was also shown to influ
ence biomass degradation through torrefaction. However, asfirst ap
proach, two categories of solid degradation profiles may be considered to describe dynamic torrefaction. These categories would correspond to agricultural biomasses/coniferous wood/herbaceous crops behavior on the one hand, and to deciduous wood behavior on the other hand
(dotted lines inFigs. 1 and 2). In the subsequent isothermal torrefaction
step, all biomasses show a generally gradual deceleration in their de gradation profile. Finally, decomposing biomass torrefaction in two steps (a dynamic one followed by an isothermal one), from 200 to 300 °C, and in chemical regime, simplifies the identification of the in fluence of each macromolecular component in biomass torrefaction. Indeed, at higher torrefaction temperatures (300 °C and above), the decomposition of cellulose, hemicellulose and lignin happens simulta neously, which complicates the separation of the phenomena involved [5,24,26,44].
3.2. Evolution of the solid elemental composition
The quality of the solid product after torrefaction was evaluated in terms of the evolution of its elemental composition in C, H and O (Fig. 3). No further proximate or ultimate characterization could be done because of the small amount of material resulting from the TGA torrefaction tests.
The results show an increase of the carbon content from 17.5 to 48.4% for beech and French wheat straw, respectively. The oxygen content was consequently diminished by 19.0 to 46.5%, respectively for pine and French wheat straw. The hydrogen content remains low and was little affected after torrefaction.
Fig. 3. Ternary diagram of CHO elemental composition of raw and torrefied biomass in TGA-GC/MS.
0,00 1,00 0,25 Y- - ---0,75 1--/ \-0,50 / 0,75 Y- - ~ 0,25 1,00 ~
....
, - - - ~ - ~ - ~ - - - ~ - - - - + - 0,00 0,00 0,25 0,50 C 0,75 1,00 • Ash-wood (raw) • Beech (raw) • Poplar (raw) • Willow(raw) • Pine (raw)• Pine forest residues (raw)
• Scot pine bark (raw)
• Miscanthus (raw)
• Reed canary grass (raw)
• Corn cob ( raw) • Grape seed cake (raw) • Sunflower seed shells (raw) • Wheat straw (French) (raw) Wheat straw (Swedish) (raw)
_... Ash-wood (torrefied)
.& Beech (torrefied) • Poplar (torrefied) .& Willow (torrefied)
• Pine (torrefied)
..t. Pine Forest residues (torrefied)
.& Scot pine bark (torrefied)
• Miscanthus (torrefied)
.& Reed canary grass (torrefied)
• Corn cab (torrefied)
.& Grape seed cake (torrefied) ... Sunflower seed shells (torrefied) • Wheat straw (French) (torrefied) Wheat straw (Swedish) (torrefied)
Differences in elemental composition of biomasses considered were enlarged after torrefaction, with agricultural biomasses reaching the
highest carbon content. The influence of biomass elemental composi
tion on its transformation through torrefaction was not observed. 3.3. Volatile species
3.3.1. Identified and quantified species
The volatile species identified during torrefaction experiments are
listed inTable 3. They mainly include acids, furans, alcohols, phenols
and ketones, and are in agreement with literature
[6,12,13,16,38,45,46].
3.3.2. Total production of volatile species
The total production of quantified volatile species released in dy
namic torrefaction per mass of biomass transformed was calculated as
the ratio between the total volatile species production during one ex
periment and its corresponding mass loss. As shown inFig. 4, the total
production of quantified volatile species was found to lie between 0.01
and 0.03 g (volatile species produced) per g (biomass transformed). As mentioned in introduction, about 15% of the mass loss in torrefaction was reported to produce permanent gases, 30 50% water, and the rest
dry condensable species [6]. As the mass loss is of about 0.2 0.4 g per g
(initial biomass) for the dynamic step of the torrefaction, the quantified part of the volatile species would represent between 10 and 33% of the total dry condensable species produced in torrefaction. This result
seems satisfactory compared to the state of the art in thefield. It can be
explained by the limits of the technique, especially the complexity of
the chromatograms which implies a challenging identification of some
volatile species because of overlapping peaks. Furthermore, about thirty other minor chemical species have been identified but could not
be quantified.
Table 3
Identified and quantified chemical compounds released in biomass torrefaction experiments in TGA-GC/MS, with their characteristic m/z.
Chemical compound m/z Identified Quantified Chemical compound m/z Identified Quantified
Acids Phenols
formic acid 45 X X phenol 94 X X
acetic acid 43 X X phenol, 2-methoxy (guaiacol) 109 X X
propionic acid 74 X X phenol, 2,6-dimethoxy- (syringol) 154 X X
2-propenoic acid 72 X 2-methoxy-4-vinylphenol 150 X X
larixic acid (maltol) 126 X cathecol 110 X X
2-butenoic acid 86 X isoeugenol (cis + trans) 164 X X
3-furancarboxylic acid 112 X eugenol 164 X X
Furans vanillin 151 X X
furan 68 X X phenol, 2-methoxy-4-methyl- (creosol) 95 X
3-furaldehyde 95 X X phenol,4-ethyl-2-methoxy 137 X
furfural 96 X X P-propylguaiacol 137 X
2-furanmethanol 98 X X Linear ketones
acetylfuran 95 X X 2,3-butanedione 86 X
2(5H)-furanone 55 X X 3-pentanone 57 X
furan, 2-methyl- 82 X 2,3-pentanedione 43 X X
2-furancarboxylic acid, methyl ester 95 X hydroxyacetone 43 X X
2-furancarboxaldehyde, 5-methyl- 110 X 1-hydroxy, 2-butanone 57 X
2,5-furandione, 3-methyl- 68 X 2-propanone,1-(acetyloxy)- 43 X X
ethanone, 1-(3-hydroxy-2-furanyl)- (Isomaltol) 111 X 2-butanone 43 X
Alcohols 2-butanone, 1-(acetyloxy)- 57 X
methanol 31 X X Cyclic ketones
Aldehydes 4-cyclopentene-1,3-dione 96 X X
formaldehyde 30 X X 1,2-cyclopentanedione 98 X
acetylformaldehyde 72 X 2-cyclopenten-1-one, 2-hydroxy-3-methyl- 112 X
Other compounds
benzaldehyde, 4-hydroxy-3,5-dimethoxy- 182 X 2-hydroxy-gamma-butyrolactone 57 X
acetic acid, hydroxy-, methyl- ester 31 X 1,4; 3,6-dianhydro-(a)-d-glucopyranose 69 X
4H-pyran-4-one 96 X levoglucosenone 98 X
Fig. 4. Total production of quantified volatile species released in dynamic torrefaction (200–300 °C, 3 °C min1) per mass of biomass transformed.
g (total volatile species quantified}/ g(biomass transformed} 0 0 N 0 0 0 w 0 0 0
.,.
0The total quantified production of volatile species is similar for biomasses from the same family in the case of deciduous and coniferous
wood. However, the quantified production for agricultural coproducts
and herbaceous crops corresponds to a larger range. This can be ex plained by the heterogeneity of agricultural biomasses in terms of characterization, as mentioned previously. However, the total produc tion of volatile species has been shown to be different for the two wheat straws, despite their similar characterization and solid mass loss pro files.
Secondly, the quantified volatile species were grouped per chemical
family for each biomass (Fig. 5). Similarities can be found in the dis
tribution of the volatile species per chemical nature for the biomass families, namely deciduous wood, coniferous wood and agricultural biomasses (including herbaceous crops). In terms of chemical com pounds, acids are the major family for all biomasses (mainly re presented by acetic acid), followed by alcohols (methanol) and alde hydes (formaldehyde). The exception is for pine bark, for which acids are produced in comparable amounts to the other chemical compounds. The proportion of alcohols and aldehydes in the total volatile species production is more important for coniferous woods, including bark, in detriment of the acid production. Furans, ketones and phenols are also produced for all biomasses in variable proportions. This behavior is in accord with the similarities in the macromolecular composition of the biomasses per biological family.
3.3.3. Production profiles
The production profiles of the quantified volatile species were
analyzed per chemical compound versus temperature and biomass type. The points in the production profile curves were connected by B spline interpolation from OriginLab 9.1 for visualization purposes. The max
imum temperature of formation mainly differs according to the che
mical compound, and only to a lower extent according to the biomass type. (Figs. 6 13).
By analyzing volatile species release per biomass family (woody, agricultural and herbaceous biomasses), several chemical compounds show similar profiles of formation for biologically close biomasses. This is the case for deciduous woods, especially for ash wood and willow, and, to a minor extent, for poplar and beech. In the other group, con iferous woods also tend to have similar patterns of volatile species formation. As stated in the section about solid, agricultural biomasses constitute a heterogeneous group in terms of macromolecular compo
sition (Tables 1 and 2) and, consequently, of torrefaction behavior.
However, it is noteworthy that almost identical volatile release profiles
could be observed for the two wheat straws (Figs. 6 and 7). Asfirst
approach, torrefaction behavior would therefore be characteristic of each biomass species. It may be conditioned by the macromolecular composition of the plant, as well as by the arrangement of its macro molecular components by intra and inter linkages in the structure
[46,47].
By relating the volatile species formation with the solid mass loss, biomasses exhibiting the highest degradation extents in torrefaction were in general associated with production profiles of a superior order of magnitude. Exceptions were found, as in the case of acetic acid re lease for wheat straw. On the contrary, grape seed cake and coniferous wood exhibit in general low volatile species release.
Secondly, the experimental results were analyzed per chemical compound versus temperature and biomass type.
Acetic acid, which was the major volatile species detected, presents an increasing production with increasing torrefaction temperature, with a maximal production generally at temperatures lower than 300 °C (Fig. 6, left). In the case of coniferous wood, the production profile is more attenuated. According to literature, the acid acetic formation is enhanced by the presence of xylan, while glucomannan, less reactive,
leads to formic acid production [43]. This difference was reported to be
due to the presence of acetoxy and methoxy groups attached to the xylose units in deciduous wood, which form acetic acid and methanol
under torrefaction conditions [11]. As a result, the lower temperature
maximum for coniferous wood could be derived from their lower xylan content, which reacts at lower temperatures than glucomannan (Table 2). Methanol, which is also expected to be mainly produced by hemicelluloses, is characterized by a maximum of its production profile
at low temperatures (Fig. 6, right). This different profile compared to
that of acetic acid could be derived from a second source of release of methanol, which could correspond to the scission of the methoxy groups attached to phenolic units from lignin.
Different production profiles were determined for other quantified
acid species, namely formic acid and propionic acid. In thefirst case, an
irregular production was measured in function of the torrefaction temperature, which reflects the experimental difficulties to quantify
this compound in a complex volatile mixture (Fig. 7, left). In the second
case, the production of propionic acid is enhanced with the torrefaction
temperature (Fig. 7, right). Corn cob and wheat straws present a higher
production of this compound, which has been reported in the literature to be derived from conversion of extractives. However, the initial composition of extractives in the raw biomasses does not correlate with the propionic acid production in our case.
Furfural presents a maximum of the production profiles at tem
peratures below 300 °C (Fig. 8, left). This result is coherent with pre
vious studies indicating that furfural is mainly produced at low tem
perature, derived from cellulose and hemicellulose decomposition [41].
Other furans are mostly released at higher torrefaction temperatures,
more related to the degradation of cellulose (Fig. 8, right). Interest
ingly, 2 furanmethanol exhibits local minima at 270 and 290 °C (Fig. 9,
left), which can also be found for some biomasses in the case of 2(5H) furanone (Fig. 9, right).
Phenolic compounds are known to be derived from lignin, which is
Fig. 5. Distribution of the total production of volatile species per chemical family obtained during torrefaction of raw biomasses in TGA-GC/MS.
100% 80% 60% 40% 20%
1
1
1
1
~
~
1
1
1
LI • • • • • • • • • •• • •
0% 000 e;v' ~_..,: 'Qe; if:
~o.,.
'I>;;:, ~o J_':$-~ & ~ ~
9
~ ~e; ~ ' ;<,\ ~~ - ~ ~ ~ ~ G & ~ ~ ~
q; e; 'I,<:- "'o ~<:- 0 "' ,e; e;
~ ~ -~ ~ & ~ ~ ~ ~
f,'- '-~ <$" ~
ë
,e; ...
"
,,.o'-e;
,,c,o
e;O c,'I> ,;<,'I,~ _,.,§,éb•
<-~ ...-~ ~ 'o ~ ~ ~ ~
6
~,
' ... _,.'<:' • 7 -aldehyde • 6-alcohol • 5 -cyclic ketone • 4 - linear ketone • 3 -phenol•
2 -furan • 1-acidonly partially and progressively degraded under torrefaction condi tions. The phenolic compounds representing the lignin base units,
namely phenol, guaiacol and syringol, present production profiles
which are enhanced by the torrefaction temperature (Fig. 10). This
acceleration of the production starts at slightly lower temperatures for syringol, followed by guaiacol and phenol. Syringol is not produced by coniferous wood, which is in agreement with the absence of syringyl units in lignin of this kind of essence [48].
No other syringyl derived compounds were detected in torrefaction apart from syringol. On the other hand, guaiacyl derived compounds
were detected for all biomasses (Fig. 11). Eugenol and isoeugenol (cis/
trans) are mostly produced at high torrefaction temperatures and for woody biomasses. Other guaiacyl phenolic compounds, such as eugenol and vanillin, are largely present at low torrefaction temperatures (200 to 210 °C), which might be at least partially due to the degradation
of biomass extractives. In general, the production profiles of the volatile
species derived from the same lignin unit are similar (phenyl , guaiacyl , syringyl ) particularly for woods. Furthermore, the produc
tion of the substituted phenolic compounds, such as vanillin (Fig. 11),
tends to start at lower torrefaction temperatures than the lignin base
phenolic compounds, guaiacol in this case (Fig. 10). These results are in
accord with previous results reported from Py GC/MS tests [48].
Concerning other lignin derived compounds, formaldehyde is rather produced by wood at higher torrefaction temperatures. However, it was not detected for grape seed cake, which is the biomass with the highest lignin content. This could be due to a difference in the structure of the
lignin from this agricultural biomass, supposed to be composed of He,
G and Se units, while lignin from coniferous wood is mostly composed of G units. Its production profile generally tends to be independent of
the torrefaction temperature, except for woody biomasses (Fig. 12).
Per biomasses, similarities were found between corn cob and the two wheat straws for volatile species as guaiacol, acetylfuran and va
nillin (Fig. 11). On the other hand, grape seed cake and sunflower seed
shells exhibited very different volatile species release profiles compared to the other biomasses. In the case of grape seed cake, this may be
attributed to its exceptionally high content in lignin. For sunflower seed
shells, its composition is on the average of other biomasses, except for the ash content, whose influence in torrefaction is not clearly de
termined [12]. A detailed study of the structure of grape seed cake and
sunflower seed shells, which seem to be particularly different in the
Fig. 6. Production profile of acetic acid (left) and methanol (right) versus temperature and time obtained for raw biomasses in torrefaction in TGA-GC/MS.
Fig. 7. Production profile of formic acid (left) and propionic acid (right) versus temperature and time obtained for raw biomasses in torrefaction in TGA-GC/MS.
0.020 ~~~~-~~~~-~~~~ 320 0.008 ~~~~-~~~-~~~~~~ ---- io
î
Ë
0.015"'
..
~~
....
OI C:g
~ 0.010..
"'
'-'..
.. e
.. 0 '-' ·-.. .0 'ëii 'ëi,0.005 ~····• ···.tt.
..
..
.
·•
300 280 ---u 260 ~ E-240 220----
:;----
..
..,
.. ..
e
; iS..
"'
- =
!:
~
0 "'= "'
..
..
~
§
së
bl) bl) 0.007 0.006 0.005 0.004 0.003 0.002 0.001 0.000 " ' -~ - - - ' - ~ - L - - - ' - - - - ' - - - ' - " - - - ' - - ' - - - U 200 0.000 "'-~-'--~---'-~_.___,_____.,_..___,__,,---
..,
..,
..
~
Ê
.. .E-
~"'
C..,
..
'ü l::"'
..
. !: ~e e
s
-
~
.... .0 ';o"S'.o 0 2 ···•·· Ash-wood ···• ·· Beech - -Poplar- -
wmow
- -T 4 6 8 10 t (min) ···•·· Pine__.__ Pine forest residues
__.__ Scot pine bark
0.006 ~~~~-~~~~~~~~~~ 0.005 0.004 0.003 0.002 0.001 0.000 0
1
/
~..
,
:.
:::::SX::
~
.,....
1 ... .... j 2 ···•·· Ash-wood · ··•·· Beech - -Poplar - -Willow- -
T
4 6 t (min) ···•·· Pine 8 10__.__ Pine forest residues
__.__ Scot pine bark 320 300 280
0 2
· · ... · · Miscanthus
- + -Reed canary grass
0.0004
----,;-
,;-~Ë
0.0003....
~..
iE"'
--- :g
1a
260 l;-) '"~
0.0002;:;
·S
~ .=1e
240g,~
a
'ëii 0.0001 220 200 'ëii 0.0000 0 2 · · ... · · Miscanthus- + -Reed canary grass
4
4
6 8
t (min)
- -corncob
- -Grape seed cake
10
- -Sunflower seed shells
Wheat straw (French) Wheat straw (Swedish)
6 8 10
t(min)
- -corncob
- -Grape seed cake
- -Sunflower seed shells
Wheat straw (French) Wheat straw (Swedish)
320 300 280 260
E
E-240 220 200 320 300 280 260E
E-240 220 200family of agricultural biomasses, could help to explain these differ ences. It is interesting to note that herbaceous biomasses generally re main close to agricultural byproducts, due to their similar biological structure and, in some cases, macromolecular composition (example for
2 propanone, 1 (acetyloxy) ,Fig. 13).
Finally, asfirst approach, a representative of each main wood fa
mily, namely deciduous and resinous, seems to be sufficient to describe the formation of volatile species. For agricultural biomasses, one re presentative may be appropriate for herbaceous biomasses but would not be sufficient for agricultural byproducts due to the heterogeneity of the group.
4. Conclusions
In this work, a large panel of biomass types, including coniferous and deciduous woods, herbaceous crops and agricultural by products, was analyzed in torrefaction. The use of a TGA coupled to a GC/MS through a heated loop system allows to simultaneously acquire in formation on the kinetics of solid mass loss and on the formation of volatile species. The obtained results enabled to draw out several major
conclusions regarding biomass torrefaction behavior. Similarities could clearly be drawn for biomasses from the same type, particularly for woody biomasses. Two main categories could be observed in the dy namic part of the torrefaction experiment according to solid degrada
tion profiles, with on the one hand deciduous wood and on the other
hand all the other biomass types. In the subsequent isothermal step at 300 °C, the same solid degradation profile was observed for all bio
masses, but with different rates. Regarding volatile species release, a
large variety of chemical compounds was identified. Production profiles
versus temperature were found to be different among volatile species from the same chemical family. On the other hand, similarities were found in volatile species release for the two woody families, and to some extent for herbaceous ones, while agricultural biomasses showed diverse behaviors. This could be explained by the heterogeneity of these biomasses, both in terms of composition and structural matrix. This makes hazardous to describe the behavior of these latter by only one representative biomass, contrary to woody and herbaceous biomass. As
a result, the macromolecular composition was confirmed as a de
termining parameter of biomass behavior in torrefaction. However, the biological structure of biomass and the intrinsic characterization of
Fig. 8. Production profile of furfural (left) and 3-furaldehyde (right) versus temperature and time obtained for raw biomasses in torrefaction in TGA-GC/MS.
Fig. 9. Production profile of 2-furanmethanol (left) and 2(5H)-furanone (right) versus temperature and time obtained for raw biomasses in torrefaction in TGA-GC/ MS. 0.0025 ~~~--~~~-~~~--~
--... j
0.0020ÎË
"' ,E ~ ~ 0.0015.,
"'
....
-
"'
...
"'
~ ~
0.0010 .2 .9 ~.c Oil~ bl)0.0005 ~ ~~ 0.0000 ~~~~~~~~~~-~~~ ----0 2 ···•·· Ash-wood ·· ·•·· Beech -+-Poplar -+-Willow - -T 0.0014Î,...
0.0012;~
1l
Ë
0.0010 .. ,E-
g ;
"'
0.0008"'
..
.c ......
"'
Ë
~ 0.0006 C ê "' 0,a
;§,0.0004 ' c.o N"6ii
0.0002 0.0000 0 2 ···•·· Ash-wood ···•·· Beech -+-Poplar -+-Willow-
-
T
4 6 t(min) ···•·· Pine 8 10__.__ Pine forest residues __.__ Scot pine bark
4 6
t(min)
···•·· Pine
8 10
__.__ Pine forest residues
__.__ Scot pine bark
320 0.00010 . - - - ~ - r - ~ - - - . - . - - - . , . - - r - - - - r - - - r - ~ 300 280 260 E f-, 240 220
----:;- ----:;- 0.,
.,
.00008 ~Ë
~ 0 E <t;; 0.00006 o, C 1::1 ~ >, ... .c "' ~ ~ 0.00004 "E .. 0=
-... ,Cl!:?,
'Eii 0.00002 Oil 200 0.00000 0 ~~~~-~~~~-~~~~ 2 · · ... · · Miscanthus - -Reed canary grass320 0.0014
----
0.0012 300...
1::1 ... ., 1::1"'
.,
~ ë 0.0010 280~~
...
~ ~ 0.0008 C ni 260t
0 .b f-, ~ i:i 0.0006 .2 "' 2405:'
' ë .9 0.0004 lfl ,.Q ~~ 220 "6ii 0.0002 200 0.0000 0 · · ... · · Miscanthus - -Reed canary grass2
4 6
t (min)
-+-Corncob
8
-+-Grape seed cake
10
- -Sunflower seed shells Wheat straw (French) Wheat straw (Swedish)
4 6
t (min)
-+-Corncob
8
-+-Grape seed cake
10
-+-Sunflower seed shells
· · ·• · Wheat straw (French)
Wheat straw (Swedish) 12 320 300 280 260E f-, 240 220 200 320 300 280
...
260t f-, 240 220 200Fig. 10. Production profile of phenol (left) and syringol (right) versus temperature and time obtained for raw biomasses in torrefaction in TGA-GC/MS.
Fig. 11. Production profile of isoeugenol (left) and vanillin (right) versus temperature and time obtained for raw biomasses in torrefaction in TGA-GC/MS.
Fig. 12. Production profile of formaldehyde versus temperature and time ob-tained for raw biomasses in torrefaction in TGA-GC/MS.
Fig. 13. Production profile of 2-propanone, 1-(acetyloxy)- versus temperature and time obtained for raw biomasses in torrefaction in TGA-GC/MS.
0.0010 :;, 0.0008
----
..
,_., e
-0 ,_!
~
0.0006.. =
-;
,_
...
~ê
~
0.0004"' e
-a
0 "6i) ~0.0002o
.
0000 "'-.,___.___.__..._...,____.___.___,___.____.___.___.___, 0 2 4 6 8 10 12 320 300 280 260 E...
240 220 200 0.0010 S' 0.0008----
..
s-
.,
=
...
~ ~ 0.0006- =
.,
...
..
-
...
0 "' ~ ~ 0.0004·
;: =
>, 0 "'·-...,...
.. 'ëo
0.0002 0.0000 0 2 4 6 t (min) 8 10 320 300 2B0 260E...
240 220 200 12 ···•·· Ash-wood ···•·· Beech --+-Poplar t (min)... Pine -- ... --Miscanthus - corn cab
__.__ Pine forest residues __.__ Scot pine bark
- -Reed canary grass - Grape seed cake
--+-Willow - -T 0.0010 ~ - - - ~ ~
----
,-, ,-, ~ 0.0008 ~"' ,_
e
.. 0.,
....
.:i ~ 0.0006 320 300 280,_
..
-
0 ...,_
= "'
.,
"'
260 E ---,i',i'"'"'
~Ë
.!! 0"'~
..
"' OI C-g,
g
.c "'"'
"'
"0 "'j
... .c.
§
0 ' - ' :::,..
g,c
Ê
0.0004 ., 0 0 - -"' ,Qi,
'6;; 0.0002 0.0000 0.008 ~ 0.006 0.004 0.002 0 2 ---•--Ash-wood •··•--Beech --+-Poplar --+-Willow - -T 1 1•
···•.·.
•
•: 4 1 6 t (min) ... Pine 8 10__.__ Pine forest residues __.__ Scot pine bark 1 1
J
320 300 240 220 200 260g
r
·
•
-
240..
0.000 ~::
--
:
---
~ -:
::9
220 1 1~
~
200 0 2 4 -· • • Ash-wood -_.,_ • Pine-·• -Beech ....,._ Pine forest residues
--+-Poplar ..._Scotpinebark
--+-Willow
- -T
6 8 10
t(min]
· _.,. · Miscanthus - 9 -Corn cob
---+-Reed canary grass ----Grape seed cake
----sunflower seed shells
• ·• • Wheat straw (French) Wheat straw (Swedîsh)
...
- Sunflower seed shells Wheat straw (French) Wheat straw (Swedish) 0.0004 ,--,--.----,,---,.----,---,---,---,--, 320 --...
~
0.0003ÎÊ
"' .E..
"'
<11 C ~g
0.0002;§
~=
ra Ce
.. 0 >--'ëo
e
..
0.0001 300 2B0 260E...
240 220 0.0000 ~~~~~~~~~~~~~~ 200 0 2 · --• · · Miscanthus - -Reed canary grass---
0.0006 'a' ~"'
0.0005f-"'
~i
' 5 ~ .. 0.0004 f-o.S!~a
1lg
0.0003t
?
~
,...
"'
g
g
0.0002 0 -C e_,"'
..
o. 0.0001 f- ~ 8 o. 4 6 8 t (min) - corn cab 10- Grape seed cake 12
- Sunflower seed shells ·• --Wheat straw (French)
Wheat straw (Swedish)
.
,T . / 320 _7' 300...,.,..-
--1
280 ~ ~ 260 t .-·· .• · .. -~::~ ' 240 !-. !-. /~ ~ ~ ---=1 220 C!,..
0.0000 ,z: --c· --, ... · - 1 " 200 --• ·Ash-wood - -• • Beech --+-Poplar --+-Willow - -T 0 2 4 __ ._ _ Pine- & -Pine forest residues _._Scot pine bark
6 8 10
t(min)
· .... -Miscanthus - - -corn cob
---+-Reed canary grass ~ Grape seed cake ~ Sunnower seed shells
--• -Wheat straw (French) Wheat straw (Swedish)
[1] European Commission, State of Play on the Sustainability of Solid and Gaseous Biomass Used for Electricity, Heating and Cooling in the EU, (2014)https://ec. europa.eu/energy/sites/ener/files/2014 biomass state of play .pdf, Accessed date: 28 September 2016.
[2] H.B. Goyal, D. Seal, R.C. Saxena, Bio-fuels from thermochemical conversion of re-newable resources: a review, Renew. Sustain. Energy Rev. 12 (2008) 504–517, https://doi.org/10.1016/j.rser.2006.07.014.
[3] J.J. Harrington, R. Booker, R.J. Astley, Modelling the Elastic Properties of Softwood. Part I: the Cell-wall Lamellae, Holz Als Roh- Werkst, 1998, pp. 37–41. [4] S.V. Pisupati, A.H. Tchapda, Chapter 15: thermochemical processing of biomass,
Adv. Bioprocess Technol, Pogaku Ravindra, Switzerland, 2015.
[5] T. Nocquet, C. Dupont, J.-M. Commandre, M. Grateau, S. Thiery, S. Salvador, Volatile species release during torrefaction of wood and its macromolecular con-stituents: Part 1– experimental study, Energy 72 (2014) 180–187,https://doi.org/ 10.1016/j.energy.2014.02.061.
[6] T. Nocquet, C. Dupont, J.-M. Commandre, M. Grateau, S. Thiery, S. Salvador, Volatile species release during torrefaction of biomass and its macromolecular constituents: Part 2– modeling study, Energy 72 (2014) 188–194,https://doi.org/ 10.1016/j.energy.2014.05.023.
[7] R. Pentananunt, A.N.M.M. Rahman, S.C. Bhattacharya, Upgrading of biomass by means of torrefaction, Energy 15 (1990) 1175–1179,https://doi.org/10.1016/ 0360-5442(90)90109-F.
[8] W.-H. Chen, J. Peng, X.T. Bi, A state-of-the-art review of biomass torrefaction, densification and applications, Renew. Sustain. Energy Rev. 44 (2015) 847–866, https://doi.org/10.1016/j.rser.2014.12.039.
[9] E.M. Fisher, C. Dupont, L.I. Darvell, J.-M. Commandré, A. Saddawi, J.M. Jones, M. Grateau, T. Nocquet, S. Salvador, Combustion and gasification characteristics of chars from raw and torrefied biomass, Bioresour. Technol. 119 (2012) 157–165, https://doi.org/10.1016/j.biortech.2012.05.109.
[10] A. Anca-Couce, I. Obernberger, Application of a detailed biomass pyrolysis kinetic scheme to hardwood and softwood torrefaction, Fuel 167 (2016) 158–167,https:// doi.org/10.1016/j.fuel.2015.11.062.
[11] M.J. Prins, K.J. Ptasinski, F.J.J.G. Janssen, Torrefaction of wood. Part 2. Analysis of products, J. Anal. Appl. Pyrolysis 77 (2006) 35–40,https://doi.org/10.1016/j.jaap. 2006.01.001.
[12] M.J.C. van der Stelt, H. Gerhauser, J.H.A. Kiel, K.J. Ptasinski, Biomass upgrading by torrefaction for the production of biofuels: a review, Biomass Bioenergy 35 (2011) 3748–3762,https://doi.org/10.1016/j.biombioe.2011.06.023.
[13] M. Detcheberry, P. Destrac, S. Massebeuf, O. Baudouin, V. Gerbaud, J.-S. Condoret, X.-M. Meyer, Thermodynamic modeling of the condensable fraction of a gaseous effluent from lignocellulosic biomass torrefaction, Fluid Phase Equil. 409 (2016) 242–255,https://doi.org/10.1016/j.fluid.2015.09.025.
[14] K. Lê Thành, J.-M. Commandré, J. Valette, G. Volle, M. Meyer, Detailed identifi-cation and quantifiidentifi-cation of the condensable species released during torrefaction of lignocellulosic biomasses, Fuel Process. Technol. 139 (2015) 226–235,https://doi. org/10.1016/j.fuproc.2015.07.001.
[15] E. Rodriguez Alonso, C. Dupont, L. Heux, D. Da Silva Perez, J.-M. Commandre, C. Gourdon, Study of solid chemical evolution in torrefaction of different biomasses through solid-state 13C cross-polarization/magic angle spinning NMR (nuclear magnetic resonance) and TGA (thermogravimetric analysis), Energy 97 (2016) 381–390,https://doi.org/10.1016/j.energy.2015.12.120.
[16] G.J. Evans, R.R. Bellinder, R.R. Hahn, Integration of vinegar for in-row weed con-trol in transplanted bell pepper and broccoli, Weed Technol. 25 (2011) 459–465, https://doi.org/10.1614/WT-D-10-00167.1.
[17] H. Fischer, Y. Kuzyakov, Sorption, microbial uptake and decomposition of acetate in soil: transformations revealed by position-specific 14C labeling, Soil Biol. Biochem. 42 (2010) 186–192,https://doi.org/10.1016/j.soilbio.2009.10.015. [18] L.E. Arteaga-Pérez, C. Segura, V. Bustamante-García, O. Gómez Cápiro, R. Jiménez,
Torrefaction of wood and bark from Eucalyptus globulus and Eucalyptus nitens: focus on volatile evolution vs feasible temperatures, Energy 93 (2) (2015) 1731–1741,https://doi.org/10.1016/j.energy.2015.10.007.
[19] A. Ohliger, M. Förster, R. Kneer, Torrefaction of beechwood: a parametric study including heat of reaction and grindability, Fuel 104 (2013) 607–613,https://doi. org/10.1016/j.fuel.2012.06.112.
[20] L. Shang, J. Ahrenfeldt, J.K. Holm, S. Barsberg, R. Zhang, Y. Luo, H. Egsgaard, U.B. Henriksen, Intrinsic kinetics and devolatilization of wheat straw during tor-refaction, J. Anal. Appl. Pyrolysis 100 (2013) 145–152,https://doi.org/10.1016/j. jaap.2012.12.010.
[21] R.B. Bates, A.F. Ghoniem, Biomass torrefaction: modeling of volatile and solid product evolution kinetics, Bioresour. Technol. 124 (2012) 460–469,https://doi. org/10.1016/j.biortech.2012.07.018.
[22] T. Nocquet, Torréfaction du bois et de ses constituants: Expériences et modélisation
des rendements en matières volatiles, Université de Toulouse, 2012,http://ethesis. inp-toulouse.fr/archive/00002140/01/nocquet.pdf.
[23] M. Broström, A. Nordin, L. Pommer, C. Branca, C. Di Blasi, Influence of torrefaction on the devolatilization and oxidation kinetics of wood, J. Anal. Appl. Pyrolysis 96 (2012) 100–109,https://doi.org/10.1016/j.jaap.2012.03.011.
[24] B. Arias, C. Pevida, J. Fermoso, M.G. Plaza, F. Rubiera, J.J. Pis, Influence of tor-refaction on the grindability and reactivity of woody biomass, Fuel Process, Technology 89 (2008) 169–175,https://doi.org/10.1016/j.fuproc.2007.09.002. [25] T.G. Bridgeman, J.M. Jones, I. Shield, P.T. Williams, Torrefaction of reed canary
grass, wheat straw and willow to enhance solid fuel qualities and combustion properties, Fuel 87 (2008) 844–856,https://doi.org/10.1016/j.fuel.2007.05.041. [26] M.J. Prins, K.J. Ptasinski, F.J.J.G. Janssen, Torrefaction of wood: Part 1. Weight loss
kinetics, J. Anal. Appl. Pyrolysis 77 (2006) 28–34,https://doi.org/10.1016/j.jaap. 2006.01.002.
[27] T. Ferro, V. Vigouroux, A. Grimm, R. Zanzi, Torrefaction of agricultural and forest residues, in: Cuba. 2004, Guantánamo, Cuba, 2004.
[28] Q.-V. Bach, W.-H. Chen, Y.-S. Chu, Ø. Skreiberg, Predictions of biochar yield and elemental composition during torrefaction of forest residues, Bioresour. Technol. 215 (2016) 239–246,https://doi.org/10.1016/j.biortech.2016.04.009. [29] J.H. Peng, X.T. Bi, S. Sokhansanj, C.J. Lim, Torrefaction and densification of
dif-ferent species of softwood residues, Fuel 111 (2013) 411–421,https://doi.org/10. 1016/j.fuel.2013.04.048.
[30] W.-H. Chen, K.-M. Lu, S.-H. Liu, C.-M. Tsai, W.-J. Lee, T.-C. Lin, Biomass torrefac-tion characteristics in inert and oxidative atmospheres at various superficial velo-cities, Bioresour. Technol. 146 (2013) 152–160,https://doi.org/10.1016/j. biortech.2013.07.064.
[31] Y. Uemura, W.N. Omar, T. Tsutsui, S.B. Yusup, Torrefaction of oil palm wastes, Fuel 90 (2011) 2585–2591,https://doi.org/10.1016/j.fuel.2011.03.021.
[32] W.-H. Chen, P.-C. Kuo, A study on torrefaction of various biomass materials and its impact on lignocellulosic structure simulated by a thermogravimetry, Energy 35 (2010) 2580–2586,https://doi.org/10.1016/j.energy.2010.02.054.
[33] K. Cheng, W.T. Winter, A.J. Stipanovic, A modulated-TGA approach to the kinetics of lignocellulosic biomass pyrolysis/combustion, Polym. Degrad. Stabil. 97 (2012) 1606–1615,https://doi.org/10.1016/j.polymdegradstab.2012.06.027.
[34] J.F. Saldarriaga, R. Aguado, A. Pablos, M. Amutio, M. Olazar, J. Bilbao, Fast characterization of biomass fuels by thermogravimetric analysis (TGA), Fuel 140 (2015) 744–751,https://doi.org/10.1016/j.fuel.2014.10.024.
[35] M. González Martínez, C. Dupont, S. Thiery, X.M. Meyer, C. Gourdon, Characteristic time analysis of biomass torrefaction phenomena - application to thermogravi-metric analysis device, Chem. Eng. Trans. 50 (2016) 61–66,https://doi.org/10. 3303/CET1650011.
[36] S. Jacob, D. Da Silva Perez, C. Dupont, J.-M. Commandré, F. Broust, A. Carriau, D. Sacco, Short rotation forestry feedstock: influence of particle size segregation on biomass properties, Fuel 111 (2013) 820–828,https://doi.org/10.1016/j.fuel.2013. 04.043.
[37] D. da S. Perez, C. Dupont, A. Guillemain, S. Jacob, F. Labalette, S. Briand, S. Marsac, O. Guerrini, F. Broust, J.-M. Commandre, Characterisation of the most re-presentative agricultural and forestry biomasses in France for gasification, Waste Biomass Valorization 6 (2015) 515–526, https://doi.org/10.1007/s12649-015-9374-3.
[38] S.V. Vassilev, D. Baxter, L.K. Andersen, C.G. Vassileva, An overview of the chemical composition of biomass, Fuel 89 (2010) 913–933,https://doi.org/10.1016/j.fuel. 2009.10.022.
[39] S.V. Vassilev, D. Baxter, L.K. Andersen, C.G. Vassileva, T.J. Morgan, An overview of the organic and inorganic phase composition of biomass, Fuel 94 (2012) 1–33, https://doi.org/10.1016/j.fuel.2011.09.030.
[40] R. Fahmi, A.V. Bridgwater, L.I. Darvell, J.M. Jones, N. Yates, S. Thain, I.S. Donnison, The effect of alkali metals on combustion and pyrolysis of Lolium and Festuca grasses, switchgrass and willow, Fuel 86 (2007) 1560–1569,https://doi. org/10.1016/j.fuel.2006.11.030.
[41] Kirk-Othmer, Encyclopedia of Chemical Technology, Willey, 1999,http:// onlinelibrary.wiley.com/book/10.1002/0471238961/homepage/ EditorsContributors.html, Accessed date: 22 March 2016.
[42] A. Sequeiros, J. Labidi, Characterization and determination of the S/G ratio via Py-GC/MS of agricultural and industrial residues, Ind. Crop. Prod. 97 (2017) 469–476, https://doi.org/10.1016/j.indcrop.2016.12.056.
[43] K. Werner, L. Pommer, M. Broström, Thermal decomposition of hemicelluloses, J. Anal. Appl. Pyrolysis 110 (2014) 130–137,https://doi.org/10.1016/j.jaap.2014. 08.013.
[44] W.-H. Chen, P.-C. Kuo, Torrefaction and co-torrefaction characterization of hemi-cellulose, cellulose and lignin as well as torrefaction of some basic constituents in biomass, Energy 36 (2011) 803–811,https://doi.org/10.1016/j.energy.2010.12. 036.
[45] S. Wang, X. Guo, T. Liang, Y. Zhou, Z. Luo, Mechanism research on cellulose pyr-olysis by Py-GC/MS and subsequent density functional theory studies, Bioresour. Technol. 104 (2012) 722–728,https://doi.org/10.1016/j.biortech.2011.10.078. [46] P.F.H. Harmsen, W.J.J. Huijgen, L.M. Bermúdez López, R.R.C. Bakker, Literature
Review of Physical and Chemical Pretreatment Processes for Lignocellulosic Biomass, Energy Research Centre of the Netherlands, 2010.
[47] G. Henriksson, J. Li, L. Zhang, M.E. Lindström, Chapter 9: lignin utilization, Thermochem. Convers. Biomass Liq. Fuels Chem, 2010http://pubs.rsc.org/en/ content/chapter/bk9781849730358-00222/978-1-84973-035-8, Accessed date: 24 March 2016.
[48] T. Ohra-aho, F.J.B. Gomes, J.L. Colodette, T. Tamminen, S/G ratio and lignin structure among Eucalyptus hybrids determined by Py-GC/MS and nitrobenzene oxidation, J. Anal. Appl. Pyrolysis 101 (2013) 166–171,https://doi.org/10.1016/j. jaap.2013.01.015.
cellulose, hemicelluloses and lignin might also play a role in solid de gradation and volatile species release in biomass torrefaction. Acknowledgments
This project has received funding from the European Union's Horizon 2020 research and innovation program under grant agreement No 637020−MOBILE FLIP.