HAL Id: hal-00318274
https://hal.archives-ouvertes.fr/hal-00318274
Submitted on 8 Mar 2007
HAL is a multi-disciplinary open access
archive for the deposit and dissemination of
sci-entific research documents, whether they are
pub-lished or not. The documents may come from
teaching and research institutions in France or
abroad, or from public or private research centers.
L’archive ouverte pluridisciplinaire HAL, est
destinée au dépôt et à la diffusion de documents
scientifiques de niveau recherche, publiés ou non,
émanant des établissements d’enseignement et de
recherche français ou étrangers, des laboratoires
publics ou privés.
D. M. Willis, F. R. Stephenson, Huiping Fang
To cite this version:
D. M. Willis, F. R. Stephenson, Huiping Fang. Sporadic aurorae observed in East Asia. Annales
Geophysicae, European Geosciences Union, 2007, 25 (2), pp.417-436. �hal-00318274�
www.ann-geophys.net/25/417/2007/ © European Geosciences Union 2007
Annales
Geophysicae
Sporadic aurorae observed in East Asia
D. M. Willis1,2, F. R. Stephenson3, and Huiping Fang11Centre for Fusion, Space and Astrophysics, Department of Physics, University of Warwick, Coventry CV4 7AL, UK 2Rutherford Appleton Laboratory, Chilton, Didcot, Oxon OX11 0QX, UK
3Department of East Asian Studies, University of Durham, Durham DH1 3TH, UK
Received: 1 August 2006 – Revised: 14 November 2006 – Accepted: 23 January 2007 – Published: 8 March 2007
Abstract. All the accessible auroral observations recorded in
Chinese and Japanese histories during the interval AD 1840– 1911 are investigated in detail. Most of these auroral records have never been translated into a Western language before. The East Asian auroral reports provide information on the date and approximate location of each auroral observation, together with limited scientific information on the character-istics of the auroral luminosity such as colour, duration, ex-tent, position in the sky and approximate time of occurrence. The full translations of the original Chinese and Japanese au-roral records are presented in an appendix, which contains bibliographic details of the various historical sources. (There are no known reliable Korean observations during this inter-val.) A second appendix discusses a few implausible “auro-ral” records, which have been rejected. The salient scientific properties of all exactly dated and reliable East Asian auroral observations in the interval AD 1840–1911 are summarised succinctly. By comparing the relevant scientific information on exactly dated auroral observations with the lists of great geomagnetic storms compiled by the Royal Greenwich Ob-servatory, and also the tabulated values of the Ak (Helsinki) and aa (Greenwich and Melbourne) magnetic indices, it is found that 5 of the great geomagnetic storms (aa>150 or
Ak>50) during either the second half of the nineteenth
cen-tury or the first decade of the twentieth cencen-tury are clearly identified by extensive auroral displays observed in China or Japan. Indeed, two of these great storms produced auroral displays observed in both countries on the same night. Con-versely, at least 29 (69%) of the 42 Chinese and Japanese auroral observations occurred at times of weak-to-moderate geomagnetic activity (aa or Ak≤50). It is shown that these latter auroral displays are very similar to the more numer-ous (about 50) examples of sporadic aurorae observed in the United States during the interval AD 1880–1940. The
lo-Correspondence to: D. M. Willis
calised nature and spatial structure of some sporadic aurorae observed in East Asia is indicated by the use of descriptive terms such as “lightning”, “rainbow”, “streak” and “grid”.
Keywords. Ionosphere (Auroral ionosphere) –
Magneto-spheric physics (Auroral phenomena; Storms and sub-storms)
1 Introduction
The occurrence of the aurora borealis or aurora australis at relatively low geomagnetic latitudes during periods of weak-to-moderate geomagnetic activity has been reported in the literature on rare occasions. A salient feature of these re-ports is that the aurora was observed at geomagnetic latitudes that would conventionally imply the concurrent existence of a great geomagnetic storm. Botley (1963) drew attention to this phenomenon and used the term “sporadic aurora”, which she adopted from the earlier paper by Abbe (1895). In partic-ular, Botley (1963) defined sporadic aurorae as “comprising such instances as a single ray in a sky otherwise seemingly clear of auroral light, or isolated patches well to the equa-torial side of a great display”. Moreover, she noted a ca-sual mention by Fritz (1881) of observations in low geomag-netic latitudes when there was apparently little incidence of the aurora in high latitudes. Within the context of auroral physics, the word “sporadic” often has the connotation of a “spatially isolated” region of the night sky. Therefore, the term “sporadic aurorae” may be used to describe localised auroral displays that occur at low geomagnetic latitudes (ap-proximately, −45◦≤geomagnetic latitude ≤+45◦)during in-tervals of weak-to-moderate geomagnetic activity (aa≤50). The converse situation (“non-sporadic aurorae”) is the more familiar one in which extensive auroral displays at low ge-omagnetic latitudes occur at the times of great gege-omagnetic
storms and hence during intervals of strong geomagnetic ac-tivity (aa>150).
Silverman (2003) stated that he had originally discounted the early reports of sporadic aurorae but had been forced to re-evaluate the situation after he found a number of simi-lar records in a compilation of data from the United States. Indeed, Silverman (2003) provided the first proper scien-tific study of the existence of sporadic (or localised) auro-ral observations at relatively low latitudes, during periods of weak-to-moderate geomagnetic activity, by tabulating some 54 cases of such sporadic auroral occurrence. Apart from one observation from Grahamstown, South Africa, all his exam-ples of sporadic aurorae are from the United States and oc-curred during the interval AD 1880–1940. The sporadic au-roral observations presented by Silverman (2003) were taken primarily from a database he compiled that is based largely on the series entitled “Climatological Data of the United States”. Some additional observations were taken from other sources, principally the “Monthly Weather Review”.
As noted by Silverman (2003), the only two previous pa-pers that specifically discuss sporadic aurorae have reported a sufficiently small number of cases (Abbe, 1895, cites two and Botley, 1963, cites nine) to justify initial doubt about the reality of the phenomenon. From the historical view-point, the limited early evidence for sporadic aurorae may be summarised briefly as follows. Eddie (1894) presented an isolated example of such an event observed in the Southern Hemisphere, from Grahamstown, South Africa (geographic co-ordinates 33◦19′S, 26◦32′E), on 1894 July 9 during a period of moderate geomagnetic activity (half-daily values of the aa index during the interval July 7–10: 6, 9, 32, 37, 25, 26, 8, 9). Abbe (1895) published a description of an aurora on 1895 August 26, which was observed from both Charleston, South Carolina (geographic co-ordinates 32◦48′N, 79◦58′W), and Greendale, Kentucky (geographic co-ordinates 38◦06′N, 84◦32′W), during a period of weak geomagnetic activity (half-daily values of the aa index dur-ing the interval August 24–27: 5, 8, 3, 4, 15, 9, 4, 5). Silver-man (2003) quotes part of the text of the record from Gra-hamstown and the full text of the record from Charleston (which are both discussed in Sect. 3.2). Although Botley (1963) purportedly described nine such cases of sporadic au-rorae, several of which may be classified as “doubtful” by the criteria presented by Silverman (2003), most of these cases actually occurred at times of strong geomagnetic activity.
The main purpose of this paper is to point out that some of the auroral observations recorded in Chinese and Japanese histories provide evidence for the occurrence of sporadic au-rorae in another region of the world. To achieve this goal, every accessible and exactly dated (year, month and day all known precisely) oriental auroral observation that lies within the interval AD 1840–1911 has been extracted from the database of East Asian auroral observations discussed by Willis et al. (2005). However, three minor changes have been made to this database for the purposes of the present
investi-gation; these changes are defined in Sect. 2. The first exactly dated and reliable East Asian auroral observation in this time interval was recorded in China on 1844 April 21 and the last was recorded in Japan on 1909 September 25 and 26 (the for-mer day being the date of a great geomagnetic storm). The present study is deliberately restricted to the interval 1840– 1911, so that direct comparisons can be made with the lists of great and small geomagnetic storms (1840–1954), com-piled by the Royal Greenwich Observatory (1955), as well as with the magnetic indices Ak (1844–1867) and aa (1868 – present), discussed by Nevanlinna and Kataja (1993) and Mayaud (1980), respectively. Prior to 1840, there are no proper quantitative measurements of geomagnetic activity that can be utilised in direct comparisons with the histori-cal East Asian auroral observations, compilations of which do not extend beyond 1911. After 1911, lists of East Asian auroral sightings do not begin again until about the time of the International Geophysical Year (1957).
Therefore, the present investigation augments the study of sporadic auroral occurrence in the United States (Silver-man, 2003) by identifying the occurrence of the same phe-nomenon in China and Japan. (There appear to be no reli-able Korean auroral observations during the selected inter-val.) The approach adopted here differs slightly from that employed by Silverman (2003), at least to the extent that East Asian auroral observations coincident with great geo-magnetic storms are not automatically eliminated from the investigation. Such observations are retained because they confirm the general reliability of the East Asian auroral ob-servations (1840–1911), which might otherwise be consid-ered to be intrinsically less reliable than the more recent auro-ral observations from the United States (1880–1940). Hence the approach adopted here is similar to that of Botley (1963), who presented auroral observations acquired at times of both strong and weak geomagnetic activity.
2 The East Asian auroral observations
The 1198 entries originally included in the auroral database compiled by Willis et al. (2005) are largely derived from the catalogue of auroral observations from China, Korea and Japan (193 BC–AD 1770) published by Yau et al. (1995). The material from this catalogue has been supplemented with additional data from several sources, notably: (1) Chinese auroral records included in the catalogue published (in Chi-nese) by the Beijing Observatory (1988), which extends the Chinese auroral observations back to at least 210 BC and up to AD 1911; (2) the list of Japanese auroral records since AD 1600 included in the catalogue published (in Japanese) by Osaki (1994); and (3) a research paper by Matsushita (1956) on ancient aurorae seen in Japan. Three minor amend-ments have been made to the original auroral database com-piled by Willis et al. (2005). First, the supposed Japanese “auroral” observation on AD 1850 August 15 has now
been rejected because the quoted double hour shen (15:00– 17:00 LT) corresponds to late afternoon, which is long before sunset in August. Second, the supposed Chinese “auroral” observation on AD 1885 December 26 has now been rejected because the description of the phenomenon is obscure and does not necessarily correspond to an auroral display (despite the fact that it is included in the list compiled by the Beijing Observatory, 1988). Third, it has subsequently become clear that the extensive Japanese auroral observations on AD 1872 February 4 were followed by similar observations (also in Japan) on February 6. All the East Asian auroral observa-tions within the interval AD 1840–1911 have been carefully translated into English, with appropriate help from experts in Classical Chinese and Japanese. The translations of the relevant records are presented in Appendix A. The reasons for rejecting the “auroral” observations on AD 1850 August 15 and AD 1885 December 26 are discussed in slightly more detail in Appendix B, which also includes a detailed discus-sion of the reasons for rejecting a potential Korean “auroral” observation on AD 1843 March 12.
It should be noted that the auroral catalogue published by the Beijing Observatory (1988) is divided into two parts: the second part is entitled “Not Definite Category”. Although not strictly germane to this paper, a similar statement applies to the sunspot catalogue published by the Beijing Observa-tory (1988). It appears that the compilers of the Beijing cat-alogues have put entries in the “not definite category” if: (i) the date is very general; (ii) the content of the record is clear; or (iii) the record is cited indirectly from some un-available or unidentifiable source. Moreover, in the specific case of auroral observations (ji guang), entries seem to be included in the “not definite category” if there is any uncer-tainty whatsoever about the identification of an auroral dis-play; for example, reference to a “black vapour like a rain-bow”, “glittering lights – like lightning” or a “dim light in the sky like a rainbow”. In this paper, all Chinese auroral records extracted from the “not definite category” are iden-tified by placing an asterisk after a chronological reference number (e.g. Ref. No. 01*), which is introduced later in this section.
The combined auroral catalogue that results from all these sources currently contains 1154 entries in the interval 210 BC–AD 1911 (although there are no exactly dated au-roral observations in 1910 and 1911). However, the associ-ated auroral database currently contains 1197 entries. The discrepancy between the number of entries in the catalogue and database arises partly from the fact that independent au-roral observations (e.g. from different countries) are always included as separate entries in the auroral database and partly from the avoidance of auroral date ranges. In particular, au-roral observations on consecutive days, which are sometimes included as a single entry in an auroral catalogue, are always included as separate entries in the auroral database. The pa-per by Willis et al. (2005) provides further details on the au-roral database. As in this earlier paper, the present study is
restricted to auroral records from East Asia for which the year, month and day are all specified exactly. This restric-tion is essential if meaningful comparisons are to be made with daily values of the Ak or aa index and also the dates on which great and small geomagnetic storms occurred. There-fore, imprecise records, with inexact dates for which no more than the lunar month is specified, are automatically excluded from this investigation (cf. Willis et al., 2005).
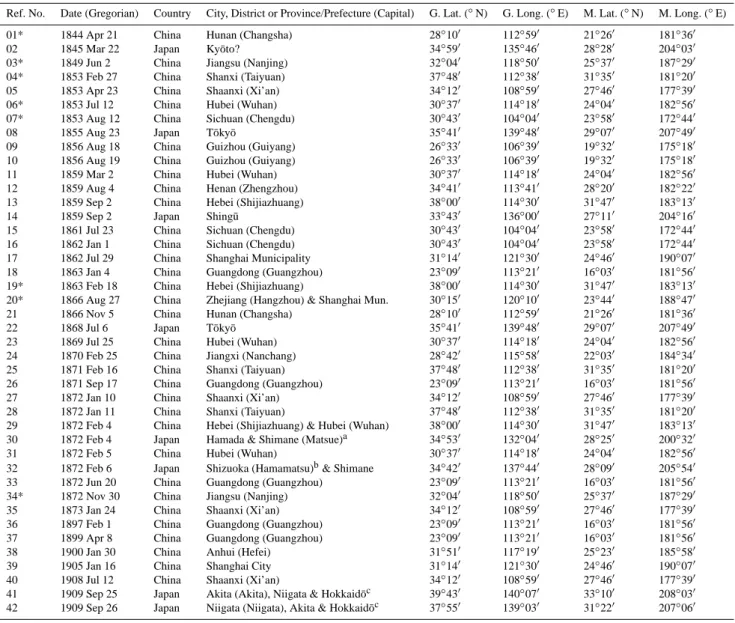
Table 1 lists all the accessible and exactly dated Chi-nese and JapaChi-nese auroral observations that occurred dur-ing the interval 1840–1911 (apart from the two rejected records – see Appendix B). To facilitate cross-referencing between the tables and the text, a chronological reference number (Ref. No.) is provided in the first column of each entry in Table 1. Subsequent columns give the exact Gre-gorian date (year, month, day) of each auroral observa-tion, as well as details of the place at which each obser-vation was made, namely the country, the city, district or province/prefecture (with the present-day capital in paren-theses), and the associated geographic and magnetic co-ordinates. All of the Chinese auroral observations presented in Table 1 and Appendix A have been gleaned from local histories or gazetteers. In most cases, only the provinces in which the observations were made have been recorded (see Appendix A). However, as investigation of reports of other celestial events – such as eclipses and meteors – clearly re-veals, local histories are concerned with specific provinces. Duplication between histories of separate provinces is ex-tremely rare. Hence it is appropriate to cite the geographic and magnetic co-ordinates of the relevant provincial capital – see Table 1. Although the provincial Chinese auroral ob-servations may have been made at unknown locations out-side the present-day capitals, the differences should amount to no more than a very few degrees in both latitude and longitude. Such differences are insignificant in this study. For the Japanese auroral observations, both specific locations and prefectures are quoted; the geographic and magnetic co-ordinates listed in Table 1 refer to the present-day capitals of the prefectures.
If an auroral display was observed from two or more lo-cations in the same country on the same night (e.g. Shang-hai Municipality & Zhejiang Province (China) in 1866; Hamada Town & Shimane Prefecture (Japan) in 1872), the co-ordinates listed apply to the first location specified in col-umn 4 of Table 1. However, in all cases the co-ordinates of the other locations are cited either elsewhere in Table 1 or in the accompanying footnotes.
The geographic co-ordinates of all locations have been ex-tracted from the Index in “The Times Comprehensive At-las of the World” (1999); moreover, the spelling of place names follows that used in this index (apart from Seoul). It is clear from the entries in Table 1 (including the footnotes) that the geographic latitudes of the locations at which auro-rae were observed in East Asia (i.e. the locations of the ob-servers) during the interval 1840–1911 vary between about
Table 1. Exactly dated Chinese and Japanese auroral observations recorded during the interval AD 1840–1911. After a chronological
reference number (Ref. No.), introduced to facilitate cross-referencing, the exact Gregorian date of each auroral observation is given, followed by the country and then the city, district or province/prefecture of the place of observation (see Appendix A for further details). An asterisk (*) qualifies the reference number if the associated Chinese auroral observation is from the “not definite category” (Beijing Observatory, 1988), rather than the “definite category”, as discussed in Sect. 2. If the auroral observation was made in a Chinese province or Japanese prefecture, the present-day capital of that province or prefecture is given in parentheses. Also listed are the geographic co-ordinates (G. Lat., G. Long.) and magnetic co-ordinates (M. Lat., M. Long.) of each location or present-day capital. If a Chinese or Japanese auroral display was observed from two or more locations on the same night (e.g. Zhejiang & Shanghai and Akita, Niigata & Hokkaid¯o), the geographic, and hence magnetic, co-ordinates apply to the first location (although the co-ordinates of the other locations usually appear elsewhere in this table; otherwise, they are given in the footnote). The magnetic co-ordinates are corrected geomagnetic co-ordinates for epoch AD 1900 (see Sect. 2).
Ref. No. Date (Gregorian) Country City, District or Province/Prefecture (Capital) G. Lat. (◦N) G. Long. (◦E) M. Lat. (◦N) M. Long. (◦E) 01* 1844 Apr 21 China Hunan (Changsha) 28◦10′ 112◦59′ 21◦26′ 181◦36′
02 1845 Mar 22 Japan Ky¯oto? 34◦59′ 135◦46′ 28◦28′ 204◦03′
03* 1849 Jun 2 China Jiangsu (Nanjing) 32◦04′ 118◦50′ 25◦37′ 187◦29′
04* 1853 Feb 27 China Shanxi (Taiyuan) 37◦48′ 112◦38′ 31◦35′ 181◦20′
05 1853 Apr 23 China Shaanxi (Xi’an) 34◦12′ 108◦59′ 27◦46′ 177◦39′
06* 1853 Jul 12 China Hubei (Wuhan) 30◦37′ 114◦18′ 24◦04′ 182◦56′
07* 1853 Aug 12 China Sichuan (Chengdu) 30◦43′ 104◦04′ 23◦58′ 172◦44′
08 1855 Aug 23 Japan T¯oky¯o 35◦41′ 139◦48′ 29◦07′ 207◦49′
09 1856 Aug 18 China Guizhou (Guiyang) 26◦33′ 106◦39′ 19◦32′ 175◦18′
10 1856 Aug 19 China Guizhou (Guiyang) 26◦33′ 106◦39′ 19◦32′ 175◦18′
11 1859 Mar 2 China Hubei (Wuhan) 30◦37′ 114◦18′ 24◦04′ 182◦56′ 12 1859 Aug 4 China Henan (Zhengzhou) 34◦41′ 113◦41′ 28◦20′ 182◦22′ 13 1859 Sep 2 China Hebei (Shijiazhuang) 38◦00′ 114◦30′ 31◦47′ 183◦13′
14 1859 Sep 2 Japan Shing¯u 33◦43′ 136◦00′ 27◦11′ 204◦16′
15 1861 Jul 23 China Sichuan (Chengdu) 30◦43′ 104◦04′ 23◦58′ 172◦44′ 16 1862 Jan 1 China Sichuan (Chengdu) 30◦43′ 104◦04′ 23◦58′ 172◦44′ 17 1862 Jul 29 China Shanghai Municipality 31◦14′ 121◦30′ 24◦46′ 190◦07′ 18 1863 Jan 4 China Guangdong (Guangzhou) 23◦09′ 113◦21′ 16◦03′ 181◦56′ 19* 1863 Feb 18 China Hebei (Shijiazhuang) 38◦00′ 114◦30′ 31◦47′ 183◦13′ 20* 1866 Aug 27 China Zhejiang (Hangzhou) & Shanghai Mun. 30◦15′ 120◦10′ 23◦44′ 188◦47′ 21 1866 Nov 5 China Hunan (Changsha) 28◦10′ 112◦59′ 21◦26′ 181◦36′
22 1868 Jul 6 Japan T¯oky¯o 35◦41′ 139◦48′ 29◦07′ 207◦49′
23 1869 Jul 25 China Hubei (Wuhan) 30◦37′ 114◦18′ 24◦04′ 182◦56′ 24 1870 Feb 25 China Jiangxi (Nanchang) 28◦42′ 115◦58′ 22◦03′ 184◦34′ 25 1871 Feb 16 China Shanxi (Taiyuan) 37◦48′ 112◦38′ 31◦35′ 181◦20′ 26 1871 Sep 17 China Guangdong (Guangzhou) 23◦09′ 113◦21′ 16◦03′ 181◦56′ 27 1872 Jan 10 China Shaanxi (Xi’an) 34◦12′ 108◦59′ 27◦46′ 177◦39′ 28 1872 Jan 11 China Shanxi (Taiyuan) 37◦48′ 112◦38′ 31◦35′ 181◦20′ 29 1872 Feb 4 China Hebei (Shijiazhuang) & Hubei (Wuhan) 38◦00′ 114◦30′ 31◦47′ 183◦13′ 30 1872 Feb 4 Japan Hamada & Shimane (Matsue)a 34◦53′ 132◦04′ 28◦25′ 200◦32′ 31 1872 Feb 5 China Hubei (Wuhan) 30◦37′ 114◦18′ 24◦04′ 182◦56′ 32 1872 Feb 6 Japan Shizuoka (Hamamatsu)b& Shimane 34◦42′ 137◦44′ 28◦09′ 205◦54′ 33 1872 Jun 20 China Guangdong (Guangzhou) 23◦09′ 113◦21′ 16◦03′ 181◦56′ 34* 1872 Nov 30 China Jiangsu (Nanjing) 32◦04′ 118◦50′ 25◦37′ 187◦29′ 35 1873 Jan 24 China Shaanxi (Xi’an) 34◦12′ 108◦59′ 27◦46′ 177◦39′ 36 1897 Feb 1 China Guangdong (Guangzhou) 23◦09′ 113◦21′ 16◦03′ 181◦56′ 37 1899 Apr 8 China Guangdong (Guangzhou) 23◦09′ 113◦21′ 16◦03′ 181◦56′ 38 1900 Jan 30 China Anhui (Hefei) 31◦51′ 117◦19′ 25◦23′ 185◦58′
39 1905 Jan 16 China Shanghai City 31◦14′ 121◦30′ 24◦46′ 190◦07′
40 1908 Jul 12 China Shaanxi (Xi’an) 34◦12′ 108◦59′ 27◦46′ 177◦39′
41 1909 Sep 25 Japan Akita (Akita), Niigata & Hokkaid¯oc 39◦43′ 140◦07′ 33◦10′ 208◦03′
42 1909 Sep 26 Japan Niigata (Niigata), Akita & Hokkaid¯oc 37◦55′ 139◦03′ 31◦22′ 207◦06′
Notes:aThe geographic and geomagnetic co-ordinates of Matsue, the present-day capital of the Shimane Prefecture, are 35◦28′N, 133◦03′E and 28◦59′N, 201◦28′E, respectively. bThe geographic and geomagnetic co-ordinates of Hamamatsu, which is in the western part of the Shizuoka Prefecture, are supposed to define the location of the last of the four Japanese auroral observations on this particular date (see Appendix A, Ref. No. 32, Record iv).cThe geographic and geomagnetic co-ordinates of Sapporo, the present-day capital of the Hokkaid¯o Prefecture, are 43◦04′N, 141◦20′E and 36◦31′N, 209◦02′E, respectively.
23◦N and 43◦N. The associated magnetic latitudes and
lon-gitudes are corrected geomagnetic co-ordinates at the Earth’s surface. These magnetic co-ordinates have been obtained us-ing the Geomagnetic Reference Field for Epoch AD 1900 (i.e. using DGRF/IGRF for 1900) in the Space Physics Data Facility/Modelweb software provided by the Goddard Space Flight Center (http://modelweb.gsfc.nasa.gov). In this study, it has been assumed that it is marginally preferable to include the higher harmonics of the geomagnetic reference field at a fixed epoch (AD 1900), rather than use just the dipole com-ponents at each of the actual times of the auroral observations in the interval 1840–1911. It is clear from Table 1 that the corrected geomagnetic latitudes of the locations at which au-rorae were observed in East Asia vary between about 16◦N and 37◦N.
The translations of the East Asian auroral records listed in Table 1 are presented in Appendix A, which provides a complete historical reference for all but one of these records. Most of these auroral records (some of which are rather terse and stereotyped by modern scientific standards) have not pre-viously been translated into English or any other Western language. However, the importance of the descriptions of the oriental displays is enhanced by the fact that the great majority of the records of sporadic auroral events listed by Silverman (2003) merely report an observation on a partic-ular date at a known location. The records included in the series entitled “Climatological Data of the United States” do not provide descriptions, although some descriptions may still exist in various national data archives in the United States. In Sect. 3.3, the descriptions of sporadic aurorae ob-served in East Asia are compared with the two descriptions of sporadic aurorae presented by Silverman (2003); namely the one from Grahamstown, South Africa, and the one from Charleston, South Carolina. In general, however, the infor-mation recorded in East Asian histories is inadequate to de-termine the height of the auroral display above the horizon (or even whether or not it was overhead).
3 Scientific interpretation of the observations
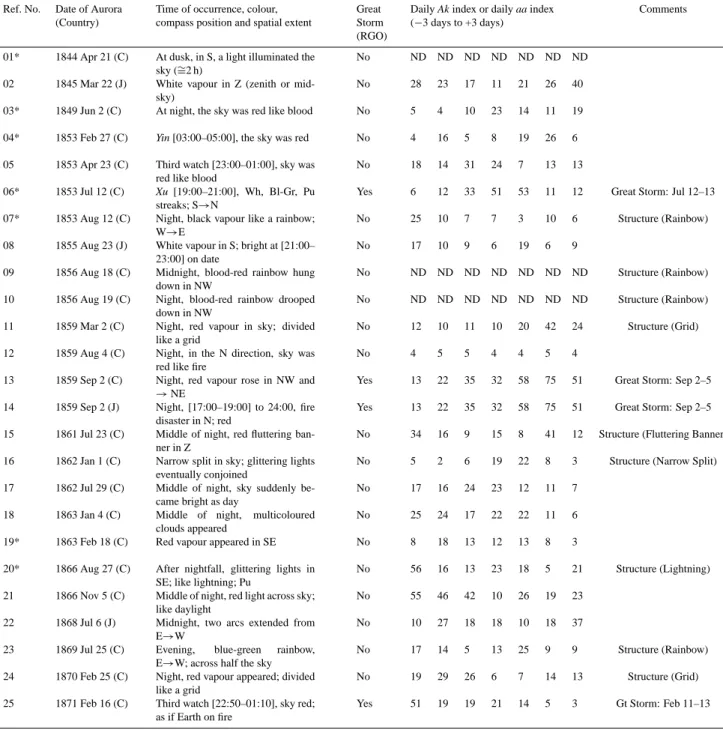
Table 2 contains a succinct summary of the scientific con-tent of each of the East Asian auroral records listed in Ta-ble 1. For completeness, the date of the oriental observation is repeated in Table 2 but the country of origin is now de-noted simply by a capital letter in parentheses (C = China, J = Japan). The time of occurrence, colour(s), compass posi-tion(s) and spatial extent(s) of each auroral observation have been extracted from the translations of the East Asian records presented in Appendix A. Table 2 also indicates whether or not (“Yes”, “No”) a great geomagnetic storm was in progress at the time of each auroral observation, according to the lists of geomagnetic storms (both great and small) published by the Royal Greenwich Observatory (1955). In addition, daily values of the Ak (Helsinki) magnetic index (before 1868) and
the aa magnetic index (from 1868) are presented for a seven-day interval centred on the seven-day (date) of the East Asian au-roral observation (Mayaud, 1973, 1980; Nevanlinna and Ke-tola, 1993; Nevanlinna et al., 1993; Nevanlinna and Kataja, 1993). To achieve consistency between the numerical accu-racies of the tabulated Ak and aa indices, daily values of the
aa index have been rounded to the nearest integer. The final
column of Table 2 (entitled “Comments”) serves to empha-sise the dates of both great and small geomagnetic storms and also those occasions when there was clearly defined spatial structure in the auroral display, as inferred from the descrip-tion in the auroral record (see Appendix A). For example, several records suggest structure by the use of terms such as “lightning” (dian), “rainbow” (hong), “streak” (dao) and “grid” (jing). (In one instance, the term “rainbow” is abbre-viated to R in Table 2.)
Detailed lists of both great and small geomagnetic storms (based on Greenwich data up to the end of 1925 and Abinger data since the beginning of 1926) are available for the inter-val 1874–1954 and a list of great geomagnetic storms (based on Greenwich data) is available for the earlier interval 1840– 1874 (Royal Greenwich Observatory, 1955). The lower limit of range for a great geomagnetic storm at Greenwich (or Abinger) was adopted as 60′ in declination (D) or 300 nT (γ ) in either the horizontal magnetic field (H ) or the verti-cal magnetic field (Z). For small geomagnetic storms, the lower limit for inclusion is 30′in D or 150 nT in H or in Z. In the published tables, the ranges are given to the nearest minute of arc in D and the nearest 5 nT in H and Z. (For completeness, it should be noted that the same limits apply to the period from 1916 to 1924 inclusive, when the north component of the geomagnetic field was recorded instead of the horizontal component.)
It is clear from Table 2 that about 25% of the East Asian auroral records refer to observations that occurred when a great geomagnetic storm was in progress (and hence invari-ably occurred under conditions of strong geomagnetic activ-ity), whereas about 75% of the records refer to auroral ob-servations that occurred when no great geomagnetic storm was in progress (and hence almost always occurred under conditions of weak-to-moderate geomagnetic activity). As noted in the Introduction, auroral observations coincident with great geomagnetic storms are retained in this study be-cause they confirm the general reliability of the East Asian auroral observations in the interval 1840–1911. The orien-tal auroral observations are discussed separately in the two following subsections (3.1 and 3.2) for conditions of strong and weak-to-moderate geomagnetic activity. The two sub-sequent subsections (3.3 and 3.4) discuss the evidence for spatial structure in the descriptions of sporadic aurorae and the reliability of the East Asian auroral observations.
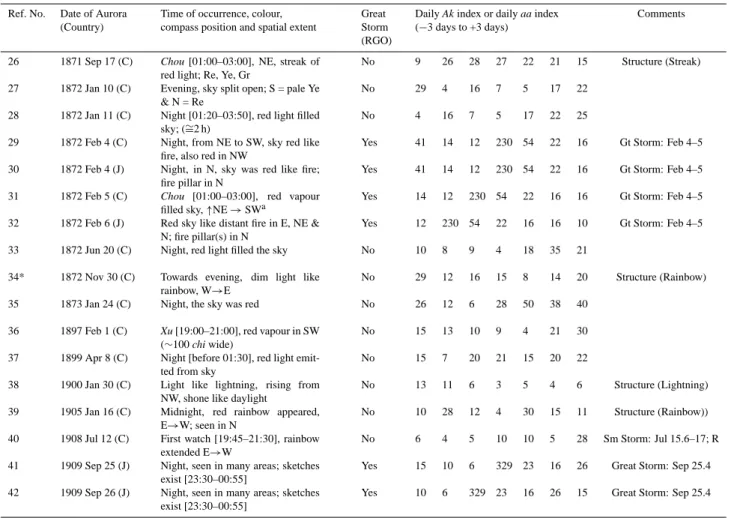
Table 2. Scientific attributes of exactly dated East Asian auroral observations in the interval AD 1840–1911. The chronological reference
number (Ref. No.) and associated date is exactly the same as in Table 1. For brevity, the country of origin of each observation is now denoted simply by a capital letter in parentheses (C = China, J = Japan). The scientific content of each oriental auroral observation is summarised briefly, with specific reference (whenever possible) to the time of occurrence, colour(s), compass position(s) and spatial extent (see Appendix A). The presence (“Yes”), or absence (“No”), of a great storm (RGO) implies inclusion in, or exclusion from, the lists of great geomagnetic storms compiled by the Royal Greenwich Observatory (1955). Daily values of the Ak index (before AD 1868) or the aa index (from AD 1868) are presented for a 7-day interval centred on the day of the oriental auroral observation (values of the aa index have been rounded to the nearest integer). In the “Comments” column, explicit reference is made to both great (Gt) and small (Sm) geomagnetic storms and also the existence of spatial structure in the auroral display, as inferred from the description recorded in the oriental history or gazetteer (see Appendix A).
Ref. No. Date of Aurora (Country)
Time of occurrence, colour, compass position and spatial extent
Great Storm (RGO)
Daily Ak index or daily aa index (−3 days to +3 days)
Comments
01* 1844 Apr 21 (C) At dusk, in S, a light illuminated the sky (∼=2 h)
No ND ND ND ND ND ND ND
02 1845 Mar 22 (J) White vapour in Z (zenith or mid-sky)
No 28 23 17 11 21 26 40
03* 1849 Jun 2 (C) At night, the sky was red like blood No 5 4 10 23 14 11 19 04* 1853 Feb 27 (C) Yin [03:00–05:00], the sky was red No 4 16 5 8 19 26 6 05 1853 Apr 23 (C) Third watch [23:00–01:00], sky was
red like blood
No 18 14 31 24 7 13 13
06* 1853 Jul 12 (C) Xu [19:00–21:00], Wh, Bl-Gr, Pu streaks; S→N
Yes 6 12 33 51 53 11 12 Great Storm: Jul 12–13 07* 1853 Aug 12 (C) Night, black vapour like a rainbow;
W→E
No 25 10 7 7 3 10 6 Structure (Rainbow) 08 1855 Aug 23 (J) White vapour in S; bright at [21:00–
23:00] on date
No 17 10 9 6 19 6 9
09 1856 Aug 18 (C) Midnight, blood-red rainbow hung down in NW
No ND ND ND ND ND ND ND Structure (Rainbow) 10 1856 Aug 19 (C) Night, blood-red rainbow drooped
down in NW
No ND ND ND ND ND ND ND Structure (Rainbow) 11 1859 Mar 2 (C) Night, red vapour in sky; divided
like a grid
No 12 10 11 10 20 42 24 Structure (Grid) 12 1859 Aug 4 (C) Night, in the N direction, sky was
red like fire
No 4 5 5 4 4 5 4
13 1859 Sep 2 (C) Night, red vapour rose in NW and
→NE
Yes 13 22 35 32 58 75 51 Great Storm: Sep 2–5 14 1859 Sep 2 (J) Night, [17:00–19:00] to 24:00, fire
disaster in N; red
Yes 13 22 35 32 58 75 51 Great Storm: Sep 2–5 15 1861 Jul 23 (C) Middle of night, red fluttering
ban-ner in Z
No 34 16 9 15 8 41 12 Structure (Fluttering Banner) 16 1862 Jan 1 (C) Narrow split in sky; glittering lights
eventually conjoined
No 5 2 6 19 22 8 3 Structure (Narrow Split) 17 1862 Jul 29 (C) Middle of night, sky suddenly
be-came bright as day
No 17 16 24 23 12 11 7
18 1863 Jan 4 (C) Middle of night, multicoloured clouds appeared
No 25 24 17 22 22 11 6
19* 1863 Feb 18 (C) Red vapour appeared in SE No 8 18 13 12 13 8 3 20* 1866 Aug 27 (C) After nightfall, glittering lights in
SE; like lightning; Pu
No 56 16 13 23 18 5 21 Structure (Lightning) 21 1866 Nov 5 (C) Middle of night, red light across sky;
like daylight
No 55 46 42 10 26 19 23
22 1868 Jul 6 (J) Midnight, two arcs extended from E→W
No 10 27 18 18 10 18 37
23 1869 Jul 25 (C) Evening, blue-green rainbow, E→W; across half the sky
No 17 14 5 13 25 9 9 Structure (Rainbow) 24 1870 Feb 25 (C) Night, red vapour appeared; divided
like a grid
No 19 29 26 6 7 14 13 Structure (Grid) 25 1871 Feb 16 (C) Third watch [22:50–01:10], sky red;
as if Earth on fire
Table 2. Continued.
Ref. No. Date of Aurora (Country)
Time of occurrence, colour, compass position and spatial extent
Great Storm (RGO)
Daily Ak index or daily aa index (−3 days to +3 days)
Comments
26 1871 Sep 17 (C) Chou [01:00–03:00], NE, streak of red light; Re, Ye, Gr
No 9 26 28 27 22 21 15 Structure (Streak) 27 1872 Jan 10 (C) Evening, sky split open; S = pale Ye
& N = Re
No 29 4 16 7 5 17 22
28 1872 Jan 11 (C) Night [01:20–03:50], red light filled sky; (∼=2 h)
No 4 16 7 5 17 22 25
29 1872 Feb 4 (C) Night, from NE to SW, sky red like fire, also red in NW
Yes 41 14 12 230 54 22 16 Gt Storm: Feb 4–5 30 1872 Feb 4 (J) Night, in N, sky was red like fire;
fire pillar in N
Yes 41 14 12 230 54 22 16 Gt Storm: Feb 4–5 31 1872 Feb 5 (C) Chou [01:00–03:00], red vapour
filled sky, ↑NE → SWa
Yes 14 12 230 54 22 16 16 Gt Storm: Feb 4–5 32 1872 Feb 6 (J) Red sky like distant fire in E, NE &
N; fire pillar(s) in N
Yes 12 230 54 22 16 16 10 Gt Storm: Feb 4–5 33 1872 Jun 20 (C) Night, red light filled the sky No 10 8 9 4 18 35 21
34* 1872 Nov 30 (C) Towards evening, dim light like rainbow, W→E
No 29 12 16 15 8 14 20 Structure (Rainbow) 35 1873 Jan 24 (C) Night, the sky was red No 26 12 6 28 50 38 40
36 1897 Feb 1 (C) Xu [19:00–21:00], red vapour in SW (∼100 chi wide)
No 15 13 10 9 4 21 30
37 1899 Apr 8 (C) Night [before 01:30], red light emit-ted from sky
No 15 7 20 21 15 20 22
38 1900 Jan 30 (C) Light like lightning, rising from NW, shone like daylight
No 13 11 6 3 5 4 6 Structure (Lightning) 39 1905 Jan 16 (C) Midnight, red rainbow appeared,
E→W; seen in N
No 10 28 12 4 30 15 11 Structure (Rainbow)) 40 1908 Jul 12 (C) First watch [19:45–21:30], rainbow
extended E→W
No 6 4 5 10 10 5 28 Sm Storm: Jul 15.6–17; R 41 1909 Sep 25 (J) Night, seen in many areas; sketches
exist [23:30–00:55]
Yes 15 10 6 329 23 16 26 Great Storm: Sep 25.4 42 1909 Sep 26 (J) Night, seen in many areas; sketches
exist [23:30–00:55]
Yes 10 6 329 23 16 26 15 Great Storm: Sep 25.4
Definitions: All quoted times and time intervals (e.g. Yin [04:00–05:00]) are expressed in local time (LT); N, NE, E, SE, S, SW, W, NW denote points of the compass; Z denotes the zenith; ↑ indicates “upwards” and → indicates “extension” (usually from one compass point to another); the abbreviations Bl = Blue, Gr = Green, Pu = Purple, Re = Red, Wh = White, Ye = Yellow are used to specify the colours of auroral displays;aRef. No. 31 also states “within the cloud there was one star like a bowl; its colour was blue”; ND signifies that no data (Ak) exist for that particular day; R = Rainbow (which necessarily implies “Structure” when used alone for brevity, as in the case of the Chinese auroral observation on AD 1908 July 12).
3.1 East Asian auroral observations during great geomag-netic storms
The entries in the final column of Table 2 indicate that two of the greatest geomagnetic storms of the nineteenth century, namely those on 1859 September 2–5 (Ref. Nos. 13 and 14) and 1872 February 4–5 (Ref. Nos. 29–32), are identified by auroral observations from both China and Japan. The date ranges of these two great geomagnetic storms (and other storms cited in Table 2) are taken directly from the lists of great and small storms recorded at Greenwich (Royal Green-wich Observatory, 1955). Moreover, the second of these two storms is associated with auroral observations in China on the nights of February 4 and 5 (Ref. Nos. 29 and 31) and au-roral observations in Japan on the nights of February 4 and 6 (Ref. Nos. 30 and 32). The daily values of the Ak (Helsinki)
magnetic index for the seven-day interval centred on the great geomagnetic storm of 1859 September 2 are as follows: 13, 22, 35, 32, 58, 75, 51 (although it seems likely that these values of the Ak index underestimate the true strength of this great geomagnetic storm). Likewise, the daily values of the
aa magnetic index for the seven-day interval centred on the
great geomagnetic storm of 1872 February 4 are as follows (to the nearest integer value): 41, 14, 12, 230, 54, 22, 16. The great geomagnetic storm of 1853 July 12–13 is identified by an auroral observation from China on July 12 (Ref. No. 06*). The values of the Ak index for the seven-day interval cen-tred on July 12 are as follows: 6, 12, 33, 51, 53, 11, 12. It is also just possible that the great geomagnetic storm of 1871 February 11–13 is associated with an auroral observa-tion from China on February 16 (Ref. No. 25). The values of the aa index for the seven-day interval centred on February
16 are as follows: 51, 19, 19, 21, 14, 5, 3; the corresponding values on the two previous days – February 11 and February 12 – are 50 and 158, respectively.
Similarly, one of the great geomagnetic storms of the first decade of the twentieth century, namely that on 1909 September 25.4, is identified by auroral observations from Japan on the nights of both September 25 and 26 (Ref. Nos. 41 and 42). More extensive low-latitude auro-ral observations associated with this great geomagnetic storm have been compiled and discussed by Silverman (1995). The daily values of the aa index for the seven-day interval cen-tred on September 25 are as follows: 15, 10, 6, 329, 23, 16, 26. Conversely, the small geomagnetic storm on 1908 July 15.6–17 is most unlikely to be associated with the Chinese auroral observation on July 12 (Ref. No. 40) because in this case the auroral observation preceded the geomagnetic storm by three days.
Of course, there is no exact one-to-one correspondence between the great geomagnetic storms included in the lists compiled by the Royal Greenwich Observatory (1955) and auroral observations recorded in East Asia. Many potential auroral observations must have been missed as a result of extensive cloud cover (or other adverse viewing conditions), whereas the Royal Greenwich Observatory (RGO) lists of geomagnetic storms are based on magnetic measurements that are largely unaffected by the concurrent meteorological conditions. In particular, the RGO lists include 101 great geomagnetic storms in the interval 1840–1911 but only 5 of these storms appear in Table 2. The likely effects of cloud cover over East Asia can be estimated approximately by ex-amining the global cloud cover maps that have been con-structed using data acquired during the International Satellite Cloud Climatology Project (ISCCP). Since 1983, as part of ISCCP, visible and infrared images from polar orbiting and geostationary meteorological satellites have been processed to produce monthly data sets of global cloud cover and ra-diative properties (see, for example, http://www.gewex.org/ isccp.html). The maps of mean annual cloud amount indi-cate that the frequency of occurrence of cloudy conditions over East Asia in the interval 1983 (July) – 2005 (June) lies in the approximate range 50–80%. Therefore, cloud cover can probably account for the fact that some of the great geo-magnetic storms recorded at Greenwich in the interval 1840– 1911 were not accompanied by auroral observations in East Asia. However, this provisional estimate of cloud cover over East Asia requires considerable further refinement within the context of auroral physics. For example, extensive auroral displays can be seen in the gaps between clouds (which may be less than the pixel size of the satellite images) and it also seems most unlikely that such displays would be completely obscured by thin cirrus cloud (which implies that cloud type is also an important factor). Despite these “meteorologi-cal” complications, the oriental auroral observations that are available correctly identify some of the really great geomag-netic storms that occurred during the second half of the
nine-teenth century and the first decade of the twentieth century. An extremely important feature of the East Asian auro-ral observations is that brief descriptions of the auroauro-ral dis-plays have been recorded in the various histories. Although these descriptions are usually tantalisingly terse and some-what stereotyped if judged by modern scientific standards, as noted in Sect. 2 they often provide some basic physical information on the structure of auroral displays observed un-der conditions of both strong and weak-to-moun-derate geomag-netic activity. Many of the auroral observations listed in Ta-ble 2 merely state that “the sky was red”, or refer to a “red light” or a “red vapour” in the sky. Sometimes the colour “red” is qualified by such commonplace terms as “blood” or “fire”. As is also clear from Table 2, the reference to a red sky is used for auroral displays that occur under conditions of both strong and weak-to-moderate geomagnetic activity. However, in the case of great geomagnetic storms, there is usually some mention of the large extent of the sky covered by the “red light” or “red vapour”, often by reference to more than one point of the compass (Ref. Nos. 13, 14, 25, 29–32). More detailed information is available for the great geo-magnetic storm on 1853 July 12–13 (Ref. No. 06*), which is associated with one of the Chinese auroral observations somewhat surprisingly included in the “not definite category” (Beijing Observatory, 1988). For this particular storm, the description (see Appendix A) refers to “two streaks of white vapour”; the centre being “blue-green” while the lower part was “purple”. One streak was “long” and the other was “short”. The description also states that the streaks had “the form of a roll of silk gauze reaching straight to the zenith” and notes further that the aurora extended “from the S to the N, gradually twisting to the W and disappearing”. The level of detail provided in this particular auroral description is essentially comparable with that available from many con-temporaneous European and North American auroral obser-vations (e.g. Fritz, 1873; Loomis, 1859–1861; Silverman, 2006).
Although the descriptions of East Asian auroral observa-tions during great geomagnetic storms usually indicate that the auroral display covered a large region of the sky, the de-scriptions of several of the East Asian sporadic auroral obser-vations during weak-to-moderate geomagnetic activity sug-gest auroral structure over a more localised region of the sky, as discussed in the following subsection.
3.2 East Asian observations of sporadic aurorae
The detailed entries in Table 2 indicate that many of the East Asian auroral observations in the interval 1840–1911 occurred under conditions of weak-to-moderate geomagnetic activity. This conclusion is confirmed by relatively small val-ues of the magnetic indices, Ak or aa, defined by Nevanlinna and Kataja (1993) and Mayaud (1980), respectively, or by the absence of a great geomagnetic storm (“No” in column 4 of Table 2) according to the lists of great geomagnetic storms
compiled by the Royal Greenwich Observatory (1955). No values of the magnetic index Ak are available (ND) for three of the 42 auroral observations listed in Table 2 (i.e. Ref. Nos. 01*, 09 and 10). It then follows from column 4 of this table that 29 (=74%) of the 39 East Asian auroral ob-servations for which magnetic indices are available occurred at times when no great geomagnetic storm was in progress. Moreover, the daily magnetic index, Ak or aa, was ≤50 throughout a five-day interval centred on the date of each of these 29 observations (including the auroral observation that occurred three days before the small geomagnetic storm on 1908 July 15.6–17). For a centred seven-day interval (as used in Sect. 3.1), the daily value of Ak or aa slightly ex-ceeded 50 for just two of the 203 daily observations (Ak=56 for Ref. No. 20* and Ak=55 for Ref. No. 21). On both oc-casions, however, this excess occurred three days before the day (night) of the auroral observation (i.e. on Day – 3) and represented the nearest local maximum in the value of Ak im-mediately before the date of the auroral observation. For 12 (=31%) of the 39 auroral observations for which daily mag-netic indices are available, Ak or aa≤25 throughout a seven-day interval centred on the date of the auroral observation (Ref. Nos. 03*, 07*, 08, 12, 16, 17, 18, 19*, 23, 28, 37, 38). For comparison, 10 (=26%) of the 39 auroral observations (for which magnetic indices are available) occurred at times when a great geomagnetic storm was in progress, although these particular auroral observations correspond to just 5 dis-tinct geomagnetic storms.
For the Chinese auroral observation on 1859 August 4 (Ref. No. 12), Ak≤5 throughout the seven-day interval cen-tred on this date. Although it would be natural to question the reliability of any low-latitude auroral observation under such extremely weak, or quiet, geomagnetic conditions, it should be noted that the auroral observation on 1859 August 4 occurred 29 days before the commencement of the great geomagnetic storm on 1859 September 2–5. Actually, dual storms commenced on August 28 and September 2, both of which were accompanied by brilliant auroral displays seen from many parts of the world (Royal Greenwich Observa-tory, 1955; Silverman, 2006). Therefore, the auroral obser-vation on August 4 occurred about one (mean) synodic-solar-rotation period (27 days) before the dual storms on August 28 and September 2. The implication of this time sequence of events is that recurrent solar activity probably existed at this time, despite the apparently quiet geomagnetic conditions. In this same context, it should be noted that the Chinese auroral observations on 1853 February 27 (Ref. No. 04*) and 1853 April 23 (Ref. No. 05) occurred 135 (=5×27) days and 80 (=3×27–1) days, respectively, before the Chinese auroral ob-servation on 1853 July 12 (Ref. No. 06*), which was the date of another great geomagnetic storm (1853 July 12–13). Like-wise, it should be noted that the Chinese auroral observation on 1853 August 12 (Ref. No. 07*) occurred 30/31 days after this great geomagnetic storm. On all three days (apart from 1853 July 12), Ak≤31 throughout a seven-day interval
cen-tred on each of these dates. These Chinese auroral observa-tions provide evidence for recurrent, albeit intermittent, auro-ral activity, on a timescale almost exactly equal to the mean synodic-solar-rotation period, before the great geomagnetic storm on 1853 July 12–13. Extensive cloud cover may have prevented a complete sequence of auroral observations sepa-rated by approximately 27 days. Finally, the Chinese auroral observations on 1872 January 10 and 11 (Ref. Nos. 27 and 28) occurred 25 days before the Chinese and Japanese auro-ral observations (Ref. Nos. 29–32) associated with the great geomagnetic storm on 1872 February 4–5.
It should be emphasised that some caution must be exer-cised when making comparisons between the magnetic in-dex Ak (Nevanlinna and Kataja, 1993), which is based en-tirely on magnetic measurements at Helsinki, and unaided-eye auroral observations recorded in Chinese and Japanese histories. The difference in local time (LT) between North-ern Europe and East Asia (ranging from about 5–9 h) may be significant for all but the most intense geomagnetic storms. Indeed, owing to the local-time variation of magnetic distur-bances at Helsinki, the daily values of the Ak index cannot be compared with the daily values of the aa index (Nevanlinna and Kataja, 1993). In addition, as noted in Sect. 3.1, the Ak index probably underestimates the true strength of even the great geomagnetic storm on 1859 September 2. Obviously, a similar cautionary remark applies to comparisons between magnetic measurements at Greenwich and auroral observa-tions in East Asia. The magnetic index aa (Mayaud, 1980), which is based on magnetic measurements at one observa-tory in England and one in Australia, is perhaps marginally better, if only because the magnetic observatory in Australia (Melbourne; geographic co-ordinates 37◦49′S, 144◦59′E) is at approximately the same geographic longitude (and hence LT) as the locations of the East Asian auroral observations (see Table 1). Nevertheless, the magnetic indices Ak and
aa are not necessarily ideal for identifying magnetic
distur-bances that might be associated with sporadic aurorae in East Asia. In a similar vein, Kamide (2006) has noted that it is misleading to use the Dstmagnetic index to define how much
the entire solar-terrestrial system is disturbed.
3.3 Evidence for spatial structure in descriptions of spo-radic aurorae
Several of the descriptions of auroral observations included in Table 2 imply that structure was noted in the auroral lumi-nosity. As noted previously, such structure is suggested by use of the terms “lightning”, “rainbow”, “streak” or “grid” (Ref. Nos. 06*, 07*, 09, 10, 11, 20*, 23, 24, 26, 34*, 38, 39, 40). Other terms, like “fluttering banner” and “glitter-ing lights”, are much more problematic and could easily in-dicate temporal rather than spatial variations (Ref. Nos. 15, 16). One auroral observation (Ref. No. 20*) uses the terms “glittering lights” and “lightning”, which may signify the concurrent existence of both spatial structure and temporal
variations. Conversely, some of the descriptions of auroral observations made under weak-to-moderate geomagnetic ac-tivity (aa≤50) suggest that essentially uniform auroral lumi-nosity covered a substantial region of the sky (Ref. Nos. 02, 03*, 04*, 05, 08, 12, 17, 19*, 27, 28, 33, 35, 36, 37), as in the case of great geomagnetic storms (Sect. 3.1). In this context, it should perhaps just be mentioned that the Chi-nese auroral observation on 1862 July 29 (Ref. No. 17) oc-curred six days before the great geomagnetic storm of Au-gust 4–5. Since different types of aurorae appear to occur under weak-to-moderate geomagnetic activity, it is difficult to offer a unique physical explanation. However, the use of the terms “lightning”, “rainbow” or “streak” in some East Asian auroral records may signify a single ray of light in a sky otherwise seemingly clear of auroral luminosity, in ac-cord with the definition of sporadic aurorae propounded by Botley (1963) and quoted by Silverman (2003). Moreover, the term “rainbow” probably implies both shape and colour and, as intimated previously, there is some evidence that the term “lightning” is used to emphasise the flickering nature of the light (Ref. No. 20*).
The detailed descriptions of the East Asian auroral ob-servations presented in Appendix A, which are summarised succinctly in Table 2 (column 3), show some similarities to the descriptions of sporadic aurorae quoted by Silverman (2003). For example, the description of the aurora australis observed on 1894 July 9 (Eddie, 1894), from Grahamstown, South Africa, states that the display lasted from 21:15 LT to 23:15 LT (i.e. 2 h). Despite bright moonlight (Moon at first quarter), this auroral display “manifested itself in a pale greenish white light extending around the south-eastern and southern horizon, and by broad streamers of a lovely roseate hue, which fitfully ebbed and flowed as they extended up-wards from the south-east, at times right up to the zenith . . . ” Likewise, the aurora borealis observed on 1895 August 26 (Abbe, 1895), from Charleston, South Carolina, lasted from 22:47 LT to 22:58 LT (i.e. about 10 min) and extended ap-proximately from the NW to the N. As noted in the descrip-tion, “a dark segment or arch rose to 17◦, with a crown of light to 24◦, one large streamer lasting from 22:51 LT to 22:53 LT (i.e. 2 min); azimuth 116◦ to 122◦ (measured in the sense S→W→N→E), and altitude 30◦.” This record also states “the display was accompanied by a thin veil of vapour, through which the stars could be seen.” No detailed description is available for the display of the aurora bore-alis observed on 1876 May 20 (Fritz, 1873; Botley, 1963), from Canea, Crete (Chania, Kriti; geographic co-ordinates 35◦30′N, 24◦02′E).
It is evident from the preceding descriptions that sporadic aurorae can last from several minutes to several hours. Al-though none of the East Asian auroral observations unam-biguously implies a time interval as short as a few minutes, some of these observations suggest that the auroral display lasts for about one or two hours (Ref. Nos. 01*, 04*, 05, 25, 26, 36, 40). The descriptions of the auroral displays observed
from Charleston and Grahamstown both refer to “streamers”. Although the observation from Grahamstown actually refers to “broad streamers”, there is a clear intimation of elongated rays (or streamers) in both cases. More specifically, the ob-servation from Charleston suggests that one large streamer extended 6◦ in azimuth and about 30◦ in altitude, whereas the observation from Grahamstown suggests that the broad streamers extended over several multiples of 10◦in altitude (since at times they reached up to the zenith). This is in gen-eral agreement with the use of the terms “lightning”, “rain-bow” and “streak” in the East Asian auroral observations. Two of the East Asian auroral observations mention explic-itly that the displays were either several tens of zhang (i.e. very many degrees) long, or several tens of zhang long and several chi (degrees) wide (see Ref. Nos. 07* and 16 in Ap-pendix A).
None of the dates of the auroral observations from East Asia (1840–1911) in the absence of a great geomagnetic storm (“No” in column 4 of Table 2) coincides with the date of a sporadic aurora observed in the United States (1880– 1940), as tabulated by Silverman (2003; see his Tables 1 and 2). A similar statement applies if the relevant East Asian auroral observations are compared with the sporadic aurorae observed from Canea, Crete, on AD 1876 May 20 (Botley, 1963) and from Grahamstown, South Africa, on 1894 July 9 (Eddie, 1894). The lack of any coincidences between East Asian auroral observations in the absence of a great geomag-netic storm and sporadic aurorae observed elsewhere in the world provides some, albeit limited, evidence for the truly localised nature of such auroral displays, although it should be emphasised that the East Asian observations were by no means systematic.
3.4 Reliability of the East Asian auroral observations In the preceding discussion, it has been tacitly assumed that the East Asian auroral records listed in Tables 1 and 2 and presented in Appendix A are all equally reliable observa-tions of the aurora borealis. Clearly, this assumption is not necessarily true. For example, the Japanese auroral obser-vation on 1845 March 22 (Ref. No. 02) refers to a “white vapour” without stating explicitly that the observation was made during the night. In principle, it is at least possible that such a “white vapour” could have been seen during the daytime. Similarly, the detailed record of the Chinese au-roral observation on 1862 January 1 (Ref. No. 16) does not state explicitly that the phenomenon was observed during the night, although judging from the description such an assump-tion seems entirely reasonable in this particular case. Like-wise, the record of the Chinese auroral observation on 1863 February 18 (Ref. No. 19*) does not state explicitly that the phenomenon occurred at night, although the reference to a “red vapour” strongly supports the interpretation of the phe-nomenon as an auroral display.
Conversely, the record of the Chinese auroral observa-tion on 1853 April 23 (Ref. No. 05) states: “At the third watch of the night [23:00–01:00 LT], the sky was red like blood.” In this instance, there is specific reference to the au-roral display occurring at a particular time during the night, while the colour “red” is the one most commonly associated with low-latitude aurorae. It is known from modern obser-vations that low-latitude aurorae are predominantly “red” in colour because they are typically characterised by: (i) N+21N (427.8 nm) emission at high vibrational levels and (ii) a high (>10) ratio of red (630.0 nm) to green (557.7 nm) atomic oxygen lines. An aurora of the second type sometimes pro-duces intense visible emissions, which result in a spectacular red aurora in the night sky (Tinsley et al., 1984; Davis, 1992; Shiokawa et al., 2005). Other historical auroral records from East Asia are slightly more ambiguous. The record of the Chinese auroral observation on 1853 August 12 (Ref. No. 07*) indicates that the phenomenon was observed at night but states enigmatically: “there was a black (hei) vapour like a rainbow; it extended from the west to the east, several tens of zhang (i.e. very many degrees) in length.” Regrettably, this Chinese record contains inadequate information for a com-pletely reliable scientific interpretation, although it is tempt-ing to speculate that this might be a genuine historical ob-servation of a “black” aurora. A “black” aurora is a lack of auroral emission in a small, well-defined region (e.g. a bean-shaped pod or a thin arc-like feature) within an otherwise uniform, diffuse background or within an aurora exhibiting a type of behaviour intermediate between that of “diffuse” au-rora and “discrete” auau-rora (Davis, 1978, 1992; Newell et al., 2001).
In this context, however, it should be noted that all of the auroral observations which are clearly associated with great geomagnetic storms (Ref. Nos. 06*, 13, 14, 25, 29– 32, 41 and 42) state explicitly that the observation was made during the “night” and all but two of these observations (Ref. Nos. 41 and 42) refer specifically either to the colour “red” or to a colour that is neither “white” nor “black” (see Ref. No. 06*). The Chinese record of the auroral observation on 1908 July 12 (Ref. No. 40), which occurred three days before a small (probably independent) geomagnetic storm (Royal Greenwich Observatory, 1955), notes that at the first watch of the night (19:45–21:30 LT) a rainbow extended from east to west and that after a while it began to disappear. This description is quite compatible with the occurrence of an auroral display and the use of the term “rainbow” sug-gests that the spatial extent of the auroral display is limited, which is consistent with the occurrence of a sporadic auroral observation.
In the case of the sporadic auroral observations from East Asia, the Chinese records for 1849 June 2, 1853 February 27, 1853 April 23, 1856 August 18, 1856 August 19, 1859 March 2, 1859 August 4, 1861 July 23, 1866 November 5, 1870 February 25, 1871 September 17, 1872 January 11, 1872 June 20, 1873 January 24, 1897 February 1, 1899 April
8 and 1905 January 16 (Ref. Nos. 03*, 04*, 05, 09, 10, 11, 12, 15, 21, 24, 26, 28, 33, 35, 36, 37 and 39) all state ex-plicitly that the observation was made at “night” and refer to the colour “red”. The Chinese record for 1872 January 10 (Ref. No. 27) indicates that the observation was made dur-ing the “evendur-ing” and refers to the colours “red” (in the N) and “pale yellow” (in the S). All of these 18 Chinese records appear to be quite genuine observations of the aurora bo-realis, which implies that at least 18 (=43%) of the 42 au-roral records from East Asia in the interval 1840–1911 de-scribe sporadic auroral observations, in the sense that they are definitely not associated with one of the great geomag-netic storms included in the lists compiled by the Royal Greenwich Observatory (1955).
The Chinese record for 1863 January 4 (Ref. No. 18) states that “multicoloured clouds” appeared in the middle of the night and there seems little doubt that this is a reference to the aurora borealis. The Chinese record for 1869 July 25 (Ref. No. 23) refers to a “blue-green rainbow” extending across half the sky (E to W) in the evening, which could also be a genuine observation of the aurora borealis. The Chinese record for 1908 July 12 (Ref. No. 40) notes that at the first watch (19:45–21:30 LT) a “rainbow” extended from east to west, which could again be a genuine observation of the au-rora borealis (three days before the small geomagnetic storm on July 15.6–17). If these three additional Chinese records are accepted as being authentic observations of the aurora bo-realis not associated with a great geomagnetic storm, then 21 (=50%) of the 42 auroral records from East Asia in the inter-val 1840–1911 refer to sporadic auroral observations. Con-versely, only 10 (=24%) of the 42 auroral observations from East Asia in this interval are definitely associated with great geomagnetic storms.
The six Chinese observations on 1844 April 21, 1853 Au-gust 12, 1862 July 29, 1866 AuAu-gust 27, 1872 November 30 and 1900 January 30 (Ref. Nos. 01*, 07*, 17, 20*, 34* and 38) and the Japanese observation on 1855 August 23 (Ref. No. 08) either refer explicitly to the “dusk”, “evening”, “night” or else imply a night-time observation by use of the phrase “shone like daylight” (Ref. No. 38). Moreover, the wording used to describe each of these seven observations is largely compatible with the occurrence of an auroral dis-play. The Japanese record for 1868 July 6 (Ref. No. 22) indi-cates that at midnight two arcs extended across the sky from east to west (Matsushita, 1956), which could be a genuine observation of the aurora borealis, despite the fact that Mat-sushita classified this observation as being “unlikely”. Fu-ture identification of the original text may eventually clarify this matter (see Appendix A). If these eight additional obser-vations are regarded as being authentic obserobser-vations of the aurora borealis that are not associated with a great geomag-netic storm, then 29 (=69%) of the 42 auroral records from East Asia in the interval 1840–1911 refer to sporadic auroral observations.
It is now necessary to consider the three remaining ob-servations. The Japanese observation on 1845 March 22 (Ref. No. 02) merely refers to a white vapour seen in the zenith (i.e. in mid-sky) at an unspecified time. The Chi-nese observation on 1862 January 1 (Ref. No. 16) refers to a split in the sky several tens of zhang (i.e. very many deg) in length and several chi (deg) in width and also glittering lights that eventually conjoined. This observation is not specifically stated to have occurred during the night, as noted previously, although in this particular case it is a reasonable inference. The Chinese observation on 1863 February 18 (Ref. No. 19*) simply states that a red vapour appeared at the SE. As also noted previously, there is again no mention of night but ref-erence to the colour “red” suggests an auroral display. If these three further observations are provisionally accepted as genuine observations of the aurora borealis that are not asso-ciated with a great geomagnetic storm, then 32 (=76%) of the 42 auroral records from East Asia in the interval 1840–1911 apparently refer to sporadic auroral observations.
Finally, a comment should perhaps be made on the rela-tive merits of the East Asian auroral observations discussed in this paper and the observations from (mainly) the United States discussed in the paper by Silverman (2003). The avail-able Chinese records of atmospheric phenomena during the period in question are virtually all from local histories. Un-like the reports in the astronomical treatises of the official histories, they are thus not based on systematic observation and their inclusion in local histories will to some extent re-flect the interests of the compilers. However, it should be emphasised that the goal of this paper is to investigate auro-rae that were observed in East Asia. This is a unique region with an unparalleled history of auroral (and other) observa-tions extending back over two millennia. Moreover, as noted previously, although the auroral observations from East Asia (1840–1911) might initially be considered to be intrinsically less reliable than the more recent auroral observations from the United States (1880–1940), they have the added advan-tage that descriptions of the auroral displays are immediately available (see Appendix A), contrary to the situation for the great majority of the American observations of sporadic au-rorae (Silverman, 2003).
4 Discussion and conclusions
The main purpose of this paper is to point out that a signifi-cant number of the auroral observations recorded in Chinese and Japanese histories during the interval AD 1840–1911 provide evidence for the occurrence of so-called “sporadic aurorae” in East Asia. This investigation therefore extends the work of Silverman (2003), who tabulated about 54 cases of such sporadic auroral occurrence from elsewhere in the world. Apart from one observation (Eddie, 1894) from Gra-hamstown, South Africa, all his examples of sporadic auroral occurrence are from the United States. The salient features of “sporadic” auroral observations are that they occur at
rela-tively low latitudes (approximately, −45◦≤geomagnetic
lat-itude ≤+45◦)during periods of weak-to-moderate
geomag-netic activity (aa or Ak≤50). Moreover, as observed from the surface of the Earth, they sometimes appear to be spa-tially localised in the night sky.
Table 1 lists all the accessible, exactly dated and reliable East Asian auroral observations in the interval AD 1840– 1911, which have been extracted from the database of ori-ental auroral observations discussed by Willis et al. (2005). This table provides the Gregorian date of each auroral obser-vation, the country, city, district or province/prefecture of the place at which the observation was made, as well as the ge-ographic and magnetic co-ordinates of the place of observa-tion. The translations of the oriental auroral records are pre-sented in Appendix A and the reasons for rejecting three im-plausible “auroral” records are discussed in Appendix B. Ta-ble 2 summarises the scientific attributes of the exactly dated East Asian auroral observations, as inferred from the trans-lated records, and indicates whether or not (“Yes”, “No”) a great geomagnetic storm was recorded at Greenwich on the same date. In addition, daily values of the Ak index (before AD 1868) or the aa index (from AD 1868) are presented in Table 2 for a 7-day interval centred on the day of the oriental auroral observation.
Using the information presented in Table 2, it is possible to separate the exactly dated and reliable East Asian auroral ob-servations in the interval AD 1840–1911 into two categories. The first category comprises those auroral observations that occurred in the presence of great geomagnetic storms (“Yes” in column 4) and hence occurred at times of strong geomag-netic activity (aa>150 or Ak>50 for at least one of the seven entries in column 5). The second category comprises those auroral observations that occurred in the absence of great ge-omagnetic storms (“No” in column 4) and at times of weak-to-moderate geomagnetic activity (aa or Ak≤50 for at least the central five entries in column 5). Observations in the sec-ond category are examples of sporadic aurorae recorded in East Asian histories. Moreover, the spatially localised na-ture of some of the oriental observations of sporadic aurorae is indicated by the use of a variety of descriptive terms (e.g. “lightning”, “rainbow”, “streak” or “grid”).
There are two tentative reasons for believing that sporadic aurorae may be associated with solar activity, despite the fact that they occur under weak-to-moderate levels of geomag-netic activity. First, as noted in Sect. 3.2, there is some evidence within the interval AD 1840–1911 for recurrent, though possibly intermittent, auroral activity on a timescale almost exactly equal to the mean synodic-solar-rotation pe-riod. There is similar evidence for recurrent auroral activity at many other times during the past two millennia. For exam-ple, there is strong evidence for recurrent (but intermittent) auroral activity between about the middle of AD 1127 and the middle of AD 1129 (Willis and Stephenson, 2001). Sec-ond, Willis et al. (2006) have drawn attention to the presence of large sunspots near the central solar meridian at the times