DNA metabarcoding reveals changes in the contents of
carnivorous plants along an elevation gradient
Joanne E. Littlefair
1,2| Axel Zander
3| Clara de Sena Costa
2| Elizabeth L. Clare
21
Department of Biology, McGill University, Montréal, Québec, Canada
2
School of Biological and Chemical Sciences, Queen Mary University of London, London, UK
3
Department of Biology, Unit of Ecology and Evolution, University of Fribourg, Fribourg, Switzerland
Correspondence
Joanne E. Littlefair, Department of Biology, McGill University, Montréal, Québec, Canada.
Email: [email protected]
Funding information
Schweizerischer Nationalfonds zur Förderung der Wissenschaftlichen Forschung, Grant/Award Number: 31003A_138489
Abstract
Resource variation along abiotic gradients influences subsequent trophic
interac-tions and these effects can be transmitted through entire food webs. Interacinterac-tions
along abiotic gradients can provide clues as to how organisms will face changing
environmental conditions, such as future range shifts. However, it is challenging to
find replicated systems to study these effects. Phytotelmata, such as those found in
carnivorous plants, are isolated aquatic communities and thus form a good model
for the study of replicated food webs. Due to the degraded nature of the prey,
molecular techniques provide a useful tool to study these communities. We studied
the pitcher plant Sarracenia purpurea L. in allochthonous populations along an
eleva-tional gradient in the Alps and Jura. We predicted that invertebrate richness in the
contents of the pitcher plants would decrease with increasing elevation, reflecting
harsher environmental conditions. Using metabarcoding of the COI gene, we
sequenced the invertebrate contents of these pitcher plants. We assigned
Molecu-lar Operational Taxonomic Units at ordinal level as well as recovering species
‐level
data. We found small but significant changes in community composition with
eleva-tion. These recovered sequences could belong to invertebrate prey, rotifer
inquili-nes, pollinators and other animals possibly living inside the pitchers. However, we
found no directional trend or site
‐based differences in MOTU richness with
eleva-tional gradient. Use of molecular techniques for dietary or contents analysis is a
powerful way to examine numerous degraded samples, although factors such as
DNA persistence and the relationship with species presence still have to be
com-pletely determined.
K E Y W O R D S
carnivory, DNA metabarcoding, food web, invasive, molecular dietary analysis, plant–insect interactions, Sarracenia purpurea
1
|
I N T R O D U C T I O N
Spatial and temporal variation in resource distribution is present throughout an organism's environment. Environmental resources and stressors may be organized in a spatial hierarchy or along a gradient, as is the case for heat stress and elevation, or pressure and ocean depth (Desmarais & Tessier, 1999; Flesch & Steidl, 2010; Jones,
Baltz, & Allen, 2002; O'Gorman et al., 2012). Studies of how resource use varies along environmental gradients are likely to be important for understanding species invasions (Gallien et al., 2015), and responses to climate change scenarios as species undergo range shifts (Colwell, Brehm, Cardelus, Gilman, & Longino, 2008; Parme-san, 2006). Gradients can also serve as natural experiments to extrapolate the temporal variability of communities and ecosystems
|
http://doc.rero.ch
Published in "Molecular Ecology 28(2): 281–292, 2019"
which should be cited to refer to this work.
(Fukami & Wardle, 2005; Lester, Close, Barton, Pope, & Brown, 2014).
Elevation is one source of variation in resource distribution. Resources alter either as a direct result of abiotic factors or from the effects of abiotic factors on biotic components. Abiotic conditions vary with elevation: higher altitudes are strongly associated with exposure to colder temperatures (known as the lapse rate), more extreme weather patterns, greater exposure to UV, lower atmo-spheric pressure and lower oxygen availability (Blumthaler, 2012; Hodkinson, 2005). Common biotic responses include shifts in species distribution, or complete species replacement, as organisms differ in their environmental tolerances (e.g., thermal limits Sundqvist, San-ders, & Wardle, 2013). Although it was initially thought that biodi-versity decreases with increasing elevation, Rahbek (2005) demonstrated a peak in diversity at midelevation, which holds true for 75% of elevational gradients examined (Rahbek, 2005; Sundqvist et al., 2013), although different functional groups will vary in their response (Sundqvist et al., 2013).
When gradients influence species distributions, we expect varia-tion in trophic relavaria-tionships within ecosystems. For example, the change in biodiversity with elevation will influence predator–prey and host–parasite interactions (Case, Holt, Mcpeek, & Keitt, 2005). This is difficult to study on a spatially replicated scale in the field, although attempts have been made experimentally (Greig, Wissinger, & Mcintosh, 2013). Phytotelmata are isolated aquatic communities that form natural mesocosms in living terrestrial plants, such as bromeliads, tree holes and certain types of carnivorous plant (Kitch-ing, 2000), and can be studied as small replicated ecosystems located within a larger landscape (Kitching, 2000).
The leaves of pitcher plants form phytotelmata, connecting the external environment to an enclosed aquatic food web of inquilines that aid in the decomposition of invertebrate prey. Prey are sources of nitrogen and phosphorus, which compensate for the nutrient‐poor environments which the pitcher plants inhabit. Prey capture has been shown to increase plant fitness (Zamora, Gomez, & Hodar, 1997), and the inquiline food web is limited by prey capture (Heard, 1994). Unlike bromeliads or tree holes, which are primarily contain-ers, pitcher plants are an active part of the phytotelmata ecosystem. While obtaining nutrients is crucial for both plant and inquiline biol-ogy, it is not known to what extent the invertebrate contents of pitcher plants are shaped by gradients such as elevation which can structure resources. Here, we test the ecological hypothesis that pitcher plant phytotelmata contents are influenced by elevational gradients.
The morphological identification of prey is often complicated by digestion and degradation. This problem has been encountered both generally (Pompanon et al., 2012; Valentini et al., 2009), and specifi-cally in pitcher plants, where studies refer to an unidentified mass of insect exoskeletons (Cresswell, 1991; Horner, Steele, Underwood, & Lingamfelter, 2012). Additionally, the characterization of food webs involving generalist predators of insects has so far been beyond the reach of most attempts, due to the huge numbers of links made with prey species (Clare, 2014; Pompanon et al., 2012). Sequencing
technologies such as metabarcoding, the massively parallel sequenc-ing of targeted gene fragments from all components of an environ-mental sample, are now commonly used to analyse the partially digested elements of diet. Metabarcoding is fast becoming the tool of choice in dietary analyses, including work on a wide range of diet types such as liquids (sap, blood, nectar, etc.), prey which do not leave hard remains or where destructive sampling is not ethical, or the material highly degraded (Clare, 2014; Pompanon et al., 2012). Clustering sequences into Molecular Operational Taxonomic Units (MOTU) (Floyd, Abebe, Papert, & Blaxter, 2002) can be used to quan-tify diversity for subsequent ecological analyses (Clare, Chain, Little-fair, & Cristescu, 2016).
In this study, we examine how the invertebrate contents of a carnivorous pitcher plant (Sarracenia purpurea) alter over an eleva-tional gradient. The natural range of S. purpurea extends from Florida to subarctic Canada, in nutrient‐limited areas (Kneitel & Miller, 2002). However, S. purpurea has been frequently introduced in Bri-tain, Ireland and central Europe from escaped ornamentals and delib-erate planting in bog areas, and displays invasive characteristics in certain areas of central Europe due to its frost‐hardy nature (Adlassnig, Mayer, Peroutka, Pois, & Lichtsheidl, 2010; Walker, 2014; Zander, Gravel, Bersier, & Gray, 2016). Sarracenia purpurea is a par-ticularly interesting case for the study of elevation gradients as the plant is allochthonous in the Alps, and thus, it has not undergone long‐term adaptation to the environment. As such, we can assess resource variation induced by elevational gradients against a back-ground of species invasion.
In this study, we use DNA metabarcoding techniques to investi-gate the contents of Sarracenia purpurea across sites in France and Switzerland over an elevation gradient of 850 m. We assess how MOTU richness and community composition of invertebrate con-tents of pitcher plants changes with elevation, and test for linear and other relationships between elevation gradient and MOTU rich-ness. Finally, we predict that community dissimilarity will vary in such a way that the most similar communities are closer in elevation to each other.
2
|
M A T E R I A L S A N D M E T H O D S
2.1
|
Sample collection
We collected samples of pitcher contents from Sarracenia purpurea pitchers in five locations in the Alps, Jura Mountains and the Swiss Plateau (Switzerland and France), between October 29 and Novem-ber 28, 2014. Our sampling locations comprised of raised bogs, fens and alpine wetlands at Champ Buet (46°36′41″N 6°34′41″E, ca. 600 m a.s.l), Frasne (46°49′35″N 6°10′25″E, ca. 800 m a.s.l), Les Embreux (47°15′44″N 7°6′57″E, ca. 1000 m a.s.l), Les Tenasses (46°29′28.37″N 6°55′15.00″E, ca. 1200 m a.s.l) and Les Mosses (46°23′47.10″N, 7° 5′59.79″E, ca. 1450 m a.s.l). (NB: Full grid coor-dinates will be given to interested members of the scientific commu-nity by the corresponding author.) We downloaded temperature and rainfall data from bioclim for these sites at 1‐km2resolution (Fick &
Hijmans, 2017) to characterize the sites, and these data are pre-sented in Supporting information Table S1. Because these plants are confined to bog sites, a true continuous gradient is not possible, and thus we attempted to spread collections across even elevational increases. Additionally, we assumed that phylogenetic relationships amongst plant populations at different altitudes did not directly influ-ence their contents. We collected at least 40 pitcher plant leaves at each site, except at 800 m where we could only collect 25, because fewer plants were available there. We targeted our collection to undamaged pitchers of a similar size and age from a mixture of clumps of S. purpurea within each site. We visually inspected the contents of each pitcher for living organisms and found none. We transferred the contents of each pitcher leaf with autoclaved cut‐off pipette tips into a sterile 50‐ml macrocentrifuge tube (Zander et al., 2016) and froze these at−20°C for molecular analysis.
2.2
|
Molecular techniques
Prior to extraction, we dried the samples for 48 hr at 40°C in a Her-atherm oven (Thermo Scientific). We extracted DNA using a Qiagen Blood and Tissue kit (Qiagen, UK), with some modifications to the protocol as follows. We added enough ATL buffer to cover the entire sample and then incubated these at 56°C for 48 hr with shak-ing to mix the contents. We then transferred 180μl of liquid from this material to a 2‐ml Eppendorf tube with 20 μl proteinase K, vor-texed gently and incubated at 56°C for 3 hr. After precipitation and purification, we eluted DNA in 35μl molecular grade water and stored it at −20°C prior to sequencing. It is likely that different pitcher plants captured different volumes of invertebrate contents in this study, which could influence the final results of the community composition analysis. It was impossible for us to standardize these volumes because the contents of a pitcher plant are highly degraded and mixed with varying amounts of organic matter, which is impossi-ble to separate from the invertebrate contents. Moreover, standard-ization could mask natural variation in what the pitcher plants capture. For this reason, we chose to take an “eDNA” approach to extracting DNA from the pitchers, by soaking the entire contents in the buffers of the first stage of the DNA extraction.
We PCR amplified a 157‐bp fragment of the cytochrome c oxi-dase subunit 1 (COI) region using primers ZBJ‐ArtF1c and ZBJ‐ ArtR2c (Zeale, Butlin, Barker, Lees, & Jones, 2011), modified using adaptors for the IonTorrent platform (Clare, Symondson, & Fenton, 2014). Our PCR protocols were modelled on Bohmann et al. (2011). Our PCR was conducted in a 20‐μl reaction of 10 μl of Qiagen multi-plex PCR master mix (Qiagen, CA), 6μl of water, 1 μl of each 10 μM primer and 2μl of DNA. The thermocycler reaction was as follows: 95°C, 15 min; 50 cycles of 95°C, 30 s, 52°C, 30 s, 72°C, 30 s, 72°C, 10 min. We visualized our amplicons on a 2% agarose 96‐well pre-cast E‐gel (Invitrogen, Life Technologies) and performed size selec-tion using the PCRClean DX kit (Aline Biosciences). We eluted the product in molecular grade water and measured the concentration on theQUBIT2.0 spectrophotometer using a Qubit dsDNA HS Assay Kit (Invitrogen, Life Technologies). We performed high‐throughput
sequencing (HTS) on the Ion Torrent (Life Technologies) sequencing platform using a 316 chip following the manufacturer's guidelines but with a 2× dilution. All PCR and sequencing steps were com-pleted at the Biodiversity Institute of Ontario, Guelph, Canada.
Following Brown et al., 2014, Clare, Symondson, Broders et al., 2014 and Clare, Symondson, Fenton et al., 2014, MID sequences were used on both forward and reverse primers (dual indexing) allowing us to uniquely tag all samples while reducing primer costs. We assigned each sample a unique primer combination, so all sequences could be identified to original samples.
2.3
|
Bioinformatic analysis
We cleaned and filtered sequences using Galaxy (Blankenberg et al., 2010; Giardine, Riemer, & Hardison, 2005; Goecks, Nekrutenko, & Taylor, 2010). We demultiplexed the reads using forward and reverse MID combinations, and we removed primers, MIDs, and adaptors, and collapsed sequences to unique haplotypes. We filtered reads by length, retaining only those that were 151–163 bp (the tar-get amplicon is 157 bp). Using custom bash scripts, we removed haplotypes containing only one copy (singletons): a common practice which reduces the probability of including false positives from sequencing errors (Alberdi, Aizpurua, Gilbert, & Bohmann, 2017). We then processed our sequence data in two different workflows to both quantify biodiversity (with clustered MOTU data) and also to
investigate whether we could assign species‐level taxonomic identity (with BLAST searches on the unclustered raw haplotypes).
We clustered the sequences into MOTU at 92% similarity using
QIIME (Caporaso et al., 2010) and picked a consensus sequence from eachMOTUusing the pick_otu and uclust functions. We selected
a clustering level that generated the minimum amount of apparent underestimating or overestimating of species diversity (e.g., when twoMOTUreceived the same assignment in BLAST/MEGAN, the data were considered “oversplit”). As with Salinas‐Ramos, Herrera Montalvo, León‐Regagnon, Arrizabalaga‐Escudero, & Clare, 2015 (another study on invertebrates using the same primer pair), we found the best results for MOTU delimitation were obtained at the
92% similarity value. We screened forMOTUbased on chimeras using the MOTHUR pipeline (Schloss et al., 2009). To assign taxonomic information to each MOTU, we ran a BLAST search against an in‐house database originating from >600,000 COI sequences downloaded from the NCBI database. We then used MEGANversion
5.10.7 (Huson, Auch, Qi, & Schuster, 2007) to visualize this taxonomic information using the following lowest common ancestor (LCA) parameters: Min score = 150.1, Max expected = 0.001, Top per cent = 10.0, Min support = 1, LCA per cent = 100.0, Min complexity = 0.2.
2.4
|
Ecological analysis
We organized our data asMOTU presence/absence within each
sam-ple and then as frequencies of MOTUs detected across all the sam-pling units (pitchers) for that elevation. For example, if MOTUX was
found in 10 of 40 pitchers in a site, it had an incidence of 0.25. Pitchers were used as the sample units for calculating all species richness and diversity estimates, and rarefaction curves. All analyses were completed in R (version 3.3.0; R Development Core Team 2016).
2.4.1
|
MOTUrichness and diversity
We visualized MOTU richness rarefaction curves for each elevation
using incidence frequency data inINEXT(version 2.0.12; Hsieh, Ma, & Chao, 2016a,b). Chao and Jost (2012) found that rarefaction /extrap-olation by sample completeness rather than sample size gives rise to meaningful comparisons between communities and also ranks them more efficiently. They recommend rarefying or extrapolating based on the minimum sample coverage obtained with double the refer-ence sample size (Chao & Jost, 2012). We therefore examinedMOTU
richness using rarefaction and extrapolation based on sample cover-age of 0.679 (the minimum sample covercover-age obtained with double our sample size). We used the point estimation function inINEXTto calculate 84% confidence intervals for these richness estimates based on Hill numbers. While intuitively a 95% confidence interval would be equivalent to 5% Type 1 error, simulation studies demon-strate that in reality, an 84% confidence interval is more likely to reflect this error, and that a 95% confidence interval is overly con-servative (MacGregor‐Fors & Payton, 2013; Payton, Greenstone, & Schenker, 2003). This is used in other empirical papers and reviews on species richness estimates (for example, Gotelli & Colwell 2011; Whitworth, Villacampa, Serrano Rojas, Downie, & MacLeod, 2017).
We calculated the exponential Shannon diversity (q = 1) and inverse Simpson concentration (q = 2) for each site using the same sample coverage of 0.679, as above, using SPADER (version 0.1.1; Chao, Ma, & Hsieh, 2015). We presented results using effective numbers of species (i.e., Hill numbers q = 0, q = 1 and q = 2), follow-ing Whitworth et al. (2017), because this allows meanfollow-ingful compar-ison of estimates (Chao & Jost, 2012). Chiu, Jost, and Chao (2014) recommend reporting the diversity for all species (q = 0), “typical” species (q = 1) and dominant species (q = 2).
We tested for a possible monotonic trend in per pitcher MOTU
richness using a linear mixed model implemented in the lme4 pack-age in R (Bates, Maechler, Bolker, & Walker, 2015). Per pitcherMOTU
richness was coded as the response variable, elevation was coded as a continuous fixed effect predictor, and site was included as a ran-dom effect to take into account the site‐based structure of our experimental design. For both this model and the ANOVA below,
MOTU richness was positively skewed, so we applied a square‐root transformation to this variable. We coded an additional model with-out elevation as the fixed effect and compared the two models using AIC to examine the explanatory power of the elevation term. We did not consider the explanatory term of elevation to contribute to the model if the models did not differ from each other by more than two AIC points.
Because a monotonic linear trend is not the only biologically plausible ecological scenario to describe how MOTU richness varies
amongst different elevations (see discussion in Rahbek, 2005), we also conducted an ANOVA on per pitcherMOTU richness with site
coded as an explanatory factor. This addresses the general question of whether differences in MOTU richness are greater between sites
than they are within sites.
2.4.2
|
Community composition
MOTUwhichMEGANcould not assign were removed from the data set.
We used the taxonomic assignments fromMEGANto perform simple calculations of the frequency of each order across the entire data set (the number of taxa from a given order expressed as a proportion of the total number of taxa from all orders). We then graphically exam-ined community composition by calculating the proportion of each order present at each site (the proportion of pitchers theMOTU is
found in expressed as the total number of pitchers at that elevation). To further probe the contents of each pitcher and to try to assign species‐level identifications to sequences, we performed a BLAST search of all unclustered sequences against this database. We then extracted all results with 99% and 100% identity to a reference sequence, with bit scores≥250 and with no gaps using a custom built python script. We used European and worldwide biodiversity databases to check the geographic distributions of each species match obtained, including BOLD (Ratnasingham & Hebert, 2007, 2013), PESI (2017), GBIF.org (2017), and ITIS (2017). In the rare cases where location could not be determined by these databases, we performed literature searches using Web of Science.
We assessed the correlation between community distance and elevational distance using the MOTU to which MEGAN had assigned
taxonomy. We implemented this analysis using a partial Mantel test (Smouse, Long, & Sokal, 1986) performed using the “VEGAN”
pack-age in R (Oksanen et al., 2016). We tested the binary Jaccard com-munity dissimilarity matrix of MOTU per pitcher against a dissimilarity matrix of elevation. The format of the partial Mantel test allows us to control for a third dissimilarity matrix of geo-graphic variables. This was necessary because some sites were not geographically evenly distributed—some sites which were further in terms of elevational distance were closer together geographically. We calculated a partial Mantel R statistic based on a Pearson's pro-duct‐moment correlation (recommended by the “VEGAN”
documenta-tion) using 999 permutations to detect the correlation between community dissimilarity and environmental dissimilarity (in this case, elevation).
3
|
R E S U L T S
3.1
|
Bioinformatic analysis
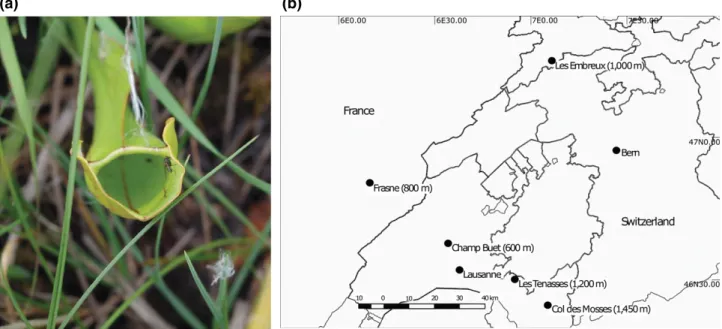
We sequenced the contents of 193 Sarracenia purpurea pitchers across the five sites in France and Switzerland (Figure 1a and b). After demultiplexing and collapse to unique haplotypes, each pitcher contained an average of 3023 ± 1,880 haplotypes (mean ± SD). On average, haplotypes were 152 bp long, ranging in length from 15 to
243 bp. We removed 75,674 haplotypes (13.0%) during length filter-ing. 78.8% of length‐filtered haplotypes were singletons and were also removed. For 13 samples, once all steps had been completed, the file was empty and was therefore removed from the analysis. All bioinformatics statistics are summarized in Table 1.
3.2
|
Ecological analysis
After clustering, we found 843 unique MOTUacross all sites using a
92%MOTUdelimitation criteria. Of these, 11 were removed as
proba-ble chimeras. After visualization of taxonomic information inMEGAN,
1 MOTU was identified as an“environmental sample” (most likely a
bacterial or fungal sequence) and therefore removed from further statistical analysis. Each pitcher contained an average of 17.4MOTU,
but the distribution of MOTU within pitchers was uneven, ranging from 0 (noMOTUassigned as per above) to 66 per pitcher. EachMOTU
appeared an average of 3.8 times over the entire study, but the fre-quencies of MOTU were also highly variable, ranging from 1 to 83 occurrences within pitchers over the entire study; 437 MOTU
appeared just once across the study, indicating the presence of many rareMOTU.
3.2.1
|
MOTUrichness and diversity
Table 2 presents elevation measures ofMOTU richness and diversity using Hill numbers q = 0, 1 and 2 (the effectiveMOTUnumbers
corre-sponding to exponential Shannon and inverse Simpson concentra-tion) usingMOTU rarefied or extrapolated to even sample coverage
(Figure 2).
Our results from the linear mixed model indicate that we found no monotonic directional trend in per pitcherMOTU richness (Model
1 (including elevation as a continuous factor) AIC: 681.53, Model 2 (without elevation) AIC: 682.11). The difference in AIC between the two models was not greater than 2 (a difference greater than 2 is commonly taken to indicate significant explanatory power for a term present in one model but absent from the other). We tested site‐ specific differences in MOTU richness with an ANOVA, which was
nonsignificant (Figure 3, F4,175= 1.34, p = 0.257). See Supporting
information Table S2 for a full table of all statistical results.
3.2.2
|
Community composition
Two hundred and nineteen MOTU were unassigned by MEGAN and
therefore removed for community composition analysis, leaving 612 uniqueMOTU. Each pitcher had an average of 2.67 unassignedMOTU,
and unassignedMOTUranged from 1 to 34 occurrences in the entire data set. Diptera represented the most dominant order at all five elevations (Figure 4). Of the ten most common MOTU across the study, eight were identified as Diptera. Following Diptera (48.7% of unique incidences in the study),MOTUwere most commonly assigned
to Lepidoptera (10.6%) and Coleoptera (4.6%) at the order level. The results of the partial Mantel test were significant (r = 0.059, p = 0.023), although the effect is small, as indicated by the low r value. This indicates that only a small proportion of the variance in
(a)
(b)
F I G U R E 1 (a) Sarracenia purpurea with possible invertebrate prey at the lowest elevation (600 m) (photo credit: Axel Zander). (b) Locations of the sampling sites in the Swiss Alps and France
T A B L E 1 Total and per pitcher sequence numbers for each stage of bioinformatics analysis using Ion Torrent data
Total
Per pitcher mean ±SD After demultiplexing 2,820,108 14,612 ± 7,463 After collapse to unique
haplotypes
583,520 3,023 ± 1,880
After length filtering 507,846 2,631 ± 1,986 After singleton removal 107,907 583 ± 393
community compositional similarity is explained by dissimilarity in site altitude, having controlled for any effect of geographic separation.
We also examined top BLAST hits at the 99% and 100% sequence similarity without clustering into MOTU in order to obtain possible genus and species‐level identifications. A full list of best BLAST assign-ments is presented in Supporting information Table S3. We obtained 162 matches with high similarity to known species and for which we could confirm a west European distribution covering the study area. Similar to theMOTUanalysis, Diptera represented the highest propor-tion of hits recovered (65%), followed by Lepidoptera (20%) and Hymenoptera (3.7%). Matches also included four species of beetle, two species of spiders, two rotifers and two millipedes. Many of the Diptera were represented by families such as the Sarcophagidae (flesh flies), Calliphoridae (blow flies) and Culicidae (mosquitoes). Sequences appearing in over 30 pitchers across the entire study matched to refer-ence sequrefer-ences from Sarcophaga carnaria, Sarcophaga jeanleclercqi, Sarcophaga lehmanni, Sarcophaga pyrenaica, Sarcophaga subvicina, Sar-cophaga variegata, Polietes lardarius and Drosophila suzukii.
4
|
D I S C U S S I O N
The application of ecological analyses such as assessments of rich-ness, diversity and community similarity to eukaryotic metabarcoding T A B L E 2 Per site species richness and diversity indices based on data rarefied/extrapolated to a sample size coverage of 0.679, calculated with theINEXTpackage in R
Altitude (m) 600 800 1,000 1,200 1,450
Rarefied/extrapolated sample size, based on even sample coverage (0.679) 32 36 28 44 44
Method Rarefaction Extrapolation Rarefaction Extrapolation Extrapolation
MOTU richness (q = 0) 299.2 282.4 273.8 323.2 363.8
Exponential Shannon diversity (q = 1) 206.0 197.3 194.4 225.0 246.5
Inverse Simpson concentration (q = 2) 129.4 126.2 129.5 145.5 155.4
F I G U R E 2 INEXTspecies accumulation curves using incidence frequency data and created using theINEXTpackage in R. Curves have been
extrapolated to an endpoint of 102 (double the sample size) with 500 bootstrap replications
0 5 10 15 20 Elevation (m) MO TU r ichness 600 800 1,000 1,200 1,450
F I G U R E 3 Per pitcherMOTUrichness at each site elevation. Error bars are 95% confidence intervals
data is a relatively recent analytical advance (Willerslev et al., 2014). Here, we use these analyses to explore the contents of allochtho-nous pitcher plant populations over an 850 m elevation gradient. We detectMOTUwhich we were able to assign to a range of inverte-brate taxa, and found that Diptera are the most frequently detected arthropod order, followed by Lepidoptera and Coleoptera. We were also able to match sequences directly against a reference database and obtained species‐specific hits which were consistent with possi-ble pitcher plant prey, pollinators and inquilines. Community similar-ity was linked to changes in elevation; however, this effect was small. We found no monotonic directional trend in per pitcherMOTU
richness with increasing elevation, nor did we find site‐specific dif-ferences in MOTU richness. The advantages of DNA metabarcoding for resolving the taxonomy of partially digested material are clear: in this study and elsewhere (Bittleston, Baker, Strominger, Pringle, & Pierce, 2016; Satler, Zellmer, & Carstens, 2016), we were able to rapidly assess the contents of many pitchers, even when morpholog-ical analysis was difficult due to a loss of identifying features in the process of digestion by the carnivorous plant.
4.1
|
Contents of pitchers identified by
metabarcoding
Our results identified members of the Diptera, Coleoptera, Hymenop-tera, Hemiptera and Lepidoptera orders, which are similarly found in morphological studies and in the native populations in North America (Table 3). By far the most species‐rich order that we identified was Diptera, which was found widely across all sites. This result is consis-tent with previous morphological studies in North America (Cresswell, 1991), and Europe (PhD thesis: Zander, 2017). Dipteran MOTUmost likely represents prey items, but in North America midge and fly larvae also appear as keystone predators in the food web of pitcher plants (Cochran‐Stafira & Von Ende, 1998; Heard, 1994). The mosquito
larva Wyeomyia smithii (the keystone predator in North American S. purpurea) is not distributed in central Europe (Adlassnig, Peroutka, & Lendl, 2011; Gebühr, Pohlon, Schmidt, & Küsel, 2006), although other members of the Culicidae family appear in our results. While Adlassnig et al. (2010) detected Sarcophagidae larvae inside European populations of congeneric Sarracenia flava; other researchers did not find arthropod inquilines living inside the pitchers during their studies (Gebühr et al., 2006; Zander, Bersier, & Gray, 2017; Zander et al., 2016). The presence of insect inquilines, which are able to leave the pitcher after metamorphosis, seems to be unresolved in the European populations. A final possible source of Dipteran DNA could be from the pollinators of S. purpurea (Jürgens, Sciligo, Witt, El‐Sayed, & Suck-ling, 2012), as it is possible that our metabarcoding approach detects Dipteran DNA which has been transferred during these visits. Although the particular inquiline and prey species differ between native and allochthonous populations, invertebrate functional groups may be important biological predictors of pitcher plant range, as inquiline successional stages are thought to be similar in pattern (Gray, Akob, Green, & Kostka, 2012; Zander et al., 2016).
We did not detect high numbers of ants, despite the fact that these are frequently found as prey in studies of North American plants (Newell & Nastase, 1998), and that ant species richness is high in both Switzerland and France (175 and 172 species respectively: http:// www.antwiki.org/wiki/). Few studies exist of prey capture by the European populations of S. purpurea, but two counted the Formicidae family amongst its prey (Adlassnig et al., 2010, PhD thesis: Zander, 2017), although the former study also highlighted the generally low species richness of prey caught by these allochthonous populations of S. purpurea. Hymenoptera species which were detected belong to the sawfly, wasp and parasitic wasp groups. We matched 13MOTUto the
order Adinetida, which includes rotifers that participate in the S. pur-purea food web by feeding on bacteria. However, if rotifers die within the pitcher, they will be digested as well, and DNA detection could result from these dead rotifers. FifteenMOTUwere matched to the
Ara-neae order, which could be due to spiders sealing pitchers with their webs (Cresswell, 1991) in order to predate on insects, or appearing as pitcher plant prey themselves (Ellison & Gotelli, 2009).
600 m 800 m 1,000 m 1,200 m 1,450 m Site Propor tion 0.0 0.2 0.4 0.6 0.8 1.0 Diptera Lepidoptera Adinetida Araneae Coleoptera Hymenoptera Not order Other order
F I G U R E 4 Proportions of orders found within the contents of Sarracenia purpurea at each elevation, using assignment of taxonomic information inMEGANforMOTU. The six most common orders are
displayed here.“Not order” indicates that taxonomic information was assigned higher than order level (e.g., class), and“Other order” indicates the small proportion of other, less common, orders found
T A B L E 3 Typical contents of a Sarracenia purpurea pitcher plant found in native ranges in North America
Heard, 1998 (260 pitchers over 2 years in one bog, Newfoundland, CA) Cresswell, 1991 (214 pitchers over 55 days in one bog, Brighton, Michigan) Judd, 1959 (489 pitchers over 2 years in Byron bog, SW Ontario) Hymenoptera 33% 9.7% 11% Diptera 33% 71% 63% Gastropoda 8% Coleoptera 7% 5.5% 14% Collembola 7.3% Lepidoptera 2% Araneida 2%
http://doc.rero.ch
4.2
|
Effects of elevation
Interestingly, we did not find evidence to support a decrease in the
MOTU richness of pitcher plant contents at high elevations, but
instead found no trend. It is possible that our sampling strategy did not cover a sufficiently large gradient to make a change inMOTU
rich-ness detectable. For example, Rahbek, 2005 reported that patterns of species richness changed depending on the length of the sampled gradient and grain size (scale of analysis). More drastic changes in pitcher contents in our analysis could be expected at the timberline and snowline in the Alps (Meyer & Thaler, 1995), but plant distribu-tion (and therefore our sampling) is limited by the existence of bog‐ like habitats for the plants. Due to the distribution of pitcher plants in discrete bog habitats, it was difficult to sample the plants on a continuous elevational gradient and examine directional trends in this way. We were additionally constrained by the limited number of sites available for study, which would make only the strongest direc-tional effects detectable. We therefore also chose to include one test which did not directly interrogate a directional gradient inMOTU
richness (ANOVA), but found no additional site‐specific differences inMOTU richness. Alternatively, it may be possible that pitcher plant
contents do not mirror external invertebrate richness but are con-trolled by other processes which act as a buffer between external invertebrate richness and the contents of the plant. Care was taken to select pitchers of a similar age and size, but other plant‐specific factors might be at play, such as capture efficiency of prey.
We found a small but significant positive correlation between distance matrices of community composition and elevation. Previous studies of invertebrate fauna in the Alps have found changes in com-munity composition at higher elevations, for example, reports of an increase in the proportion of Diptera relative to other orders (Pape et al., 2015), and a decrease in the species richness of wild bees (Hoiss, Krauss, Potts, Roberts, & Steffan‐Dewenter, 2012). Studies to date have been based on populations of free‐living invertebrates, whereas here we examined the contents of a carnivorous plant. It would take further work to investigate whether the contents of plants reflects external invertebrate diversity. The lack of change in
MOTUrichness and small change in invertebrate community composi-tion does suggest that the contents of S. purpurea are reasonably homogenous throughout the sites we studied. Given that at least some of this detritus will be digested and form a nitrogen source for the plant, it appears that S. purpurea is able to obtain an adequate diet to establish non‐native populations even at elevations as high as 1450 m, which has implications for its spread and establishment around non‐native Europe, and possibly to more northern parts of Europe during regional warming.
4.3
|
Molecular and bioinformatic methods
We recovered a short target fragment length (157 bp) to maximize recovery in a system where DNA might be degraded by enzymes or the food web within S. purpurea. Primer and reference library selec-tion plays an important role in taxonomic recovery in DNA
metabarcoding studies. A related study targeted the contents of a congeneric pitcher plant with a different target region, the large sub-unit 28S rRNA region (Satler et al., 2016). The authors recovered many more fungal sequences, with arthropods making up a smaller proportion of recovered hits than in our study, alongside protozoans and annelids. However, we used a primer originally designed specifi-cally for studies on degraded invertebrate matter, in conjunction with a local reference library composed of majority invertebrate ref-erence sequences, and thus, the diffref-erence is not surprising. We per-formed two analyses with our sequences. First, we assigned all sequences toMOTUwith only ordinal‐level identifications, and second,
we compared sequences to a known database to retrieve any spe-cies‐level identifications. The first analysis is used as a statistical method to compare the levels of richness and diversity at the ordinal level but should not be conflated with taxonomic assignment (see a discussion in Clare et al., 2016). Different bioinformatic parameters used to defineMOTU can produce extensive variation in MOTU esti-mates, although this is unlikely to strongly influence ecological analy-ses (Clare et al., 2016). For this reason, we have used a low clustering threshold (92%) to minimize the generation of false OTUs rather than to recover a particular taxonomic rank. In the second analysis, we identify species through comparison to our known refer-ence database. Referrefer-ence collections for invertebrates even in Eur-ope are still largely incomplete, and most reference collections contain a bias towards species of charismatic or economic interest and some species still remain undescribed. For example, a sampling campaign involving the collection of Diptera specimens in the north east of Italy found 10 species new to science (Ziegler, 2012). Because of this, we have not performed an ecological analysis of these data assigned at species level, but present these simply as spe-cies that are likely present in the pitchers.
4.4
|
DNA degradation and the use of
metabarcoding
Little is known about how the processes of decomposition or diges-tion affect the detecdiges-tion of DNA, and how long the DNA of inver-tebrate prey remains in the pitcher after decomposition. In freshwater systems, the persistence of eDNA in water has been estimated not to exceed 25 days (see discussion in Turner, Uy, & Everhart, 2015), with degradation likely to occur through exposure to abiotic factors such as UV components of light. There are some studies, which detect DNA for much longer lengths, for example, 132 days in lake sediments (Turner et al., 2015), 88 days in spider webs (Xu, Yen, Bowman, & Turner, 2015), and of course DNA can be extracted from sediment cores that are much older (Willerslev et al., 2014). Fewer studies relate to how digestion affects prey DNA within animals (and no studies exist for carnivorous plants), but Wallinger et al. (2015) showed that DNA persisted in the gut of carabid beetles for at least 72 hr after feeding (the maximum time point measured in their experiment) and that the persistence of DNA after digestion was likely to be prey species‐specific. Complex and unpredictable processes associated with digestion and
degradation will influence detection of species, estimates of MOTU
and subsequent ecological analyses in metabarcoding studies of diet. The fact that DNA is likely to persist for some time, and originate from multiple sources (e.g., prey, inquilines, pollinators, traces of eDNA in this study), could blur the strict relationship between spe-cies presence and spespe-cies detection, given its persistence in the environment. However, DNA‐based techniques will be informative in providing medium‐ to long‐term estimates of dietary contents if DNA persists inside the digestive parts. The use of environmental RNA is also likely to be of interest in the study of pitcher plants due to its shorter half‐life (Littlefair & Clare, 2016; Pochon, Zaiko, Fletcher, Laroche, & Wood, 2017), which could possibly discriminate between dead prey and living inquilines in a study such as this. Pitcher plants represent an ideal system to test this in, because their passive feeding strategies can be more easily manipulated than that of active predatory animals.
5
|
C O N C L U S I O N S
We used metabarcoding techniques to elucidate the contents of allochthonous populations of the pitcher plant Sarracenia purpurea along an elevational gradient. Molecular techniques have rarely been applied to carnivorous plants, but were instrumental in this study in determining the richness of invertebrate MOTU, as well as matching
to species‐level sequences against a reference database. We found no evidence for a directional trend or site‐specific differences in
MOTUrichness, but did see small but significant changes in the
com-munity composition of the pitcher. Metabarcoding can be usefully applied to future carnivorous plant studies, as partially degraded invertebrate prey exoskeletons present a particular challenge for morphological identification. Although limited to bog habitats, S. pupurea appears to be obtaining similar pitcher contents compared to North American populations (Cresswell, 1991; Heard, 1998; Judd, 1959), even at high altitudes, indicating that European populations appear well established, with implications for the invasion biology of carnivorous plants.
A C K N O W L E D G E M E N T S
We thank David Bennett and Dr Monika Struebig for assistance with DNA extractions and data analysis. We further thank Manuela Sch-warz for help collecting the field samples and Louis‐Félix Bersier for funding the sample collection (Swiss National Science Foundation Grant awarded to Louis‐Félix Bersier Nr. 31003A_138489). We thank Brock Fenton for reading an earlier draft, and the two review-ers and editor for their comments which substantially improved the manuscript.
A U T H O R C O N T R I B U T I O N S
B.C. and A.Z. conceived and designed the study, A.Z. collected the field samples, B.C. contributed reagents/sequencing, J.L. and C.D.S.C.
performed the laboratory work, J.L. analysed the data and made the figures, and J.L. wrote the study with assistance from B.C. and the other co‐authors.
D A T A A C C E S S I B I L I T Y
Representative sequences forMOTUin each pitcher (grouped by
ele-vation) and a summary matrix ofMOTUs in each plant are provided in
Dryad https://doi.org/10.5061/dryad.tg8fq3c.
O R C I D
Joanne E. Littlefair http://orcid.org/0000-0002-4481-0211 Elizabeth L. Clare http://orcid.org/0000-0002-6563-3365
R E F E R E N C E S
Adlassnig, W., Mayer, E., Peroutka, M., Pois, W., & Lichtsheidl, I. K. (2010). Two American sarracenia species as neophyta in central Eur-ope. Phyton; Annales Rei Botanicae, 49, 279–292.
Adlassnig, W., Peroutka, M., & Lendl, T. (2011). Traps of carnivorous pitcher plants as a habitat: Composition of the fluid, biodiversity and mutualistic activities. Annals of Botany, 107, 181–194. https://doi. org/10.1093/aob/mcq238
Alberdi, A., Aizpurua, O., Gilbert, M. T. P., & Bohmann, K. (2017). Scruti-nizing key steps for reliable metabarcoding of environmental samples. Methods in Ecology and Evolution, 9(1), 1–14.
Bates, D., Maechler, M., Bolker, B., & Walker, S. (2015). Fitting linear mixed‐effects models using lme4. Journal of Statistical Software, 67, 1–48.
Bittleston, L. S., Baker, C. C. M., Strominger, L. B., Pringle, A., & Pierce, N. E. (2016). Metabarcoding as a tool for investigating arthropod diversity in Nepenthes pitcher plants. Austral Ecology, 41, 120–132. https://doi.org/10.1111/aec.12271
Blankenberg, D., Kuster, G. V., Coraor, N., Ananda, G., Lazarus, R., Man-gan, M.,… Taylor, J. (2010). NIT 19.10 Galaxy: A web‐based genome analysis tool for experimentalists. Current Protocols in Molecular Biol-ogy, 19, 1–21.
Blumthaler, M. (2012). Solar radiation of the high Alps. In C. Lütz (Ed.), Plants in alpine regions: Cell physiology of adaption and survival strate-gies (pp. 1–27). New York, NY: Springer Wein.
Bohmann, K., Monadjem, A., Lehmkuhl Noer, C., Rasmussen, M., Zeale, M. R. K., Clare, E.,… Gilbert, M. T. P. (2011). Molecular diet analysis of two African free‐tailed bats (Molossidae) using high throughput sequencing. PLoS One, 6, e21441. https://doi.org/10.1371/journal. pone.0021441
Brown, D. S., Symondson, W. O. C., Burger, R., Cole, N., Vencatasamy, D., Clare, E. L.,… Symondson, W. O. C. (2014). Dietary competi-tion between the alien Asian Musk Shrew (Suncus murinus) and a reintroduced population of Telfair's Skink (Leiolopisma telfairii). Molecular Ecology, 23, 3695–3705. https://doi.org/10.1111/mec. 12445
Caporaso, J. G., Kuczynski, J., Stombaugh, J., Bittinger, K., Bushman, F. D., Costello, E. K.,… Knight, R. (2010). QIIME allows analysis of high‐ throughput community sequencing data. Nature Methods, 7, 335– 336. https://doi.org/10.1038/nmeth.f.303
Case, T. J., Holt, R. D., Mcpeek, M. A., & Keitt, T. H. (2005). The commu-nity context of species’ borders: Ecological and evolutionary perspec-tives. Oikos, 108, 28–46. https://doi.org/10.1111/j.0030-1299.2005. 13148.x
Chao, A., & Jost, L. (2012). Coverage‐based rarefaction and extrapolation: Standardizing samples by completeness rather than size. Ecology, 93, 2533–2547. https://doi.org/10.1890/11-1952.1
Chao, A., Ma, K. H., & Hsieh, T. C. (2015).SPADER: Species Prediction and
Diversity Estimation with R. R package version 0.1.0.
Chiu, C.-H., Jost, L., & Chao, A. (2014). Phylogenetic beta diversity, simi-larity, and differentiation measures based on Hill numbers. Ecological Monographs, 84, 21–44. https://doi.org/10.1890/12-0960.1 Clare, E. L. (2014). Molecular detection of trophic interactions: Emerging
trends, distinct advantages, significant considerations and conserva-tion applicaconserva-tions. Evoluconserva-tionary Applicaconserva-tions, 7, 1144–1157. https://doi. org/10.1111/eva.12225
Clare, E. L., Chain, F. J. J., Littlefair, J. E., & Cristescu, M. E. (2016). The effects of parameter choice on defining molecular operational taxonomic units and resulting ecological analyses of metabarcoding data. Genome, 59, 981–990. https://doi.org/10.1139/gen-2015-0184
Clare, E. L., Symondson, W. O. C., Broders, H., Fabianek, F., Fraser, E. E., MacKenzie, A.,… Reimer, J. P. (2014). The diet of Myotis lucifugus across Canada: Assessing foraging quality and diet variability. Molecu-lar Ecology, 23, 3618–3632. https://doi.org/10.1111/mec.12542 Clare, E. L., Symondson, W. O. C., & Fenton, M. B. (2014). An inordinate
fondness for beetles? Variation in seasonal dietary preferences of night‐roosting big brown bats (Eptesicus fuscus). Molecular Ecology, 23, 3633–3647. https://doi.org/10.1111/mec.12519
Cochran-Stafira, D. L., & Von Ende, C. N. (1998). Integrating bacteria into food webs: Studies with Sarracenia purpurea inquilines. Ecology, 79, 880–898. https://doi.org/10.2307/176587
Colwell, R. K., Brehm, G., Cardelus, C. L., Gilman, A. C., & Longino, J. T. (2008). Global warming, elevational range shifts, and lowland biotic attrition in the wet tropics. Science, 322, 258–261. https://doi.org/ 10.1126/science.1162547
Cresswell, J. C. (1991). Capture rates and composition of insect prey of the pitcher plant Sarracenia purpurea. The American Midland Naturalist, 125, 1–9. https://doi.org/10.2307/2426363
Desmarais, K. H., & Tessier, A. J. (1999). Performance trade‐off across a natural resource gradient. Oecologia, 120, 137–146. https://doi.org/ 10.1007/s004420050842
Ellison, A. M., & Gotelli, N. J. (2009). Energetics and the evolution of car-nivorous plants ‐ Darwin's “most wonderful plants in the world”. Journal of Experimental Botany, 60, 19–42. https://doi.org/10.1093/ jxb/ern179
Fick, S. E., & Hijmans, R. J. (2017). Worldclim 2: New 1‐km spatial resolution climate surfaces for global land areas. International Journal of Climatology, 37, 4302–4315. https://doi.org/10.1002/joc.5086 Flesch, A. D., & Steidl, R. J. (2010). Importance of environmental and
spa-tial gradients on patterns and consequences of resource selection. Ecological Applications, 20, 1021–1039. https://doi.org/10.1890/09-0076.1
Floyd, R., Abebe, E., Papert, A., & Blaxter, M. (2002). Molecular bar-codes for soil nematode identification. Molecular Ecology, 11, 839– 850.
Fukami, T., & Wardle, D. A. (2005). Long‐term ecological dynamics: Reciprocal insights from natural and anthropogenic gradients. Pro-ceedings of the Royal Society B: Biological Sciences, 272, 2105–2115. https://doi.org/10.1098/rspb.2005.3277
Gallien, L., Mazel, F., Lavergne, S., Renaud, J., Douzet, R., & Thuiller, W. (2015). Contrasting the effects of environment, dispersal and biotic interactions to explain the distribution of invasive plants in alpine communities. Biological Invasions, 17, 1407–1423. https://doi.org/10. 1007/s10530-014-0803-1
GBIF.org (2017). GBIF home page. Retrieved from: https://www.gbif.org [Last accessed 1 June 2017].
Gebühr, C., Pohlon, E., Schmidt, A. R., & Küsel, K. (2006). Development of microalgae communities in the phytotelmata of allochthonous
populations of Sarracenia purpurea (Sarraceniaceae). Plant Biology, 8, 849–860. https://doi.org/10.1055/s-2006-924474
Giardine, B., Riemer, C., & Hardison, R. (2005). Galaxy: A platform for interactive large‐scale genome analysis. Genome Research, 15, 1451– 1455. https://doi.org/10.1101/gr.4086505
Goecks, J., Nekrutenko, A., & Taylor, J. (2010). Galaxy: A comprehensive approach for supporting accessible, reproducible, and transparent computational research in the life sciences. Genome Biology, 11, R86. https://doi.org/10.1186/gb-2010-11-8-r86
Gotelli, N. J., & Colwell, R. K. (2011). Estimating species richness. In A. E. Magurran, & B. J. McGill (Eds.), Biological diversity: Frontiers in mea-surement and assessment (pp. 39–54). Oxford, UK: Oxford University Press.
Gray, S. M., Akob, D. M., Green, S. J., & Kostka, J. E. (2012). The bacterial composition within the Sarracenia purpurea model system: Local scale differences and the relationship with the other members of the food web. PLoS One, 7, e50969. https://doi.org/10.1371/journal.pone. 0050969
Greig, H. S., Wissinger, S. A., & Mcintosh, A. R. (2013). Top‐down control of prey increases with drying disturbance in ponds: A consequence of non‐consumptive interactions? Journal of Animal Ecology, 82, 598– 607. https://doi.org/10.1111/1365-2656.12042
Heard, S. B. (1994). Pitcher‐plant midges and mosquitoes: A processing chain commensalism. Ecology, 75, 1647–1660. https://doi.org/10. 2307/1939625
Heard, S. B. (1998). Capture rates of invertebrate prey by the pitcher plant, Sarracenia purpurea L. The American Midland Naturalist, 139, 79–89. https://doi.org/10.1674/0003-0031(1998)139[0079:CROIPB] 2.0.CO;2
Hodkinson, I. D. (2005). Terrestrial insects along elevation gradients: Spe-cies and community responses to altitude. Biological Reviews, 80, 489–513. https://doi.org/10.1017/S1464793105006767
Hoiss, B., Krauss, J., Potts, S. G., Roberts, S., & Steffan-Dewenter, I. (2012). Altitude acts as an environmental filter on phylogenetic com-position, traits and diversity in bee communities. Proceedings of the Royal Society B: Biological Sciences, 279, 4447–4456. https://doi.org/ 10.1098/rspb.2012.1581
Horner, J. D., Steele, J. C., Underwood, C. A., & Lingamfelter, D. (2012). Age‐related changes in characteristics and prey capture of seasonal cohorts of Sarracenia alata pitchers. The American Midland Naturalist, 167, 13–27. https://doi.org/10.1674/0003-0031-167.1.13
Hsieh, T. C., Ma, K. H., & Chao, A. (2016a).INEXT: An R package for
rar-efaction and extrapolation of species diversity (Hill numbers). Meth-ods in Ecology and Evolution, 7, 1451–1456. https://doi.org/10.1111/ 2041-210X.12613
Hsieh, T. C., Ma, K. H., & Chao, A. (2016b) INEXT: iNterpolation and
EXTrapolation for species diversity. Retrieved from http://chao.stat. nthu.edu.tw/wordpress/software_download/
Huson, D., Auch, A., Qi, J., & Schuster, S. (2007). MEGAN analysis of
metagenomic data. Genome Research, 17, 377–386. https://doi.org/ 10.1101/gr.5969107
ITIS. (2017). Integrated taxonomic information system. Retrieved from the Integrated Taxonomic Information System on-line database, http:// www.itis.gov. [last accessed 01 June 2017]
Jones, R., Baltz, D., & Allen, R. (2002). Patterns of resource use by fishes and macroinvertebrates in Barataria Bay, Louisiana. Marine Ecology Progress Series, 237, 271–289. https://doi.org/10.3354/meps237271 Judd, W. W. (1959). Studies of the byron bog in southwestern Ontario
X. Inquilines and victims of the pitcher‐plant Sarracenia purpurea L. The Canadian Entomologist, 91, 171–180. https://doi.org/10.4039/ Ent91171-3
Jürgens, A., Sciligo, A., Witt, T., El-Sayed, A. M., & Suckling, D. M. (2012). Pollinator‐prey conflict in carnivorous plants. Biological Reviews, 87, 602–615. https://doi.org/10.1111/j.1469-185X.2011. 00213.x
Kitching, R. L. (2000). Food webs and container habitats: The natural his-tory and ecology of phytotelmata. Cambridge: Cambridge University Press. https://doi.org/10.1017/CBO9780511542107
Kneitel, J. M., & Miller, T. E. (2002). Resource and top‐predator regula-tion in the pitcher plant (Sarracenia Purpurea) inquiline community. Ecology, 83, 680–688. https://doi.org/10.1890/0012-9658(2002)083 [0680:RATPRI]2.0.CO;2
Lester, R. E., Close, P. G., Barton, J. L., Pope, A. J., & Brown, S. C. (2014). Predicting the likely response of data‐poor ecosystems to climate change using space‐for‐time substitution across domains. Global Change Biology, 20, 3471–3481. https://doi.org/10.1111/gcb. 12634
Littlefair, J. E., & Clare, E. L. (2016). Barcoding the food chain: Sanger to high‐throughput sequencing. Genome, 59, 946–958. https://doi.org/ 10.1139/gen-2016-0028
MacGregor-Fors, I., & Payton, M. E. (2013). Contrasting diversity values: Statistical inferences based on overlapping confidence intervals. PLoS One, 8, 8–11.
Meyer, E., & Thaler, K. (1995). Animal diversity at high altitudes in the Austrian central alps. In F. S. Chapin, & C. Körner (Eds.), Arctic and alpine biodiversity: Patterns, causes and ecosystem consequences (pp. 97–108). Berlin, Heidelberg: Springer-Verlag.
Newell, S., & Nastase, A. (1998). Efficiency of insect capture by Sarrace-nia purpurea (SarraceSarrace-niaceae), the Northern Pitcher Plant. American Journal of Botany, 85, 88–91. https://doi.org/10.2307/2446558 O'Gorman, E. J., Pichler, D. E., Adams, G., Benstead, J. P., Cohen, H.,
Craig, N., & Woodward, G. (2012). Impacts of warming on the struc-ture and functioning of aquatic communities: Individual‐to ecosys-tem‐level responses. Advances in Ecological Research, 47, 81–176. Oksanen, J., Blanchet, F. G., Friendly, M., Kindt, R., Legendre, P., McGlinn,
D.,… Helene, W. (2016).VEGAN: Community ecology package. R pack-age version 2.4-0. Retrieved from https://CRAN.R-project.org/packa ge=vegan
Pape, T., Beuk, P., Pont, A., Shatalkin, A. I., Ozerov, A. L., Woźnica, A. J., … de Jong, Y. (2015). Fauna Europaea: Diptera – Brachycera. Biodiversity Data Journal, 3, e4187. https://doi.org/10.3897/BDJ.3.e 4187
Parmesan, C. (2006). Ecological and evolutionary responses to recent climate change. Annual Review of Ecology, Evolution, and Systematics, 37, 637–669. https://doi.org/10.1146/annurev.ecolsys.37.091305. 110100
Payton, M. E., Greenstone, M. H., & Schenker, N. (2003). Overlapping confidence intervals or standard error intervals: What do they mean in terms of statistical significance? Journal of Insect Science, 3, 15841249.
PESI. (2017). Pan-European Species directories Infrastructure. Retrieved from www.eu-nomen.eu/portal [Last accessed on 01 June 2017] Pochon, X., Zaiko, A., Fletcher, L. M., Laroche, O., & Wood, S. A. (2017).
Wanted dead or alive? Using metabarcoding of environmental DNA and RNA to distinguish living assemblages for biosecurity applica-tions. PLoS One, 12, 1–19.
Pompanon, F., Deagle, B. E., Symondson, W. O. C., Brown, D. S., Jarman, S. N., & Taberlet, P. (2012). Who is eating what: Diet assessment using next generation sequencing. Molecular Ecology, 21, 1931–1950. https://doi.org/10.1111/j.1365-294X.2011.05403.x
R Development Core Team (2016) R: A language and environment for sta-tistical computing. Vienna, Austria: R Foundation for Stasta-tistical Com-puting. http://www.R-project.org/.
Rahbek, C. (2005). The role of spatial scale and the perception of large‐ scale species‐richness patterns. Ecology Letters, 8, 224–239.
Ratnasingham, S., & Hebert, P. D. N. (2007). BOLD: The barcode of life data system (www.barcodinglife.org) . Molecular Ecology Notes, 7, 355–364.
Ratnasingham, S., & Hebert, P. D. N. (2013). A DNA‐based registry for all animal species: The barcode index number (BIN) system.
PLoS One, 8, e66213. https://doi.org/10.1371/journal.pone. 0066213
Salinas-Ramos, V. B., Herrera Montalvo, L. G., León-Regagnon, V., Arriza-balaga-Escudero, A., & Clare, E. L. (2015). Dietary overlap and sea-sonality in three species of mormoopid bats from a tropical dry forest. Molecular Ecology, 24, 5296–5307. https://doi.org/10.1111/ mec.13386
Satler, J. D., Zellmer, A. J., & Carstens, B. C. (2016). Biogeographic barri-ers drive co‐diversification within associated eukaryotes of the Sar-racenia alata pitcher plant system. PeerJ, 4, e1576. https://doi.org/ 10.7717/peerj.1576
Schloss, P. D., Westcott, S. L., Ryabin, T., Hall, J. R., Hartmann, M., Hollis-ter, E. B.,… Weber, C. F. (2009). Introducing mothur: Open‐source, platform‐independent, community‐supported software for describing and comparing microbial communities. Applied and Environmental Microbiology, 75, 7537–7541. https://doi.org/10.1128/AEM.01541-09
Smouse, P., Long, J., & Sokal, R. (1986). Multiple regression and correlation extensions of the Mantel test of matrix correspondence. Systematic Zoology, 35, 627–632. https://doi.org/10.2307/2413122 Sundqvist, M. K., Sanders, N. J., & Wardle, D. A. (2013). Community and
ecosystem responses to elevational gradients: Processes, mecha-nisms, and insights for global change. Annual Review of Ecology, Evolution, and Systematics, 44, 261–280. https://doi.org/10.1146/an nurev-ecolsys-110512-135750
Turner, C. R., Uy, K. L., & Everhart, R. C. (2015). Fish environmental DNA is more concentrated in aquatic sediments than surface water. Biolog-ical Conservation, 183, 93–102. https://doi.org/10.1016/j.biocon. 2014.11.017
Valentini, A., Miquel, C., Nawaz, M. A., Bellemain, E., Coissac, E., Pom-panon, F., … Taberlet, P. (2009). ew perspectives in diet analysis based on DNA barcoding and parallel pyrosequencing: The trnL approach. Molecular Ecology Resources, 9, 51–60. https://doi.org/10. 1111/j.1755-0998.2008.02352.x
Walker, K. J. (2014). Sarracenia purpurea subsp purpurea (Sarraceniaceae) naturalised in Britain and Ireland: Distribution, ecology, impacts and control. New Journal of Botany, 4, 33–41. https://doi.org/10.1179/ 2042349714Y.0000000035
Wallinger, C., Sint, D., Baier, F., Schmid, C., Mayer, R., & Traugott, M. (2015). Detection of seed DNA in regurgitates of granivorous carabid beetles. Bulletin of Entomological Research, 105, 728–735. https://doi. org/10.1017/S000748531500067X
Whitworth, A., Villacampa, J., Serrano Rojas, S. J., Downie, R., & MacLeod, R. (2017). Methods matter: Different biodiversity survey methodologies identify contrasting biodiversity patterns in a human modified rainforest— A case study with amphibians. Ecological Indi-cators, 72, 821–832. https://doi.org/10.1016/j.ecolind.2016.08.055 Willerslev, E., Davison, J., Moora, M., Zobel, M., Coissac, E., Edwards, M.
E., … Taberlet, P. (2014). Fifty thousand years of Arctic vegetation and megafaunal diet. Nature, 506, 47–51. https://doi.org/10. 1038/nature12921
Xu, C. C. Y., Yen, I. J., Bowman, D., & Turner, C. R. (2015). Spider web DNA: A new spin on noninvasive genetics of predator and prey. PLoS One, 10, e0142503. https://doi.org/10.1371/journal.pone.0142503 Zamora, R., Gomez, J. M., & Hodar, J. A. (1997). Responses of a
carnivo-rous plant to prey and inorganic nutrients in a Mediterranean envi-ronment. Oecologia, 111, 443–451. https://doi.org/10.1007/ s004420050257
Zander, A. (2017) Interactions of Sarracenia purpurea and its inquilines; comparing Europe and North America. PhD thesis, University of Fri-bourg, Fribourg.
Zander, A., Bersier, L.-F., & Gray, S. M. (2017). Effects of temperature variability on community structure in a natural microbial food web. Global Change Biology, 23, 56–67. https://doi.org/10.1111/gcb. 13374
Zander, A., Gravel, D., Bersier, L.-F., & Gray, S. M. (2016). Top predators affect the composition of naive protist communities, but only in their early‐successional stage. Oecologia, 180, 519–528. https://doi.org/10. 1007/s00442-015-3476-2
Zeale, M. R. K., Butlin, R. K., Barker, G. L. A., Lees, D. C., & Jones, G. (2011). Taxon‐specific PCR for DNA barcoding arthropod prey in bat faeces. Molecular Ecology Resources, 11, 236–244. https://doi.org/10. 1111/j.1755-0998.2010.02920.x
Ziegler, J. (2012). The biodiversity of a Central Alpine landscape as exem-plified by the two-winged flies (Diptera). In Mitteilungen der Deutschen Gesellschaft für allgemeine und angewandte Entomologie (vol. 18 pp. 45–49), Vorträge der Entomologentagung in Berlin, Ger-many, 21–24 March 2011. Munich, Germany: Deutsche Gesellschaft für allgemeine und angewandte Entomologie e.V.
S U P P O R T I N G I N F O R M A T I O N
Additional supporting information may be found online in the Supporting Information section at the end of the article.