HAL Id: hal-00302979
https://hal.archives-ouvertes.fr/hal-00302979
Submitted on 18 Jul 2007HAL is a multi-disciplinary open access
archive for the deposit and dissemination of sci-entific research documents, whether they are pub-lished or not. The documents may come from teaching and research institutions in France or abroad, or from public or private research centers.
L’archive ouverte pluridisciplinaire HAL, est destinée au dépôt et à la diffusion de documents scientifiques de niveau recherche, publiés ou non, émanant des établissements d’enseignement et de recherche français ou étrangers, des laboratoires publics ou privés.
Formation and characteristics of ions and charged
aerosol particles in a native Australian Eucalypt forest
T. Suni, M. Kulmala, A. Hirsikko, T. Bergman, L. Laakso, P. P. Aalto, R.
Leuning, H. Cleugh, S. Zegelin, D. Hughes, et al.
To cite this version:
T. Suni, M. Kulmala, A. Hirsikko, T. Bergman, L. Laakso, et al.. Formation and characteristics of ions and charged aerosol particles in a native Australian Eucalypt forest. Atmospheric Chemistry and Physics Discussions, European Geosciences Union, 2007, 7 (4), pp.10343-10369. �hal-00302979�
ACPD
7, 10343–10369, 2007 Ions in an Australian Eucalypt forest T. Suni et al. Title Page Abstract Introduction Conclusions References Tables Figures ◭ ◮ ◭ ◮ Back CloseFull Screen / Esc
Printer-friendly Version
Interactive Discussion
EGU Atmos. Chem. Phys. Discuss., 7, 10343–10369, 2007
www.atmos-chem-phys-discuss.net/7/10343/2007/ © Author(s) 2007. This work is licensed
under a Creative Commons License.
Atmospheric Chemistry and Physics Discussions
Formation and characteristics of ions and
charged aerosol particles in a native
Australian Eucalypt forest
T. Suni1, M. Kulmala1, A. Hirsikko1, T. Bergman2, L. Laakso1, P. P. Aalto1, R. Leuning3, H. Cleugh3, S. Zegelin1, D. Hughes3, E. van Gorsel3, M. Kitchen3, M. Vana4,1, U. H ˜orrak4, S. Mirme4, A. Mirme4, J. Twining5, and C. Tadros5
1
Department of Physical Sciences, P.O. Box 64, 00014 University of Helsinki, Finland
2
Center for high-performance computing and networking CSC, P.O. BOX 405, 02101 Espoo, Finland
3
CSIRO Marine and Atmospheric Research, GPO Box 1666, Canberra ACT 2601, Australia
4
Institute of Physics, University of Tartu, ¨Ulikooli Str. 18, EE2400 Tartu, Estonia
5
Institute for Environmental Research, ANSTO, PMB 1, Menai NSW 2234, Australia Received: 15 June 2007 – Accepted: 5 July 2007 – Published: 18 July 2007 Correspondence to: T. Suni ([email protected])
ACPD
7, 10343–10369, 2007 Ions in an Australian Eucalypt forest T. Suni et al. Title Page Abstract Introduction Conclusions References Tables Figures ◭ ◮ ◭ ◮ Back CloseFull Screen / Esc
Printer-friendly Version
Interactive Discussion
EGU Abstract
Biogenic aerosol formation is likely to contribute significantly to the global aerosol load. In recent years, new-particle formation (NPF) has been observed in various ecosys-tems around the world but hardly any measurements have taken place in the terrestrial Southern Hemisphere. Here, we report the first results of atmospheric ion and charged
5
particle concentrations as well as of NPF in a Eucalypt forest in Tumbarumba, South-East Australia, from July 2005 to October 2006. The measurements were carried out with an Air Ion Spectrometer (AIS) with a size range from 0.34 to 40 nm. Daytime aerosol formation took place on 52% of days with acceptable data. Median growth rates (GR) for negative/positive 1.3–3 nm particles were 2.29/2.02 nmh−1; for 3–7 nm
10
particles 3.04/2.94 nmh−1; and for 7–20 nm particles 7.13/5.62 nmh−1, respectively. In-termediate ion growth rates were highest when the wind was blowing from the direction of the native Eucalypt forest, suggesting that the Eucalypts were the strongest source of condensable vapours. Average cluster ion (0.34 to 1.8 nm) concentrations were very high, 2400/1700 cm−3for negative/positive ions compared to other measurements
15
around the world. These high concentrations are probably the result of the strong radon efflux from the soils around the Tumbarumba field site. Furthermore, comparison be-tween nighttime and daytime concentrations supported the view that cluster ions are produced close to the surface within the boundary layer also at night but that large ions are mostly produced in daytime. Finally, a previously unreported phenomenon,
noc-20
turnal aerosol formation, appeared on 32% of the analysed nights but was clustered almost entirely within six months from summer to autumn in 2006. From January to May, nocturnal formation was 2.5 times as frequent as daytime formation. Therefore, it appears that in summer and autumn, nocturnal production was the major mechanism for aerosol formation in Tumbarumba.
ACPD
7, 10343–10369, 2007 Ions in an Australian Eucalypt forest T. Suni et al. Title Page Abstract Introduction Conclusions References Tables Figures ◭ ◮ ◭ ◮ Back CloseFull Screen / Esc
Printer-friendly Version
Interactive Discussion
EGU 1 Introduction
The influence of aerosol particles on climate is the largest uncertainty in current climate models. Aerosols are produced by human activity but they are also formed naturally in oceans, deserts, and forests. Observations made during the last decade or so demon-strate clearly that production of new aerosol particles by nucleation and subsequent
5
nuclei growth is a frequent phenomenon that takes place in most atmospheric environ-ments (e.g. Kulmala et al., 2004). Later analyses have shown that this phenomenon is capable of affecting particle number concentrations even at global scales (Spracklen et al., 2006). At regional scales, atmospheric aerosol formation is likely to affect the population of CCN (cloud condensation nuclei) particles influencing cloud properties
10
and thereby climate (Kerminen et al., 2005; Laaksonen et al., 2005). Determining the magnitude and driving factors of biogenic aerosol production in different ecosystems is crucial for future development of climate models.
Air ions exist everywhere in the Earth’s atmosphere (e.g. Isra ¨el, 1970; Arnold et al., 1977; H ˜orrak, 2001; Eichkorn et al., 2002; Lee et al., 2003). They participate
15
in different atmospheric processes like cloud dynamics and precipitation (Pruppacher and Klett, 1997, Laakso et al., 2003; Andronache et al., 2006). Through ion-mediated nucleation, ions act also as one pathway to new aerosol particle formation (e.g. Yu and Turco, 2001). The role of ions in atmospheric aerosol formation has remained a controversial topic (H ˜orrak et al., 1998; Tammet et al., 1988; Turco et al., 1998; Yu
20
and Turco 2001; Laakso et al., 2002, 2007; Lee et al., 2003; Kazil and Lovejoy 2004; Lovejoy et al., 2004; Eisele et al., 2006; Kanawade and Tripathi, 2006; Yu, 2006). Some of the studies made so far suggest that the contribution of ion-induced nucleation to the total nucleation rate is important or even dominant, whereas some other studies indicate that the role of ions in aerosol formation is negligible.
25
So far, most studies of aerosol production in land ecosystems have taken place at continental and coastal sites in the Northern Hemisphere (Kulmala et al., 2004). In or near Australia, earlier studies on ultrafine aerosol particles have focussed mainly on
ACPD
7, 10343–10369, 2007 Ions in an Australian Eucalypt forest T. Suni et al. Title Page Abstract Introduction Conclusions References Tables Figures ◭ ◮ ◭ ◮ Back CloseFull Screen / Esc
Printer-friendly Version
Interactive Discussion
EGU biomass burning (Keywood et al., 2000; Gras et al., 1999; Generoso et al., 2003) and
processes in the coastal or marine boundary layer or in the middle or free troposphere (Johnson et al., 2005; Gras, 1991; Bates et al., 2000; Zaizen et al., 1996).
In the largely uninhabited continental Australia, studies of biogenic aerosol produc-tion have been very scarce. Simoneit et al. (1991) compared extractable organic matter
5
in >300 nm particles in SE Australia and coastal New Zealand and demonstrated that the aerosols were mainly biogenic rather than anthropogenic. They also found a rea-sonable fit between the aerosol and local plant extract. Later, Morawska et al. (2007)1, observed nucleation mode particles (>8 nm) at three sites ranging from semi-urban to remote in tropical Northern Territory over 2–5 days in July 1998. Jimi et al. (2003) found
10
that the observed diurnal variation in nano-particle concentrations at the Cape Grim meteorological station on the northwest coast of Tasmania was linked to air masses from continental Australia, yielding daytime peak concentrations consistent with sec-ondary aerosol production by photochemical processes.
Australia is a vast island continent the size of Europe in the Southern Hemisphere.
15
It is home to more than 500 Eucalypt species with so far unknown aerosol-forming po-tential. In the present paper we describe the first air ion measurements in an evergreen Eucalypt forest in Tumbarumba, New South Wales (NSW), South-East Australia. We focus on new-particle formation (NPF) events, their frequency, seasonal variation, and on the size-dependent growth rates of the particles. We study also the effect of
mete-20
orological variables on NPF. This study is a step towards determining the contribution of forests to the global aerosol load.
1
Thomas, S., Morawska, L., Akber, R., Quintarelli, F., Martin P., Ryan, B., and Keogh, D. U.: The source and behaviour of submicrometre airborne particles at a site in remote Northern Australia, Atmos. Environ., in preparation, 2007.
ACPD
7, 10343–10369, 2007 Ions in an Australian Eucalypt forest T. Suni et al. Title Page Abstract Introduction Conclusions References Tables Figures ◭ ◮ ◭ ◮ Back CloseFull Screen / Esc
Printer-friendly Version
Interactive Discussion
EGU
2 Materials and methods
2.1 Site and station description
The Tumbarumba flux station is located in the Bago State forest in south eastern New South Wales, about 100 km west from Canberra, at 35◦39′20.6′′S 148◦09′07.5′′E. The dominant species in this tall open Eucalypt forest are E. delegatensis (Alpine Ash) and
5
E. dalrympleana (Mountain Gum) with average tree height of 40 m. The elevation of
the site is 1200 m and the mean annual precipitation 1500 mm with considerable inter-and intra-annual variation. The 48 400 ha of native forest have been managed for wood production for over 100 years.
The instrument mast is 70 m tall. Fluxes of heat, water vapour and carbon dioxide are
10
measured using the open-path eddy flux technique (Leuning et al., 2005). Supplemen-tary measurements above the canopy include temperature, humidity, wind speed, wind direction, rainfall, incoming and reflected shortwave radiation and net radiation. Pro-files of temperature, humidity and CO2are measured at nine levels within the canopy. Continuous measurements in the soil include soil moisture, soil heat fluxes, and
tem-15
perature.
2.2 Aerosol measurements
The total concentration of ultrafine aerosol particles (lower detection limit ∼14 nm) was measured with a condensational particle counter (CPC), TSI model 3010, at the height of 70 m on the tower in a box housing the pump, the CPC, the butanol bottle, tubing
20
and electronics.
We detected NPF by measuring size distributions of air ions (naturally charged clus-ters and aerosol particles) from July 2005 to October 2006 with an Air Ion Spectrometer (AIS). The AIS (Airel Ltd., Estonia) measures the mobility distribution of both negative and positive air ions in the range of 2.4 to 0.0075 cm2V−1s−1. This corresponds to
25
ACPD
7, 10343–10369, 2007 Ions in an Australian Eucalypt forest T. Suni et al. Title Page Abstract Introduction Conclusions References Tables Figures ◭ ◮ ◭ ◮ Back CloseFull Screen / Esc
Printer-friendly Version
Interactive Discussion
EGU to 1.8 nm) to intermediate (1.8 to 7.5 nm) and to large ions (15–40 nm). The largest
observed ions belong to the Aitken mode (25–100 nm).
The AIS consists of two cylindrical aspiration-type Differential Mobility Analysers (DMA), one for positive and one for negative ions. Each mobility analyser has 21 collector electrodes provided with individual electrometrical amplifiers for measuring
5
the electrical current carried by ions of different mobilities (Mirme et al., 2007). The AIS was located in a shed on the ground next to the instrument tower. The copper inlet tube (id 5 cm, length 60 cm) was led through the wall at approximately 1.5 m height.
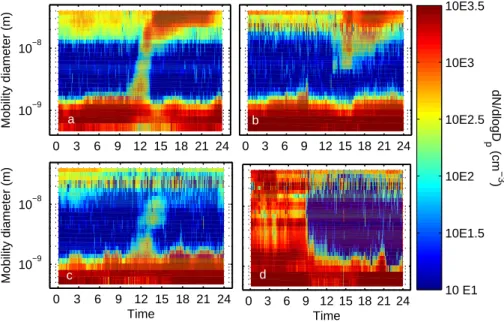
After filtering out days when measurement breaks prevented unambiguous event determination, we classified NPF as follows (Fig. 1): normal – formation starts from
10
cluster ions and continues to Aitken mode; interrupted – formation starts from cluster ions but does not reach Aitken mode; Aitken – formation starts from intermediate or large ions and takes place mainly in the Aitken mode; unclear – days that did not fit into any of the previous three daytime categories. Finally, nocturnal – sudden, mostly nocturnal appearance of large quantities of ions usually in all size classes at the same
15
time but always at least in intermediate ions.
3 Results and discussion
3.1 New-particle formation events 3.1.1 Event types and seasonal variation
A typical normal formation event (Fig. 1a) occurred during daytime, starting usually
be-20
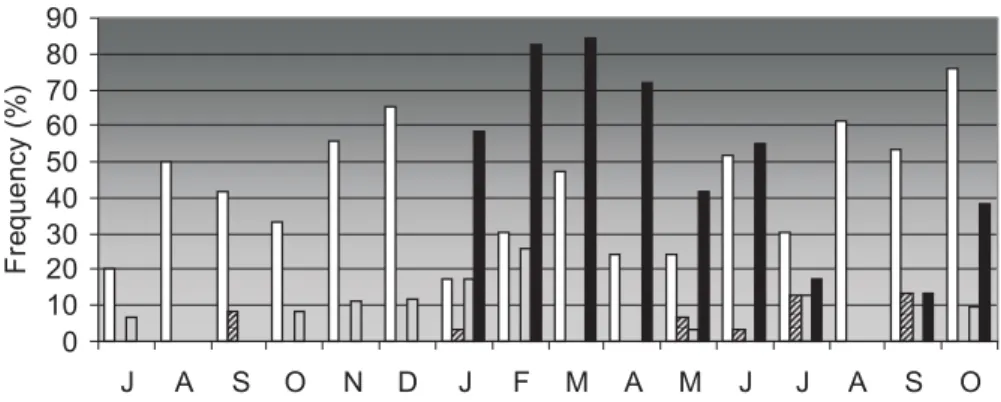
tween 08:00 and 10:00 and continuing to 15:00–24:00. The daytime events appeared to have a peak from late winter to early summer (August to December) and a minimum from mid-summer to autumn (January–May, Fig. 2, Table 1) but these patterns were not entirely consistent, as more events occurred in March 2006 than in October 2005. Winter did not exhibit a clear pattern of NPF as the first winter month, June 2006,
ACPD
7, 10343–10369, 2007 Ions in an Australian Eucalypt forest T. Suni et al. Title Page Abstract Introduction Conclusions References Tables Figures ◭ ◮ ◭ ◮ Back CloseFull Screen / Esc
Printer-friendly Version
Interactive Discussion
EGU produced a lot of formation events but the surrounding months, May and July, did not
(Fig. 2).
During summer, autumn, and early winter (January–June) we observed a previously unreported phenomenon, nocturnal aerosol formation (Fig. 1d), where large numbers of ions appeared in most size classes at the same time during the night. Unlike daytime
5
events, these nocturnal events had a clear seasonal pattern: they emerged for the first time in January 2006 and continued strongly until June (Fig. 2, Table 1). They reappeared in much weaker form in July, September, and October. We were able to exclude instrument malfunction as a potential cause because an SMPS observed the same phenomenon during a 5-week campaign in May–June 2006 (not shown).
10
On average, a daytime formation event took place on 52% of the days with accept-able data (Taccept-able 1). This is 1.9 to 3.4 times as often as in the Nordic boreal zone (Dal Maso et al., 2007). The cold and dark winter in the north reduces the amount of condensable vapours and necessary photochemistry and is one very likely reason for this difference. Another one could be the particularly clean air in Tumbarumba (see
15
Sect. 3.2.1.). Accumulation-mode particles (100–1000 nm) scavenge freshly nucleated particles effectively (coagulation sink) and also form a large surface for the condensa-tion of organic vapours (condensacondensa-tional sink). In clean air, the organic vapours are available for condensational growth of the freshly nucleated particles.
Strong nocturnal formation took place in 32% of the analysed nights and almost all
20
of these events were clustered within six months from January to June 2006. From January to May, nocturnal formation occurred 2.5 times as often as daytime formation. Therefore it appears that in summer and autumn, nocturnal production was the major mechanism for aerosol formation in Tumbarumba. So far, nocturnal formation has not been reported to this degree at any other site around the world.
25
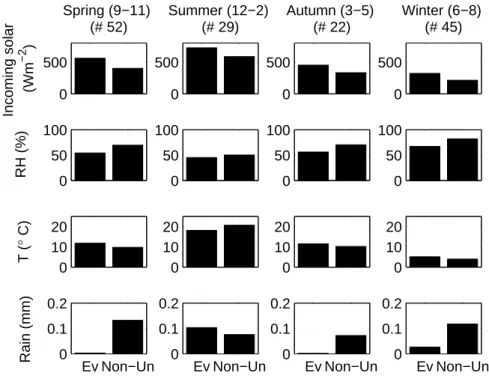
3.1.2 Meteorological variables
Regardless of season, solar radiation was always higher during formation events than on other days (Fig. 3). This reflects the role of solar radiation in the formation of OH−
ACPD
7, 10343–10369, 2007 Ions in an Australian Eucalypt forest T. Suni et al. Title Page Abstract Introduction Conclusions References Tables Figures ◭ ◮ ◭ ◮ Back CloseFull Screen / Esc
Printer-friendly Version
Interactive Discussion
EGU and other atmospheric oxidants necessary in the particle formation process.
Tem-perature was higher on event days than on other days in spring, autumn, and winter, but lower in summertime, although solar radiation on summer event days was clearly higher than on other days. This suggests that in the darker and colder seasons, solar radiation is the more important driver of the two and temperature reflects the variation
5
of sunny/cloudy days. In summer, on the other hand, too high temperatures may sup-press condensational growth. As a result, the most conducive conditions for formation events in summertime were relatively cool, sunny days, but in all other seasons warm, sunny days were better for formation.
As observed in most previous studies (e.g. Hyv ¨onen et al., 2005), relative humidity
10
was always lower on event days than on other days, although in summertime RH was so low that the difference between event days and others was very small; both had an RH of about 50%. Formation events followed by particle growth were typically absent during precipitation, but intermediate ions always appeared in the size range 2–8 nm for the duration of the rain in the same way as in H ˜orrak et al. (2005 and 2006). The
15
suppressing effect of water vapour on particle formation is a well known but poorly understood phenomenon.
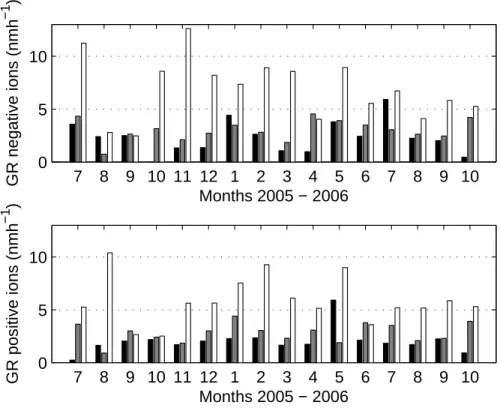
3.1.3 Growth rates
Median growth rates (GR) for negatively/positively charged 1.3–3 nm particles were 2.29/2.02 nmh−1, respectively; for 3–7 nm particles 3.04/2.94, and for 7–20 nm
parti-20
cles 7.13/5.62 nmh−1, respectively (Table 2). That median GR clearly increased with particle size was expected because large particles usually occur later during the day when there are more organic vapours to condense on them than in the morning: The emissions of terpenes from trees depend on temperature and/or photosynthesis. An-other reason is that condensation is weaker on the smaller particles (Kelvin effect).
25
Comparing GR among different sites around the world is difficult because the number of formation events and the size range used for GR determination vary. The GR in Tum-barumba are well within the range reported in Kulmala et al. (2004) but the only fully
ACPD
7, 10343–10369, 2007 Ions in an Australian Eucalypt forest T. Suni et al. Title Page Abstract Introduction Conclusions References Tables Figures ◭ ◮ ◭ ◮ Back CloseFull Screen / Esc
Printer-friendly Version
Interactive Discussion
EGU comparable observations at the moment are from a boreal forest in Hyyti ¨al ¨a,
south-ern Finland, where the average GR for 3–7 nm particles were 2–4 nmh−1, the same as in Tumbarumba, but where the 1.3–3 nm and 7–20 nm particles grew slower at <2 and 4–5 nmh−1, respectively (Hirsikko et al., 2005); for large negative particles, the GR in Tumbarumba was 50% greater than in Hyyti ¨al ¨a. In the only other terrestrial
mea-5
surements made in non-urban Australia (within the Kakadu National Park in tropical Northern Territory), Morawska et al. (2007)1report one value, 5 nmh−1, for 10 to 20 nm particles in Jabiru Town, the least remote location of the three studied. In Jabiru Town, the formation events were quick and short (only a couple of hours), and the authors mention that at Gimbat, the most remote bushland site, the GR were lower and the
10
events took several hours. They attributed this to the lower background concentration of pre-existing aerosol at Gimbat. Indeed, if pre-existing aerosol is abundant GR must be large in order to compensate for the large coagulation sink that scavenges the newly formed particles (Kulmala et al., 2004). In a cleaner area, even particles with smaller GR can reach detectable sizes. Because the GR in Tumbarumba were as large or
15
larger than in Hyyti ¨al ¨a although the background concentrations in general were lower (Sect. 3.2.1), it appears that the source of condensing vapours was stronger than in Hyyti ¨al ¨a and enabled the particles to grow fast although conditions would have allowed for slower growth, too.
The GR for large ions was highest in summer from October/November to May
20
(Fig. 4). This is typical around the world and consistent with organic vapours form-ing a large part of the condensform-ing matter as their concentrations should be highest in summertime (Kulmala et al., 2004; Dal Maso et al., 2007). No clear seasonal pattern was evident for intermediate or cluster ions (Fig. 4). This suggests that substances other than organic vapours, such as sulphuric acid, have an important role in the
con-25
densational growth of these particles.
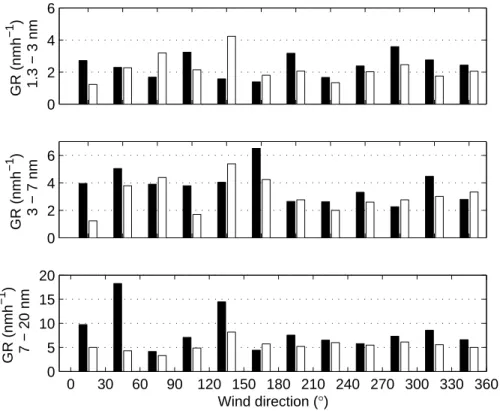
However, GR for intermediate ions was almost twice as high when wind was coming from the east (0–180◦) compared to when it was coming from the west (180–360◦) (Fig. 5). The east sector consists mainly of mountainous terrain and native Eucalypt
ACPD
7, 10343–10369, 2007 Ions in an Australian Eucalypt forest T. Suni et al. Title Page Abstract Introduction Conclusions References Tables Figures ◭ ◮ ◭ ◮ Back CloseFull Screen / Esc
Printer-friendly Version
Interactive Discussion
EGU forests and woodlands, whereas the west sector is mainly agricultural lowland dotted
with Eucalypt woodlands. This would indicate that the source of some condensating vapours was stronger in the thick, tall Eucalypt forest areas than in the agricultural fields. Indeed, the far larger biomass of tall open Eucalypt forests should produce larger amounts of organic vapours than the agricultural lowlands. It is unclear why the
5
same did not apply for the larger ions. 3.2 Ion and aerosol concentrations
3.2.1 Ultrafine particle concentration
Average ultrafine particle (>14 nm) concentration was about 1200 cm−3with a median of 900 cm−3in Tumbarumba (not shown). This was lower than in Kakadu (Morawska et
10
al., 20071): the average background concentrations of 8 to 400 nm particles there were consistently around 2000 cm−3, similarly to Hyyti ¨al ¨a, where for 3–1000 nm particles the average is around 2300 and the median around 1850 cm−3 (M. Dal Maso, personal communication). The difference in the lower size limit of these measurements is not very significant except during a formation event; usually size classes between 3 and
15
14 nm are more or less empty. In clean rural areas along a train track from Moscow to Vladivostok, concentrations of 3–950 nm particles were higher at 4300 (average) and 2600 (median) cm−3(Vartiainen et al., 2007). Compared to Finland and a large part of Russia (such as close to the Baykal-Amur railway), Australia is very sparsely populated and cities are mostly spread over a large area. Nighttime concentrations even in cities
20
such as in central Brisbane can sometimes be as low as the Kakadu background, 2000 cm−3 (L. Morawska, personal communication) The background concentrations in the forested mountains of Tumbarumba appear, therefore, to represent very clean air.
ACPD
7, 10343–10369, 2007 Ions in an Australian Eucalypt forest T. Suni et al. Title Page Abstract Introduction Conclusions References Tables Figures ◭ ◮ ◭ ◮ Back CloseFull Screen / Esc
Printer-friendly Version
Interactive Discussion
EGU 3.2.2 Ion concentrations
Observations of ion concentrations and dynamics in the field are essential for better understanding of ion and new-particle production and growth. The relative concentra-tions of positive and negative ions vary around the world but the underlying reasons are still largely unknown. Theoretically, ion-induced nucleation especially with negative
5
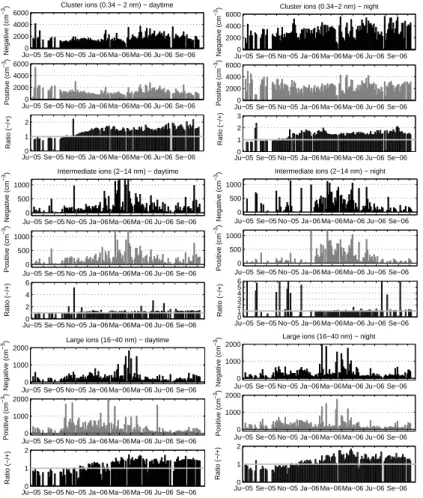
ions requires less energy than homogeneous nucleation (Kusaka et al., 1995; Lovejoy et al., 2004; Laakso et al., 2007). In Tumbarumba, positive and negative cluster ion concentrations were approximately equal until spring 2006, after which negative con-centrations increased until they were approximately 1.4-fold compared to positive ones (Figs. 6a and d). A clear imbalance was also observed in Russia with more negative
10
than positive cluster ions (Vartiainen et al., 2007) and in the Alps in Jungfraujoch with more positive than negative ions (Vana et al., 2006). In Tumbarumba, the same applied also to large ions, except that in the beginning of the measuring period, positive ions were more abundant than negative (Figs. 6c and f). In Russia, large positive ion con-centration similarly exceeded that of negative but only slightly (Vartiainen et al., 2007).
15
Intermediate ions in Tumbarumba were usually in balance (Fig. 6).
Typically, the daytime concentrations of intermediate ions reflect daytime formation events. However, in March and April 2006 also the nocturnal type extended partly to daytime in the morning and early evening and together, these daytime and noctur-nal formation events produced the highest daytime concentrations of the whole period
20
(Fig. 6). The nighttime concentrations of the intermediate ions (Fig. 6) reflected the nocturnal formation and its very strong seasonal variability. The nighttime concen-trations were often higher than daytime concenconcen-trations but this does not necessarily indicate that aerosol formation was stronger at night than in daytime: At night, the particles accumulate in a shallower boundary layer than in daytime.
25
In addition to formation events, intermediate ions also appeared during rain. How-ever, no growth was evident during these rain events and the sizes of the appearing intermediate particles were small, only 2–8 nm. This is in agreement with earlier
find-ACPD
7, 10343–10369, 2007 Ions in an Australian Eucalypt forest T. Suni et al. Title Page Abstract Introduction Conclusions References Tables Figures ◭ ◮ ◭ ◮ Back CloseFull Screen / Esc
Printer-friendly Version
Interactive Discussion
EGU ings in Hyyti ¨al ¨a (H ˜orrak et al., 2006; Hirsikko et al., 2007a). The concentrations of
negative ions usually increased more than those of positive ions: The strong peaks up to 5-fold –/+ ratio were mainly due to rain events (Fig. 6).
On average, negative (positive) cluster ion concentrations were about 2400 (1700) cm−3 which is much higher than the 600–800 cm−3 in Hyyti ¨al ¨a (Hirsikko et al.,
5
2005) or the 300 (600) cm−3for negative (positive) ions at alpine Jungfraujoch (Vana et al., 2006). The Tumbarumba concentrations are even higher than the 1400 (630) cm−3 found in Russia (Vartiainen et al., 2007) that were found to correlate with radon con-centrations that, at maximum, were high enough to produce up to 30 ion pairs cm−3s−1. The very high cluster ion concentrations in Tumbarumba imply that the ion production
10
rate is as much as 50–100 ion pairs cm−3s−1, which is 5–20 times more than values obtained in Hyyti ¨al ¨a (Hirsikko et al., 2007b). This would indicate the presence of a very efficient ion source such as high efflux of radon from the Tumbarumba soil. Accu-mulation of atmospheric radon from the ground source could also be linked to the very strong nocturnal ion production in summer and autumn. Another indication towards the
15
important role played by radon is that the highest ion concentrations in Tumbarumba usually took place in the early morning which is frequently when inversions and ac-cumulation of radon occur. Indeed, two days of measurements revealed very high concentration of radon in Tumbarumba that ranged from 9 to 102 Bqm−3on the ground (not shown). In Hyyti ¨al ¨a, typical radon concentrations at a few metres above the ground
20
are only 1–2 Bqm−3(Hirsikko et al., 2007b).
Median small intermediate ion concentrations (1.6–6.3 nm) in Tumbarumba were about 94 cm−3 for both polarities. This is roughly the same as in Hyyti ¨al ¨a where in-termediate ions of the same size remained usually below 200 cm−3 (Hirsikko et al., 2005). Median concentrations of large ions from 16 to 40 nm were 220–240 cm−3 for
25
both polarities in Tumbarumba.
Comparing particle concentrations in the high daytime boundary layer (DBL) and the shallower nocturnal boundary layer (NBL) can give some indication as to when and where particles of different sizes are formed. In Tumbarumba, median cluster ion
ACPD
7, 10343–10369, 2007 Ions in an Australian Eucalypt forest T. Suni et al. Title Page Abstract Introduction Conclusions References Tables Figures ◭ ◮ ◭ ◮ Back CloseFull Screen / Esc
Printer-friendly Version
Interactive Discussion
EGU concentrations were 80% higher at night than in daytime (Table 3). This combined with
the short lifetime of cluster ions (<2–3 min) suggests that the clusters are produced both within DBL and NBL but because DBL is higher and better mixed than NBL, cluster concentrations are diluted during daytime. On the contrary, no clear difference between day and night concentrations was evident for large ions. This means that they must be
5
produced mainly in daytime or, theoretically, above NBL. Nothing produced above NBL can be seen inside it, because the inversion prevents mixing between NBL and the residual layer above it.
These results support the idea that the main producer of cluster ions is radon ef-flux from the ground. The sources of large ions within the boundary layer are most
10
likely daytime and nighttime aerosol formation and long-range transport from pollution sources. Assuming that the sinks of the ions stay the same in daytime and nighttime, the sum of these sources appears to be stronger in daytime than in nighttime – if this was not the case, accumulation in the shallower NBL would lead to a similar diurnal pattern as for the cluster ions.
15
4 Conclusions
High radon efflux from the soil most likely led to higher average cluster ion concentra-tions than reported anywhere else so far. Comparison between nighttime and daytime concentrations supported the view that cluster ions are produced close to the surface within the boundary layer also at night but that large ions are mostly produced in
day-20
time.
On average, a daytime formation event took place on 52% of days with acceptable data during the measuring period (Table 1). This is 2–3 times as often as in the Nordic boreal zone. The particularly clean air in Tumbarumba and the lack of a cold and dark winter are likely reasons for this difference. The most conducive conditions for
25
formation events in summertime were cool, dry, sunny days, but in all other seasons, warm, dry days were better for formation than cool ones. Intermediate ion growth rates
ACPD
7, 10343–10369, 2007 Ions in an Australian Eucalypt forest T. Suni et al. Title Page Abstract Introduction Conclusions References Tables Figures ◭ ◮ ◭ ◮ Back CloseFull Screen / Esc
Printer-friendly Version
Interactive Discussion
EGU were highest when the air was coming from the native forest which suggests that the
Eucalypts were a strong source of condensable vapours.
GR for large ions was highest in summer and suggests that organic vapours, side products of photosynthesis, form a large part of the condensing matter. That no clear seasonal pattern was evident for intermediate or cluster ion GR indicates that other
5
substances such as sulphuric acid have an important role in the condensational growth of these particles.
A previously unreported phenomenon, nocturnal aerosol production, was observed from summer to early winter. It appeared on 32% of the analysed nights and almost entirely within six months from January to June in 2006. From January to May, it
10
occurred 2.5 times as often as daytime formation. Therefore, it appears that in summer and autumn, nocturnal production was the major mechanism for aerosol formation in Tumbarumba.
Acknowledgements. This work was supported by the Academy of Finland, Maj and Tor
Nessling Foundation, and the Centennial Foundation of Helsingin Sanomat. Support for the
15
Tumbarumba flux tower facility and its operation was provided both by CSIRO and the Australian Greenhouse Office’s Australian Climate Change Science Program. Funding for the aerosol pro-gram was also provided by the New South Wales Environmental Trusts.
References
Andronache, C., Gr ¨onholm, T., Laakso, L., Phillips, V., and Ven ¨al ¨ainen, A.: Scavenging of
20
ultrafine particles by rainfall at a boreal site: observations and model estimations, Atmos. Chem. Phys., 6, 4739–4754, 2006,
http://www.atmos-chem-phys.net/6/4739/2006/.
Arnold, F., Krankowsky, D., and Marien, K. H.: First mass spectrometric measurements of positive ions in the stratosphere, Nature, 267, 30–32, 1977.
25
Bates, T. S., Quinn, P. K., Covert, D. S., Coffman, D. J., Johnson, J. E., and Wiedensohler, A.: Aerosol physical properties and processes in the lower marine boundary layer: a comparison of shipboard sub-micron data from ACE-1 and ACE-2, Tellus, 52B, 258–272, 2000.
ACPD
7, 10343–10369, 2007 Ions in an Australian Eucalypt forest T. Suni et al. Title Page Abstract Introduction Conclusions References Tables Figures ◭ ◮ ◭ ◮ Back CloseFull Screen / Esc
Printer-friendly Version
Interactive Discussion
EGU Dal Maso, M., Sogacheva, L., Aalto, P. P., Riipinen, I., Komppula, M., Tunved, P., Korhonen,
L., Suur-Uski, V., Hirsikko, A., Kurt ´en, T., Kerminen, V.-M., Lihavainen, H., Viisanen, Y., Hansson, H.-C., and Kulmala, M.: Aerosol size distribution measurements at four Nordic field stations: identification, analysis and trajectory analysis of new particle formation bursts, Tellus B, 59(3), 350–361, doi:10.1111/j.1600-0889.2007.00267.x, 2007.
5
Eichkorn, S., Wilhelm, S., Aufmhoff, H., Wohlfrom, K. H., and Arnold, F.: Cosmic ray-induced aerosol-formation: First observational evidence from aircraft-based ion mass spec-trometer measurements in the upper troposphere, Geophys. Res. Lett., 29(14), 1698, doi:10.1029/2002GL015044, 2002.
Eisele, F. L., Lovejoy, E. R., Kosciuch, E., Moore, K. F., Mauldin III, R. L., Smith, J. N.,
Mc-10
Murry, P. H., and Iida, K.: Negative atmospheric ions and their potential role in ion-induced nucleation, J. Geophys. Res., 111, D04305, doi:10.1029/2005JD006568, 2006.
Generoso, S., Breon, F. M., Balkanski, Y., Boucher, O., and Schulz, M.: Improving the seasonal cycle and interannual variations of biomass burning aerosol sources, Atmos. Chem. Phys., 3, 1211–1222, 2003,
15
http://www.atmos-chem-phys.net/3/1211/2003/.
Gras, J. L., Jensen, J. B., Okada, K., Ikegami, M., Zaizen, Y., and Makino, Y.: Some optical properties of smoke aerosol in Indonesia and tropical Australia, Geophys. Res. Lett., 26(10), 1393–1396, 1999.
Gras, J. L.: Southern Hemisphere tropospheric aerosol microphysics, J. Geophys. Res.,
20
96(D3), 5345–5356, 1991.
Hirsikko, A., Bergman, T., Laakso, L., Dal Maso, M., Riipinen, I., H ˜orrak, U., and Kulmala, M.: Identification and classification of the formation of intermediate ions measured in boreal forest, Atmos. Chem. Phys., 7, 201–210, 2007a.
Hirsikko, A., Laakso, L., H ˜orrak, U., Aalto, P. P, Kerminen, V.-M., and Kulmala, M.: Annual and
25
size dependent variation of growth rates and ion concentrations in boreal forest, Boreal Env. Res., 10, 357–369, 2005.
Hirsikko, A., Paatero, J., Hatakka, J., and Kulmala, M.: The 222Rn activity concentration, ex-ternal radiation dose rate and air ion production rate in a boreal forest in Finland between March 2000 and June 2006, Boreal Env. Res., 12, 265–278, 2007b.
30
H ˜orrak, U.: Air ion mobility spectrum at a rural area, PhD thesis, University of Tartu, 158pp., 2001.
Geo-ACPD
7, 10343–10369, 2007 Ions in an Australian Eucalypt forest T. Suni et al. Title Page Abstract Introduction Conclusions References Tables Figures ◭ ◮ ◭ ◮ Back CloseFull Screen / Esc
Printer-friendly Version
Interactive Discussion
EGU phys. Res., 103, 13 909–13 915, 1998.
H ˜orrak, U., Tammet, H., Aalto, P. P., Vana, M., Hirsikko, A., Laakso, L., and Kulmala, M.: Formation of charged nanometer aerosol particles associated with rainfall, Abstracts of the European Aerosol Conference 2005, Ghent, edited by: Maenhaut, W., p.606, 2005.
H ˜orrak, U., Tammet, H., Aalto, P. P., Vana, M., Hirsikko, A., Laakso, L., and Kulmala, M.:
Forma-5
tion of charged nanometer aerosol particles associated with rainfall: Atmospheric measure-ments and lab experiment, Proceedings of BACCI, NECC and FCoE activities 2005, Report Series in Aerosol Sciences, 81A, 180–185, 2006.
Hyv ¨onen, S., Junninen, H., Laakso, L., Dal Maso, M., Gr ¨onholm, T., Bonn, B., Keronen, P., Aalto, P., Hiltunen, V., Pohja, T., Launiainen, S., Hari, P., Mannila, H., and Kulmala, M.: A
10
look at aerosol formation using data mining techniques, Atmos. Chem. Phys., 5, 3345–3356, 2005,
http://www.atmos-chem-phys.net/5/3345/2005/.
Isra ¨el, H.: Atmospheric electricity, vol. 1: Fundamentals, conductivity, ions, Israel Program for Scientific Translations, Jerusalem, 1970.
15
Jimi, S. I., Gras, J. L., Siems, S. T., and Krummel, P. B.: Nanoparticles at Cape Grim, Tasmania, in: Cape Grim Baseline Air Pollution Station Annual Science Meeting: abstracts, CSIRO Atmospheric Research, edited by: Cainey, J. M. and Derek, N., Aspendale, Vic.: CSIRO Atmospheric Research; Bureau of Meteorology, p.24, 2003.
Johnson, G. R., Ristovski, Z. D., D’Anna, B., and Morawska, L.: Hygroscopic
behav-20
ior of partially volatilized coastal marine aerosols using the volatilization and humidifi-cation tandem differential mobility analyzer technique, J. Geophys. Res., 110, D20203, doi:10.1029/2004JD005657, 2005.
Kanawade, V. and Tripathi, S. N.: Evidence for the role of ion-induced particle formation dur-ing an atmospheric nucleation event observed in Tropospheric Ozone Production about
25
the Spring Equinox (TOPSE), J. Geophys. Res., 111, D02209, doi:10.1029/2005JD006366, 2006.
Kazil, J. and Lovejoy, E. R.: Tropospheric ionization and aerosol production: A model study, J. Geophys. Res., 109, D19206, doi:10.1029/2004JD004852, 2004.
Kerminen, V.-M., Lihavainen, H., Komppula, M., Viisanen, Y., and Kulmala, M.: Direct
observa-30
tional evidence linking atmospheric aerosol formation and cloud droplet activation, Geophys. Res. Lett., 32, L14803, doi:10.1029/2005GL023130, 2005.
ACPD
7, 10343–10369, 2007 Ions in an Australian Eucalypt forest T. Suni et al. Title Page Abstract Introduction Conclusions References Tables Figures ◭ ◮ ◭ ◮ Back CloseFull Screen / Esc
Printer-friendly Version
Interactive Discussion
EGU aerosol in Launceston, Australia, during winter 1997, Air and Waste Manage. Assoc., 50,
418–427, 2000.
Kulmala, M., Vehkam ¨aki, H., Pet ¨aj ¨a, T., Dal Maso, M., Lauri, A., Kerminen, V.-M., Birmili, W., and McMurry, P. H.: Formation and growth rates of ultrafine atmospheric particles: A review of observations, J. Aerosol Sci., 35, 143—176, 2004.
5
Kusaka, I., Wang, Z.-G., and Seinfeld, J. H.: Ion-induced nucleation, II, Polarizable multipolar molecules, J. Chem. Phys., 103, 8993–9009, 1995.
Laakso, L., Gagn ´e, S., Pet ¨aj ¨a, T., Hirsikko, A., Aalto, P. P., Kulmala, M., and Kerminen, V.-M.: Detecting charging state of ultra-fine particles: instrumental development and ambient measurements, Atmos. Chem. Phys., 7, 1333–1345, 2007,
10
http://www.atmos-chem-phys.net/7/1333/2007/.
Laakso, L., Lehtinen, K., and Kulmala, M.: The effect of condensation rate enhancement factor on 3-nm particle formation in binary ion-induced and homogeneous nucleation, J. Geophys. Res., 108(D18), 4574, doi:10.1029/2003JD003432, 2003.
Laakso, L., M ¨akel ¨a, J. M., Pirjola, L., and Kulmala, M.: Model studies on ion-induced nucleation
15
in the atmosphere, J. Geophys. Res., 108(D20), 4427, doi:10.1029/2002JD002140, 2002. Laaksonen, A., Hamed, A., Joutsensaari, J., Hiltunen, L., Cavalli, F., Junkermann, W., Asmi, A.,
Fuzzi, S., and Facchini, M. C.: Cloud condensation nuclei production from nucleation events at a highly polluted region, Geophys. Res. Lett., 32, L06812, doi:10.1029/2004GL022092, 2005.
20
Lee, S.-H., Reeves, J. M., Wilson, J. C., Hunton, D. E., Viggiano, A. A., Miller, T. M., Ballenthin, J. O., and Lait, L. R.: Particle formation by ion nucleation in the upper troposphere and lower stratosphere, Science, 301, 1886–1889, 2003.
Leuning, R., Cleugh, H. A., Zegelin, S. J., and Hughes, D.: Carbon and water fluxes over a temperate Eucalyptus forest and a tropical wet/dry savanna in Australia: measurements and
25
comparison with MODIS remote sensing estimates, Agric. For. Meteorol., 129, 151–173, 2005.
Lovejoy, E. R., Curtius, J., and Froyd, K. D.: Atmospheric ion-induced nucleation of sulfuric acid and water, J. Geophys. Res., 109, D08204, doi:10.1029/2003JD004460, 2004.
Mirme, A., Tamm, E., Mordas, G., Vana, M., Uin, J., Mirme, S., Bernotas, T., Laakso, L.,
30
Hirsikko, A., and Kulmala, M.: A wide-range multi-channel Air Ion Spectrometer, Boreal Env. Res., 12, 247–264, 2007.
ACPD
7, 10343–10369, 2007 Ions in an Australian Eucalypt forest T. Suni et al. Title Page Abstract Introduction Conclusions References Tables Figures ◭ ◮ ◭ ◮ Back CloseFull Screen / Esc
Printer-friendly Version
Interactive Discussion
EGU and enlarged edition with an introduction to cloud chemistry and cloud electricity, Springer,
976pp., 1997.
Simoneit, B. R. T., Crisp, P. T., Mazurek, M. A., and Standley, L. J.: Composition of extractable organic matter of aerosols from the Blue Mountains and Southeast coast of Australia, Envi-ronment International, 17, 405–419, 1991.
5
Spracklen, D. V., Carslaw, K. S., Kulmala, M., Kerminen, V.-M., Mann, G. W., and Sihto, S.-L.: The contribution of boundary layer nucleation events to total particle concentrations on regional and global scales, Atmos. Chem. Phys., 6, 5631–5648, 2006,
http://www.atmos-chem-phys.net/6/5631/2006/.
Tammet, H., Salm, J., and Iher, H.: Observation of condensation on small air ions in the
atmo-10
sphere, Lect. Notes Phys., 309, 239–240, 1988.
Turco, R. P., Zhao, J.-X., and Yu, F.: A new source of tropospheric aerosols: Ion-ion recombi-nation, Geophys. Res. Lett., 25, 635–638, 1998.
Vana, M., Hirsikko, A., Tamm, E., Aalto, P. P., Kulmala, M., Verheggen, B., Cozic, J., Wein-gartner, E., and Baltensperger, U.: Characteristics of air ions and aerosol particles at the
15
high-alpine research station Jungfraujoch, Proc. of the International Aerosol Conference, St. Paul, Minnesota, U.S., 10–15 September, 2006, 1427, 2006.
Vartiainen, E., Kulmala, M., Ehn, M., Hirsikko, A., Junninen, H., Pet ¨aj ¨a, T., Sogacheva, L., Kuokka, S., Hillamo, R., Skorokhod, A., Belikov, I., Elansky, N., and Kerminen, V.-M.: Ion and particle number concentrations and size distributions along the Trans-Siberian railroad,
20
Boreal Env. Res., 12, 375–396, 2007.
Yu, F. and Turco, R. P.: From molecular clusters to nanoparticles: Role of ambient ionization in tropospheric aerosol formation, J. Geophys. Res., 106, 4797–4814, 2001.
Yu, F.: From molecular clusters to nanoparticles: Second-generation ion-mediated nucleation model, Atmos. Chem. Phys., 6, 5193–5211, 2006,
25
http://www.atmos-chem-phys.net/6/5193/2006/.
Zaizen, Y., Ikegami, M., Tsutsumi, Y., Makino, Y., Okada, K., Jensen, J., and Gras, J. L.: Number concentration and size distribution of aerosol particles in the middle troposphere over the western Pacific Ocean, Atmos. Environ., 30, 1755–1762, 1996.
ACPD
7, 10343–10369, 2007 Ions in an Australian Eucalypt forest T. Suni et al. Title Page Abstract Introduction Conclusions References Tables Figures ◭ ◮ ◭ ◮ Back CloseFull Screen / Esc
Printer-friendly Version
Interactive Discussion
EGU Table 1. Frequency of daytime and nighttime formation events during July 2005–October 2006.
Classification as in Fig. 1.
Month Normal Interrupted Aitken Non-events Unclear days Data days Nocturnal events
July–05 3 0 1 1 10 15 0 Aug–05 4 0 0 1 2 8 0 Sep–05 5 1 0 4 2 12 0 Oct–05 8 0 2 2 12 24 0 Nov–05 15 0 3 5 4 27 0 Dec–05 17 0 3 1 5 26 0 Jan–06 5 1 5 3 15 29 17 Feb–06 7 0 6 0 10 23 19 March–06 9 0 0 0 10 19 16 April–06 6 0 0 0 19 25 18 May–06 7 2 1 1 18 29 12 June–06 15 1 0 0 13 29 16 July–06 7 3 3 1 9 23 4 Aug–06 16 0 0 2 8 26 0 Sep–06 8 2 0 0 5 15 2 Oct–06 16 0 2 0 3 21 8
ACPD
7, 10343–10369, 2007 Ions in an Australian Eucalypt forest T. Suni et al. Title Page Abstract Introduction Conclusions References Tables Figures ◭ ◮ ◭ ◮ Back CloseFull Screen / Esc
Printer-friendly Version
Interactive Discussion
EGU
Table 2. Median growth rates (nmh−1) for negative and positive ions of three size classes.
1.3–3 nm 3–7 nm 7–20 nm
– 2.29 3.04 7.13
ACPD
7, 10343–10369, 2007 Ions in an Australian Eucalypt forest T. Suni et al. Title Page Abstract Introduction Conclusions References Tables Figures ◭ ◮ ◭ ◮ Back CloseFull Screen / Esc
Printer-friendly Version
Interactive Discussion
EGU Table 3. Median ratio of nighttime and daytime concentrations of cluster ions (0.34–2 nm) and
large ions (16–40 nm).
0.34–2 nm 16–40 nm
– 1.9 1.1
ACPD
7, 10343–10369, 2007 Ions in an Australian Eucalypt forest T. Suni et al. Title Page Abstract Introduction Conclusions References Tables Figures ◭ ◮ ◭ ◮ Back CloseFull Screen / Esc
Printer-friendly Version Interactive Discussion EGU 0 3 6 9 12 15 18 21 24 10−9 10−8 Mobility diameter (m) a 0 3 6 9 12 15 18 21 24 b 0 3 6 9 12 15 18 21 24 10−9 10−8 Time Mobility diameter (m) c 0 3 6 9 12 15 18 21 24 Time d dN/dlogD p (cm −3 ) 10 E1 10E1.5 10E2 10E2.5 10E3 10E3.5
Fig. 1. Classification of new-particle formation in Tumbarumba: (a) normal, (b) Aitken, (c) inter-rupted, and (d) nocturnal (see Sect. 2.2 for explanation). At the bottom of each size distribution plot is the band of cluster ions (0.34–1.8 nm). At the top (∼25 to 40 nm) is the start of the Aitken mode. Particles between these two modes are called intermediate. Colour indicates the number concentration of particles.
ACPD
7, 10343–10369, 2007 Ions in an Australian Eucalypt forest T. Suni et al. Title Page Abstract Introduction Conclusions References Tables Figures ◭ ◮ ◭ ◮ Back CloseFull Screen / Esc
Printer-friendly Version Interactive Discussion EGU 0 10 20 30 40 50 60 70 80 90 J A S O N D J F M A M J J A S O F re quenc y (% )
Normal Interrupted Aitken Nocturnal
Fig. 2. Frequency of daytime and nighttime formation events during July 2005–October 2006; event classification as in Fig. 1.
ACPD
7, 10343–10369, 2007 Ions in an Australian Eucalypt forest T. Suni et al. Title Page Abstract Introduction Conclusions References Tables Figures ◭ ◮ ◭ ◮ Back CloseFull Screen / Esc
Printer-friendly Version Interactive Discussion EGU 0 500 Spring (9−11) (# 52) Incoming solar (Wm −2 ) 0 500 Summer (12−2) (# 29) 0 500 Autumn (3−5) (# 22) 0 500 Winter (6−8) (# 45) 0 50 100 RH (%) 0 50 100 0 50 100 0 50 100 0 10 20 T ( ° C) 0 10 20 0 10 20 0 10 20 Ev Non−Un 0 0.1 0.2 Rain (mm) Ev Non−Un 0 0.1 0.2 Ev Non−Un 0 0.1 0.2 Ev Non−Un 0 0.1 0.2
Fig. 3. Average meteorological variables on normal event days and on non-event/unclear days at 9–18. Each column corresponds to a season (months). The number of normal events per season is denoted as (#) at the top of each column.
ACPD
7, 10343–10369, 2007 Ions in an Australian Eucalypt forest T. Suni et al. Title Page Abstract Introduction Conclusions References Tables Figures ◭ ◮ ◭ ◮ Back CloseFull Screen / Esc
Printer-friendly Version Interactive Discussion EGU 7 8 9 10 11 12 1 2 3 4 5 6 7 8 9 10 0 5 10 GR negative ions (nmh −1 ) Months 2005 − 2006 7 8 9 10 11 12 1 2 3 4 5 6 7 8 9 10 0 5 10 GR positive ions (nmh −1 ) Months 2005 − 2006
Fig. 4. Monthly GR for three size classes of ions. Top – negative ions, bottom – positive ions. Black: 1.3–3 nm; grey: 3–7 nm; white: 7–20 nm.
ACPD
7, 10343–10369, 2007 Ions in an Australian Eucalypt forest T. Suni et al. Title Page Abstract Introduction Conclusions References Tables Figures ◭ ◮ ◭ ◮ Back CloseFull Screen / Esc
Printer-friendly Version Interactive Discussion EGU 0 2 4 6 GR (nmh −1 ) 1.3 − 3 nm 0 2 4 6 GR (nmh −1 ) 3 − 7 nm 0 30 60 90 120 150 180 210 240 270 300 330 360 0 5 10 15 20 GR (nmh −1 ) 7 − 20 nm Wind direction (°)
Fig. 5. GR as a function of wind direction for the three size classes during July 2005 to October 2006. Black – negative, white – positive.
ACPD
7, 10343–10369, 2007 Ions in an Australian Eucalypt forest T. Suni et al. Title Page Abstract Introduction Conclusions References Tables Figures ◭ ◮ ◭ ◮ Back CloseFull Screen / Esc
Printer-friendly Version
Interactive Discussion
EGU Ju−05 Se−05 No−05 Ja−06 Ma−06Ma−06 Ju−06 Se−060
2000 4000 6000
Cluster ions (0.34 − 2 nm) − daytime
Negative (cm
−3
)
Ju−05 Se−05 No−05 Ja−06 Ma−06Ma−06 Ju−06 Se−060 2000 4000 6000 Positive (cm −3 )
Ju−05 Se−05 No−05 Ja−06 Ma−06Ma−06 Ju−06 Se−060 1
2
Ratio (−/+)
Ju−05 Se−05 No−05 Ja−06 Ma−06Ma−06 Ju−06 Se−060 2000
4000 6000
Cluster ions (0.34−2 nm) − night
Negative (cm
−3
)
Ju−05 Se−05 No−05 Ja−06 Ma−06Ma−06 Ju−06 Se−060 2000 4000 6000 Positive (cm −3 )
Ju−05 Se−05 No−05 Ja−06 Ma−06Ma−06 Ju−06 Se−060 1
2 3
Ratio (−/+)
Ju−05 Se−05 No−05 Ja−06Ma−06Ma−06 Ju−06 Se−06 0
500 1000
Intermediate ions (2−14 nm) − daytime
Negative (cm
−3)
Ju−05 Se−05 No−05 Ja−06Ma−06Ma−06 Ju−06 Se−06 0
500 1000
Positive (cm
−3)
Ju−05 Se−05 No−05 Ja−06Ma−06Ma−06 Ju−06 Se−060 2
4 6
Ratio (−/+)
Ju−05 Se−05 No−05 Ja−06 Ma−06Ma−06 Ju−06 Se−06 0
500 1000
Intermediate ions (2−14 nm) − night
Negative (cm
−3
)
Ju−05 Se−05 No−05 Ja−06 Ma−06Ma−06 Ju−06 Se−06 0 500 1000 Positive (cm −3 )
Ju−05 Se−05 No−05 Ja−06 Ma−06Ma−06 Ju−06 Se−060 1 2 3 4 5 6 Ratio (−/+)
Ju−05 Se−05 No−05 Ja−06 Ma−06Ma−06 Ju−06 Se−06 0
1000 2000
Large ions (16−40 nm) − daytime
Negative (cm
−3
)
Ju−05 Se−05 No−05 Ja−06 Ma−06Ma−06 Ju−06 Se−06 0 1000 2000 Positive (cm −3 )
Ju−05 Se−05 No−05 Ja−06 Ma−06Ma−06 Ju−06 Se−060 1
2
Ratio (−/+)
Ju−05 Se−05 No−05 Ja−06 Ma−06Ma−06 Ju−06 Se−06 0
1000 2000
Large ions (16−40 nm) − night
Negative (cm
−3
)
Ju−05 Se−05 No−05 Ja−06 Ma−06Ma−06 Ju−06 Se−06 0 1000 2000 Positive (cm −3 )
Ju−05 Se−05 No−05 Ja−06 Ma−06Ma−06 Ju−06 Se−060 1
2
Ratio (−/+)
Fig. 6. 3-day median ion concentrations (black – negative, grey – positive) and ion ratio (–/+) for cluster (top), intermediate (middle), and large ions (bottom) during July 2005–October 2006. Left column – daytime, right column – nighttime.