HAL Id: hal-02103482
https://hal.archives-ouvertes.fr/hal-02103482
Submitted on 21 May 2019
HAL is a multi-disciplinary open access archive for the deposit and dissemination of sci-entific research documents, whether they are pub-lished or not. The documents may come from teaching and research institutions in France or abroad, or from public or private research centers.
L’archive ouverte pluridisciplinaire HAL, est destinée au dépôt et à la diffusion de documents scientifiques de niveau recherche, publiés ou non, émanant des établissements d’enseignement et de recherche français ou étrangers, des laboratoires publics ou privés.
control cholera in Haiti: a four-year implementation
study
Stanislas Rebaudet, Gregory Bulit, Jean Gaudart, Edwige Michel, Pierre
Gazin, Claudia Evers, Samuel Beaulieu, Aaron Aruna Abedi, Lindsay Osei,
Robert Barrais, et al.
To cite this version:
Stanislas Rebaudet, Gregory Bulit, Jean Gaudart, Edwige Michel, Pierre Gazin, et al.. The case-area targeted rapid response strategy to control cholera in Haiti: a four-year implementation study. PLoS Neglected Tropical Diseases, Public Library of Science, 2019, 13 (4), pp.e0007263. �10.1371/jour-nal.pntd.0007263�. �hal-02103482�
The case-area targeted rapid response
strategy to control cholera in Haiti: a four-year
implementation study
Stanislas RebaudetID1,2,3*, Gregory Bulit4, Jean Gaudart1,5, Edwige Michel6,
Pierre GazinID7, Claudia Evers4, Samuel Beaulieu4, Aaron Aruna Abedi4,8, Lindsay Osei1,4,
Robert Barrais6, Katilla Pierre6, Sandra Moore9, Jacques Boncy10, Paul Adrien6, Florence Duperval Guillaume11, Edouard Beigbeder4, Renaud Piarroux12
1 Assistance Publique–Hoˆ pitaux de Marseille (AP-HM), Marseille, France, 2 Hoˆpital Europe´en Marseille, Marseille, France, 3 Institut Pierre-Louis d’Epide´ miologie et de Sante´ Publique, Sorbonne Universite´, INSERM, Paris, France, 4 United Nations Children’s Fund, Haiti, 5 Aix Marseille Univ, IRD, INSERM, SESSTIM, Marseille, France, 6 Direction d’Epide´ miologie de Laboratoire et de Recherche, Ministère de la Sante´ Publique et de la Population, Haiti, 7 Institut de Recherche pour le De´veloppement (IRD), Marseille, France, 8 Direction de la Lutte contre la Maladie, Ministère de la Sante´ Publique, Kinshasa, Democratic Republic of the Congo, 9 Aix Marseille Univ, Marseille, France, 10 Laboratoire National de Sante´ Publique, Ministère de la Sante´ Publique et de la Population, Haiti, 11 Ministère de la Sante´ Publique et de la Population, former Minister, Delmas, Haiti, 12 Sorbonne Universite´ , INSERM, Institut Pierre-Louis d’Epide´ miologie et de Sante´ Publique, AP-HP, Hoˆpital Pitie´-Salpêtrière, Paris, France
Abstract
Background
In October 2010, Haiti was struck by a large-scale cholera epidemic. The Haitian govern-ment, UNICEF and other international partners launched an unprecedented nationwide alert-response strategy in July 2013. Coordinated NGOs recruited local rapid response mobile teams to conduct case-area targeted interventions (CATIs), including education ses-sions, household decontamination by chlorine spraying, and distribution of chlorine tablets. An innovative red-orange-green alert system was also established to monitor the epidemic at the communal scale on a weekly basis. Our study aimed to describe and evaluate the exhaustiveness, intensity and quality of the CATIs in response to cholera alerts in Haiti between July 2013 and June 2017.
Methodology/principal findings
We analyzed the response to 7,856 weekly cholera alerts using routine surveillance data and severity criteria, which was based on the details of 31,306 notified CATIs. The odds of CATI response during the same week (exhaustiveness) and the number of complete CATIs in responded alerts (intensity and quality) were estimated using multivariate generalized lin-ear mixed models and several covariates. CATIs were carried out significantly more often in response to red alerts (adjusted odds ratio (aOR) [95%-confidence interval, 95%-CI], 2.52 [2.22–2.87]) compared with orange alerts. Significantly more complete CATIs were carried out in response to red alerts compared with orange alerts (adjusted incidence ratio (aIR),
a1111111111 a1111111111 a1111111111 a1111111111 a1111111111 OPEN ACCESS
Citation: Rebaudet S, Bulit G, Gaudart J, Michel E,
Gazin P, Evers C, et al. (2019) The case-area targeted rapid response strategy to control cholera in Haiti: a four-year implementation study. PLoS Negl Trop Dis 13(4): e0007263.https://doi.org/ 10.1371/journal.pntd.0007263
Editor: Emily Gurley, Johns Hopkins University
Bloomberg School of Public Health, UNITED STATES
Received: May 23, 2018 Accepted: February 25, 2019 Published: April 16, 2019
Copyright:© 2019 Rebaudet et al. This is an open access article distributed under the terms of the
Creative Commons Attribution License, which permits unrestricted use, distribution, and reproduction in any medium, provided the original author and source are credited.
Data Availability Statement: All relevant data are
publicly available from the OSF (Open Science Framework) (accession number osf.io/djky6).
https://osf.io/en9vp/?view_only= 2ce65ed8b2f64c14a606e3c36d0ac311 Funding: This study was supported by the United
Nations Children’s Fund (UNICEF)-Haiti, to a lesser extent the Assistance Publique – Hoˆpitaux de Marseille (AP-HM), the Ministry of Public Health and Population (MSPP) of Haiti, and the French
1.85 [1.73–1.99]). Over the course of the eight-semester study, we observed a significant improvement in the exhaustiveness (aOR, 1.43 [1.38–1.48] per semester) as well as the intensity and quality (aIR, 1.23 [1.2–1.25] per semester) of CATI responses, independently of funds available for the strategy. The odds of launching a CATI response significantly decreased with increased rainfall (aOR, 0.99 [0.97–1] per each accumulated cm). Response interventions were significantly heterogeneous between NGOs, communes and
departments.
Conclusions/significance
The implementation of a nationwide case-area targeted rapid response strategy to control cholera in Haiti was feasible albeit with certain obstacles. Such feedback from the field and ongoing impact studies will be very informative for actors and international donors involved in cholera control and elimination in Haiti and in other affected countries.
Author summary
Cholera is a potentially deadly diarrheal disease caused by toxin-secreting strains ofVibrio cholerae. The bacterium can trigger severe epidemics in countries with limited access to
potable water and sanitation. Hygiene promotion, proper sanitation and improved access to safe drinking water are essential to control cholera. However, very few reports have described and evaluated the implementation of such activities in the field. Since October 2010, Haiti has been affected by one of the most severe cholera epidemics of the past few decades. In this report, we describe and evaluate the implementation of the original nationwide case-area targeted interventions (CATIs) response strategy, which was launched in July 2013 after years of insufficient response coordination and diminishing efforts to control cholera outbreaks in affected communities. Rapid implementation of education sessions, household decontamination, soap distribution and water chlorination in affected communities proved challenging but possible, even in a mountainous and decentralized country such as Haiti with tens of thousands of suspected cholera cases per year. Evaluation of the impact of the CATI-based strategy on the cholera epidemic is underway. Together with other components of a multi-sectoral approach, this rapid response strategy appears to be critical to eventually eliminate cholera in Haiti.
Introduction
Cholera was accidentally imported into Haiti in October 2010 [1,2]. The country has conse-quently experienced a massive epidemic, with a total of 819,899 suspected cases and 9,791 cholera-related deaths by January 26, 2019 according to the Haitian Ministry of Health (MOH, acronyms summarized inS1 Table) [3]. Following international recommendations [4], Haitian authorities and services, together with numerous international and non-governmental organi-zations (NGOs), have struggled to mitigate the death toll and case incidence by supporting both cholera treatment institutions as well as safe water, improved sanitation and hygiene practice (WaSH) efforts in affected communities [5–8]. Cholera incidence gradually receded in 2011–2012, with alternating troughs and peaks influenced by seasonal rainfall [9]. Although Haiti was considered the country most affected by cholera worldwide [10], emergency funds Institut de Recherche pour le De´veloppement
(IRD). Authors from UNICEF-Haiti (GB, CE, SB, EB) played a role in data collection and interpretation, decision to publish, as well as preparation of the manuscript. Authors from MSPP (EM, RB, KP, JB, PA, DF, FDG) played a role in data collection and interpretation, decision to publish, as well as preparation of the manuscript. Authors from AP-HM (SR, JG, LO and RP) played a role in study design, data collection and analysis, decision to publish, and preparation of the manuscript. The author from IRD (PG) played a role in data collection and interpretation, decision to publish, as well as preparation of the manuscript. The funders had no role in study design, data collection and analysis, decision to publish, or preparation of the manuscript.
Competing interests: I have read the journal’s
policy and the authors of this manuscript have the following competing interests: For authors working for the United Nations Children’s Fund, Haiti (GB, CE, SB and EB): UNICEF-Haiti helped the Haitian Ministry of Health and Population (MSPP) to implement the alert-response strategy to control cholera in Haiti. UNICEF-Haiti received funds from several governments and institutions such as ECHO, DFID and CERF. These institutions had no involvement in study design, collection analysis and interpretation of data, writing of the report, and decision to submit the paper for publication. For authors working for Assistance Publique – Hoˆpitaux de Marseille (SR, JG, LO and RP): APHM, a French university-hospital, was mandated by the Haitian Ministry of Health and UNICEF-Haiti and granted by UNICEF-Haiti to provide the alert-response strategy to control cholera with prospective epidemiological analysis and evaluation. This study aimed to present and assess this strategy. Some UNICEF-Haiti staff played a role in study design, data collection and analysis, decision to publish, and preparation of the manuscript. For authors working for Ministry of Public Health and Population (EM, RB, KP, JB, PA and FDG): To implement the alert-response strategy to control cholera in Haiti, MSPP received material and financial support from UNICEF-Haiti. This study aimed to present and assess this strategy. Some UNICEF-Haiti staff played a role in study design, data collection and analysis, decision to publish, and preparation of the manuscript. For authors who were temporally contracted by UNICEF-Haiti (AAA, LO and RB): In accordance with their respective institutions, these four authors were contracted during a few months by UNICEF-Haiti as external consultants to perform prospective epidemiological analysis and evaluation of the alert-response strategy to control
for cholera declined and most organizations eventually interrupted or drastically reduced activities in 2012 [7,11]. During February 2013, the Haitian government, Pan American Health Organization (PAHO), United Nations Children’s Fund (UNICEF) and the Centers for Dis-ease Control and Prevention (CDC) launched an ambitious National Plan for the Elimination of Cholera in Haiti 2013–2022 [12]. Over $1.5 billion USD of the total $2.2 billion USD was designated to invest in Haitian water and sanitation infrastructures, as only 68% of households obtained drinking water from improved sources, 26% of households had access to improved sanitation facilities and 34% of households had water and soap available for handwashing [13]. Two pilot oral cholera vaccine (OCV) campaigns were carried out in 2012, vaccinating approximately 100,000 people in both rural and urban settings [14,15]. Two additional cam-paigns were planned for 2013 [16].
The elimination plan also intended to improve surveillance activities and ensure adequate outbreak response [12]. To interrupt local cholera outbreaks at an early stage, UNICEF sup-ported the MOH and the Haitian National Directorate for Water and Sanitation (DINEPA) to launch a nationwide coordinated cholera alert-response strategy in July 2013. Analogous to forest fire management [17,18], this program aimed to rapidly detect local cholera outbreaks and send response teams to affected communities. Case-area targeted interventions (CATIs) involved detection of additional cases, house decontamination, awareness and health educa-tion concerning risk factors and methods of cholera preveneduca-tion and management, soap distri-bution, and water chlorination at the household level or directly at water sources. At the central level, the epidemic was monitored using a simple and unique tri-color cholera alert sys-tem, which is described in detail in a preprint manuscript [19].
Based on the identified risk factors and the growing evidence of WaSH efficiency to control cholera [20–23] and diarrhea in developing countries or during humanitarian crises [24–27], hygiene promotion and improved access to safe drinking water have long been recommended to control cholera transmission [4,28–30]. Interventions targeting the residential area of chol-era cases and nearby neighbors appear important to control cholchol-era outbreaks, as cholchol-era risk has been shown to increase among neighbors living within a few dozen meters of cases during the first week following disease onset [31,32]. A recent modeling study has also supported the potential impact of early CATIs in response to cholera outbreaks [33]. However, feedback from the field has been scarce. Reported activities have usually been implemented at a local level, during short time periods, and described with few details [7,8,29,34–47].
The aim of the present study was to describe and evaluate the implementation of CATIs to control cholera outbreaks in Haiti using output indicators [48] from July 2013 (epidemiologi-cal week 27) to June 2017 (week 26). Evaluation of the effectiveness and impact [48] of this strategy is outside the scope of the current paper, and dedicated studies are underway.
Methods
Rapid case-area targeted response interventions (CATIs) to control cholera
outbreaks
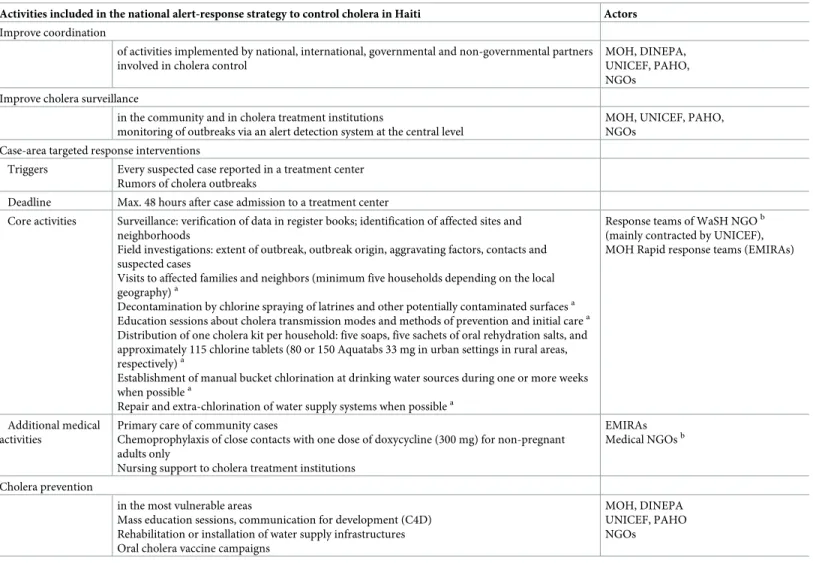
The national alert-response strategy to control cholera in Haiti was launched in July 2013 to complement the multi-sectoral national plan for the elimination of cholera in Haiti 2013–2022 [12], which includes long-term WaSH infrastructure, medical care and OCV. The alert-response strategy aims to improve key aspects of infectious disease control in the country (Table 1andS1 Fig): coordination of cholera control activities; epidemiologic surveillance of cholera; cholera prevention in the most vulnerable areas; and most importantly prompt and exhaustive case-area targeted response interventions (CATIs). To establish CATI teams, UNI-CEF established partnership with at least one WaSH NGO for each of the 10 administrative cholera. Some UNICEF-Haiti staff played a role in
study design, data collection and analysis, decision to publish, and preparation of the manuscript. These authors have with no competing interest: PG, SM
departments (S1 Table), which hired rapid response mobile teams comprised of local Haitian staff. They were encouraged to work in close collaboration with departmental health director-ates and cholera treatment centers to obtain and share epidemiological cholera data and out-break rumors on a daily basis (S1 Fig). Mobile teams were requested to respond to every suspected cholera case or death and every plausible rumor via CATI at the affected household and neighbors within 48 hours, based on the average cholera incubation period [49]. The teams were nevertheless encouraged to respond the same day if possible. In case of several con-comitant outbreaks, mobile teams were asked to prioritize the most-affected areas. The response intervention methodology, which was established with the MOH and partners [50], is described inTable 1. House decontamination by chlorine spraying of latrines and other potentially contaminated surfaces was proposed to visited households, although the efficacy
Table 1. Activities included in the national alert-response strategy to control cholera in Haiti and core methodology of case-area targeted response interventions. Activities included in the national alert-response strategy to control cholera in Haiti Actors
Improve coordination
of activities implemented by national, international, governmental and non-governmental partners involved in cholera control
MOH, DINEPA, UNICEF, PAHO, NGOs
Improve cholera surveillance
in the community and in cholera treatment institutions
monitoring of outbreaks via an alert detection system at the central level
MOH, UNICEF, PAHO, NGOs
Case-area targeted response interventions
Triggers Every suspected case reported in a treatment center Rumors of cholera outbreaks
Deadline Max. 48 hours after case admission to a treatment center
Core activities Surveillance: verification of data in register books; identification of affected sites and neighborhoods
Field investigations: extent of outbreak, outbreak origin, aggravating factors, contacts and suspected cases
Visits to affected families and neighbors (minimum five households depending on the local geography)a
Decontamination by chlorine spraying of latrines and other potentially contaminated surfacesa Education sessions about cholera transmission modes and methods of prevention and initial carea Distribution of one cholera kit per household: five soaps, five sachets of oral rehydration salts, and approximately 115 chlorine tablets (80 or 150 Aquatabs 33 mg in urban settings in rural areas, respectively)a
Establishment of manual bucket chlorination at drinking water sources during one or more weeks when possiblea
Repair and extra-chlorination of water supply systems when possiblea
Response teams of WaSH NGOb (mainly contracted by UNICEF), MOH Rapid response teams (EMIRAs)
Additional medical activities
Primary care of community cases
Chemoprophylaxis of close contacts with one dose of doxycycline (300 mg) for non-pregnant adults only
Nursing support to cholera treatment institutions
EMIRAs Medical NGOsb
Cholera prevention
in the most vulnerable areas
Mass education sessions, communication for development (C4D) Rehabilitation or installation of water supply infrastructures Oral cholera vaccine campaigns
MOH, DINEPA UNICEF, PAHO NGOs
a
activities analyzed in the study b
seeS1 Tablefor a list of NGOs
DINEPA, National Directorate for Water and Sanitation; EMIRA, MOH departmental rapid response mobile teams; MOH, Ministry of Health (Ministère de la Santé Publique et de la Population); NGO, non-governmental organization; PAHO, Pan American Health Organization; UNICEF, United Nations Children’s Fund; WaSH,
water sanitation and hygiene promotion
and impact of this method have never been established [30], and are likely limited to a few hours due to short-term vibrio survival [51]. CATIs were prospectively reported to UNICEF by mobile teams using standardized online Google spreadsheets. A few other organizations implementing CATIs and funded by other agencies also joined the strategy and reported their activities to UNICEF (S1 Table).
To bolster institutional response capacities, UNICEF and the World Bank also provided additional material, funds and human resources to the MOH. The MOH established its own departmental response teams (EMIRAs,Equipes Mobiles d’Intervention RApide) on March
2014 to conduct CATIs and additional medical activities (Table 1), such as chemoprophylaxis of contacts living in the same house as cholera cases with one dose of doxycycline (300 mg) for non-pregnant adults only [4,52,53]. ECHO (European Commission Humanitarian Office) and PAHO (Pan American Health Organization) also contracted medical NGOs with terms of ref-erence similar to that of the EMIRAs (Tables1andS1). In contrast to WaSH teams supported by UNICEF, reporting of EMIRA and mobile medical team activities was not systematic.
Field interventions involving both WaSH/medical and governmental/non-governmental staff were strongly encouraged and were carried out frequently. WaSH NGOs and EMIRAs typically formed common mixed mobile teams implementing core and supplemental medical activities (Table 1). Mobile teams were asked to repeat response interventions in the commu-nity until every suspected cholera case was addressed. In 2015, they were also requested to con-duct surveys at targeted households to assess water treatment two weeks after the initial response intervention. These interventions are demonstrated in a short online video [54].
Data collection
Cholera alerts and case-area targeted interventions. The cholera alert system has been
detailed in a preprint article [19]. Alerts are listed inS1 Database, and they were computed for each of the 140 administrative communes of Haiti (S1 Fig) and the 209 weeks between July 2013 and June 2017, based on anonymized consolidated databases of institutional suspected cholera cases (acute watery diarrhea with or without vomiting, irrespective of patient age), cholera deaths and stool culture results of the MOH, and criteria listed inS2 Table. Reports of the CATIs carried out by mobile WaSH teams included date, location (i.e., commune,
commu-nal section, locality) and activities. We considered a CATI was complete if the corresponding report included a precise location, an education session, house decontamination, and either distribution of chlorine tablets, establishment of manual bucket chlorination at drinking water sources, or repair and extra-chlorination of water supply systems. The number of incomplete and complete CATIs are listed inS1 Database. For each CATI, mobile teams mentioned the institution that notified responded cases so that it was possible to link CATIs with cholera alerts by administrative commune and by week, even if CATIs were sometimes carried out in communes different from that where patients were treated. Unfortunately, targeted interven-tions performed by EMIRAs and medical NGO mobile teams could not be exhaustively quan-tified and described, although most WaSH interventions involved medical and governmental staff. Notably, exhaustive information concerning the use of doxycycline chemoprophylaxis was not available for analysis.
Covariates. To assess whether mobile teams prioritized more severe outbreaks, we
distin-guishedred and orange alerts. To analyze the variation in CATI implementation in response to
cholera alerts over time, we divided the four-year study period into eight semesters (first and last 26 weeks of every year). As response implementation may have been heterogeneous between NGOs, we identified the NGO responsible for response to alerts every week in every commune, using information provided by UNICEF and intervention reports. NGOs
responsible for outbreak response changed over time, and NGOs could be responsible for communes in several departments at the same time (S1 Table). To assess the effect of weekly available funds on CATI implementation, we distributed all UNICEF disbursements for NGO and MOH mobile teams, in cash or in response items (e.g., chlorine, soap, buckets, oral rehy-dration salts), over the course of the 209-week study period. We also obtained population esti-mates for all 140 administrative communes from the Haitian Institute of Statistics and Informatics [55]. Commune remoteness was estimated by calculating distances from the main town or village of each commune to the capital Port-au-Prince and to the capital of the local department, using the OpenStreetMap road network [56]. As terrain may hinder CATI imple-mentation, we identified mainly mountainous communes from a map of agro-ecological zones provided by FAO [57]. We identified communes that received mass OCV between 2012 and 2017, as this may have influenced CATI efforts. Finally, satellite estimates of daily-accumulated rainfall (area-averaged TRMM_3B42_daily v7) were extracted from the National Oceanic and Atmospheric Administration (NOAA) website covering the entire surface of Haiti and the centroid of all 140 communes [58]. The main characteristics of the communes in Haiti are summarized inS1 Database.
Ethics statement
The protocol was authorized by the Haiti MOH National Bioethics Comity (authorization number #1718–30).
Data analysis
As the cholera alert system was launched to prospectively monitor the epidemic, we used chol-era alerts as an outbreak proxy to retrospectively evaluate the implementation of the case-area targeted response strategy. Hence, we could detect the capacity of response teams to directly obtain epidemiological information from the community, treatment institutions and departmental health directorates (S1 Fig). We then assessed three output indicators of the CATIs in response to cholera alerts: exhaustiveness, intensity and quality.
Analysis of the exhaustiveness of CATIs in response to cholera alerts. In an initial
anal-ysis, response exhaustiveness was defined as the proportion of retrospectivered or orange alerts
that triggered a response by at least one targeted intervention, either complete or incomplete, during the same epidemiological week. To illustrate response exhaustiveness, we plotted and mapped the numbers of responded and non-responded alerts per week and per commune, respectively. We then assessed the effect of several covariates on response exhaustiveness: administrative commune in alert; administrative department of the commune; responsible NGO; alert level (red versus orange); linear variation in response implementation over the
course of eight semesters; UNICEF disbursements for CATIs during the week of the alert; weekly accumulated rainfall in the commune; commune population; OCV campaign in the commune; distance from Port-au-Prince; distance from the department capital; and terrain type (mountainous or non-mountainous). We used generalized linear mixed models
(GLMMs) with alert response (responded vs non-responded alert) as an independent variable and a binomial distribution (logistic model) (Eq 1) [59].
E½yijjni;xij;zij� ¼g 1
ðx0ijb þz
0
ijniÞ ðEq 1Þ
wherey represents the outcome variable, x represents the vector of covariates with fixed effect β, z represents the vector of covariates with random effect ν; E[.] represents the expectation of
(.) represents the canonical link (i.e., the logit function for binomial distributions or the log
function for negative-binomial ones).
For the univariate analyses of communes, departments and NGOs, each covariate was mod-eled separately as a unique random effect. For the univariate analyses of other covariates, we systematically included communes nested within departments as a common random effect and NGOs as a second random effect in models where each covariate was modeled as a unique fixed effect variable. For the multivariate analysis, we included the fixed effect variables for whichp-values were less than 0.25 [60], communes nested within departments as a common random effect, and NGOs as a second random effect. The models estimated the crude odds ratio (cOR) and adjusted odds ratio (aOR) of response to alerts as well as 95% confidence intervals (95%-CI) associated with each covariate. Ap-value of less than 0.05 indicated
statisti-cal significance.
Analysis of the intensity and quality of the CATI response to cholera alerts. In a second
analysis restricted to responded alerts, response intensity and quality was defined together as the incidence of complete targeted interventions carried out per alert during the same epide-miological week. Using GLMMs with the number of complete CATIs per alert as an indepen-dent variable and a negative-binomial distribution (Eq 1) [59], we applied the same analysis procedure as that applied for response exhaustiveness. Models estimated the crude incidence ratio (cIR) and adjusted incidence ratio (aIR) for complete CATIs in responded alerts and 95% confidence intervals (95%-CI) associated with each covariate.
Software. Data management was performed using Microsoft Excel for Mac v15.32. QGIS
v3.0.3 [61] was used to calculate distance matrices and draw the map. Graph design and statis-tical analyses were performed using R Studio version 1.1.453 for Mac [62] with R version 3.4.2 for Mac [63] and the {ggplot2} [64] and {lme4} [65] packages.
Results
Brief description of the epidemic and the response strategy
Between the launch of the nationwide alert-response strategy in July 2013 (week 27) and the end of this 209-week study period in June 2017 (week 26), a total of 149,690 suspected cholera cases were recorded throughout Haiti (Fig 1Panel A). As a result, a total of 7,856 cholera alerts were identified in the country, including 4,365red alerts and 3,491 orange alerts (Fig 1Panel B) [19]. Alerts exhibited a temporal evolution consistent with the dynamics of the epidemic (Fig 1Panels A and B). Alert distribution was geographically heterogeneous, asred and orange
alerts mainly clustered in the departments of Ouest (especially in Port-au-Prince Metropolitan Area), Centre and Artibonite (S3 Table).
During the same period, UNICEF disbursed $25.4 million USD to support CATIs imple-mented by WaSH NGOs and MOH mobile teams (EMIRAs) as well as $2.0 million USD in response items (i.e., chlorine, soaps, buckets, oral rehydration salts) (Fig 1Panel C). UNICEF delivered 3.3 million soaps, 140 million Aquatabs (33 mg tablets) and 3.6 million oral rehydra-tion salt sachets to UNICEF partner organizarehydra-tions. These disbursements were not continuous over the study period (Fig 1Panel C), and they appeared driven by various factors as detailed inS1 Text.
In four years, a total of 31,306 CATIs in response to cholera cases were notified by UNICEF WaSH partners (Fig 1Panel C). Mobile teams performed education sessions to a total of 2.9 million people, decontaminated 179,830 houses, distributed chlorine tablets to 757,693 house-holds, distributed soaps to 593,494 househouse-holds, and supplied chlorination at 2,282 water sources or networks. A total of 25,202 CATIs (81%) was thus classified as complete. Over the
course of the four-year study period, the overall incidence of CATIs and complete CATIs increased considerably (Fig 1Panel C).
Exhaustiveness of CATIs in response to cholera alerts
Between July 2013 and June 2017, mobile WaSH teams reported 31,306 CATIs to control chol-era throughout the country, of which 61% were conducted in communes inred alert and 14%
were carried out in communes inorange alert (data no shown). The remaining CATIs targeted
Fig 1. Weekly evolution of accumulated rainfall and cases (Panel A), retrospective cholera alerts (Panel B), and implementation of the response strategy by UNICEF (Panel C) from mid-2013 (week 27) to mid-2017 (week 26). Cumulated rainfall data averaged over the entire country was obtained from NOAA. Suspected
cholera case numbers were obtained from the routine surveillance databases provided by the MOH. Retrospective cholera alerts were computed for a preprint manuscript, based on cases, deaths and stool cultures positive forVibrio cholerae O1 [19]. Details on UNICEF disbursements and rapid CATIs were provided by UNICEF (S1 Database).
green alert communes with sporadic cases (12%), green alert communes with no cases (7%) or
communes with no data (6%).
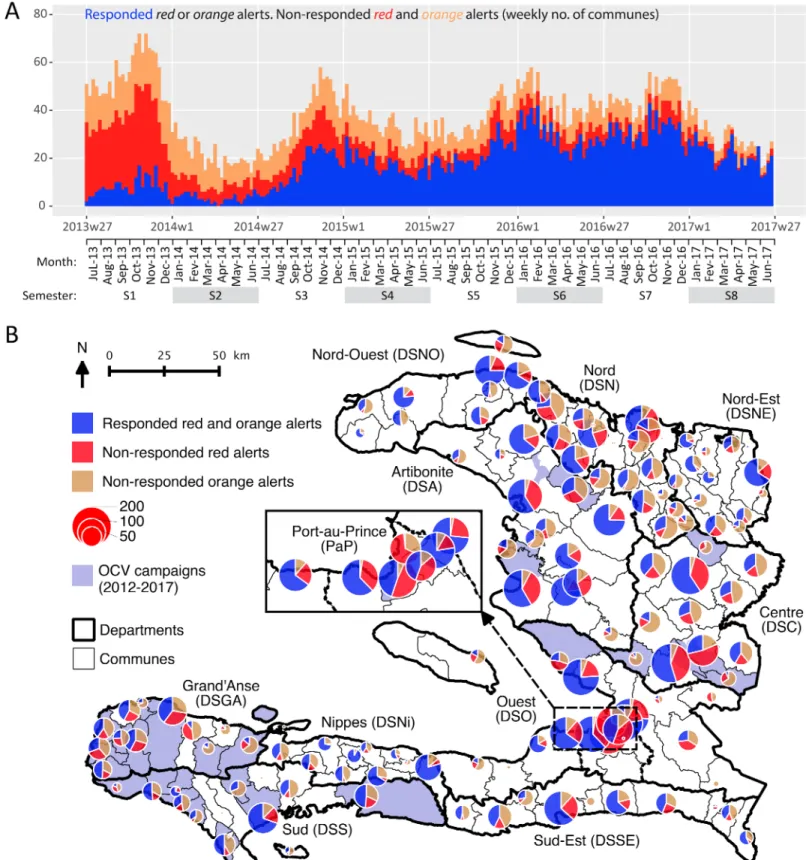
Between July 2013 and June 2017, mobile WaSH teams responded to 49% (3,824) of the 7,856 alerts during the same week. This proportion increased from 15% to 75% between the first and last semester of the four-year study period (Fig 2Panel A,S3 Table,S2 FigPanel A). Overall, the proportion of responded alerts appeared better forred alerts (58%) than for orange
(37%) alerts (S3 TableandS2 FigPanel A). The proportion of responded alerts appeared very heterogeneous between communes (Fig 2Panel B). It ranged from 33% to 63% between departments. It ranged from 6% to 90% between NGOs (S3 TableandS2 FigPanel A).
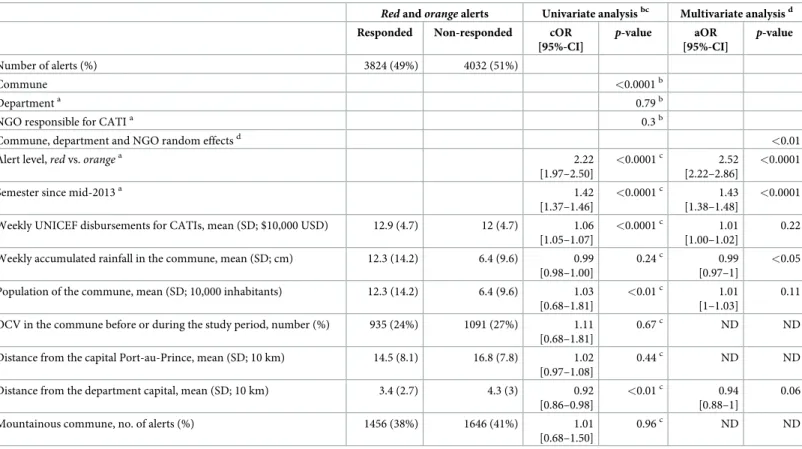
Using multivariate GLMMs, the odds of launching a CATI in response to cholera alerts (exhaustiveness) appeared significantly influenced by the commune, the department and the responsible NGO (commonp-value of random effects < 0.01) (Table 2). Exhaustiveness of CATI response was significantly higher forred alerts than for orange alerts (adjusted odds
ratio (aOR), 2.52 [2.22–2.86];p-value < 0.0001). Exhaustiveness of CATI response
signifi-cantly increased over the course of the study period (aOR, 1.43 [1.39–1.48] per semester;
p-value < 0.0001) (Table 2), significantly decreased with accumulated rainfall (aOR, 0.99 [0.97– 1] per each accumulated cm;p-value < 0.05), and tended to decrease when the alert was far
from the department capital (aOR, 0.94 [0.88–1] per 10 km;p-value, 0.06). However, response
exhaustiveness was not linearly dependent on UNICEF disbursements for CATIs. Response exhaustiveness was not significantly lower when the alert was far from Port-au-Prince, in a more populated commune, or in a mountainous commune. Finally, we found that response exhaustiveness was not significantly influenced by a previous OCV campaign (Table 2).
Intensity and quality of CATIs in response to cholera alerts
In each of the 3,824red or orange responded alerts, an average of 545 persons (standard
devia-tion (SD), 1,551) were reached by educadevia-tion sessions, 37 houses (SD, 68) were decontaminated by chlorine spraying, 141 families (SD, 579) received chlorine tablets for household water treatment, and an average of 0.4 water sources (SD, 2.6) were chlorinated during the same week (S3 Table). Overall, responded alerts thus received an average of 5.1 complete targeted interventions (SD, 7.8) during the same week. The mean number of complete CATIs per responded alert appeared better forred (6.4 [SD, 8.8]) than for orange (2.7 [4.4]) alerts (S3 TableandS2 FigPanel B). This number increased from 0.7 (SD, 1.7) to 7.8 (10.6) between the first and last semester of the four-year study period (S3 TableandS2 FigPanel B). The mean number of complete CATIs per responded alert ranged from 2.8 (3.1) to 10.4 (12.8) between departments and from 0 (0) to 11 (11.2) between NGOs (S3 TableandS2 FigPanel B).
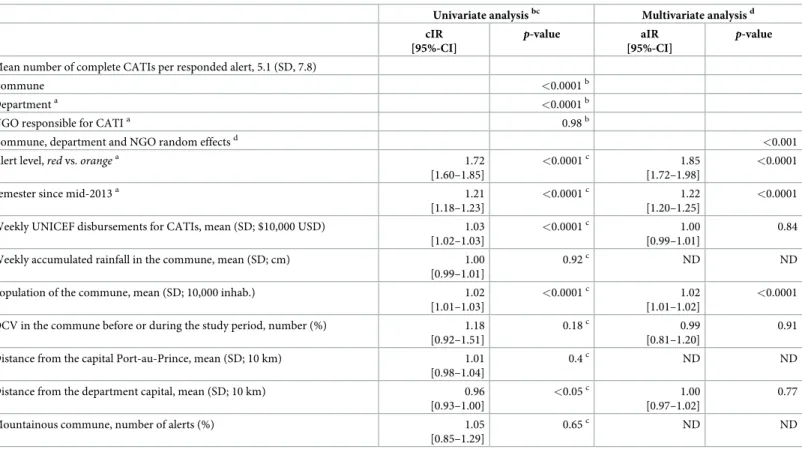
Using multivariate GLMMs, the incidence of complete CATIs conducted in responded alerts appeared significantly influenced by the commune, the department and the responsible NGO (commonp-value of random effects < 0.001) (Table 3). The intensity and quality of CATI response was significantly higher forred alerts than for orange alerts (adjusted incidence
ratio (aIR), 1.85 [1.72–1.98];p-value < 0.0001). Response intensity and quality significantly
increased over the course of the study period (aIR, 1.22 [1.20–1.25] per semester;
p-value < 0.0001). Furthermore, response intensity and quality was greater in more populated communes (aIR, 1.02 [1.01–1.02] per 10,000 inhab.;p-value <0.0001) (Table 3). However, the incidence of complete CATIs in responded alerts was not significantly influenced by accumu-lated rainfall, UNICEF disbursements for CATIs, previous OCV campaigns, distance from Port-au-Prince or department capital, or mountainous terrain (Table 3).
Fig 2. Case-area targeted interventions (CATIs) in response to cholera alerts during the same week, from July 2013 to June 2017: weekly number (Panel A) and commune number (Panel B) of responded and non-respondedred and orange alerts. Retrospective cholera alerts were computed based on case numbers, death
numbers and stool cultures positive forVibrio cholerae O1 [19]. CATI records were provided by UNICEF. Oral cholera vaccine (OCV) records were provided by the MOH. The map was created using QGIS v3.0.3.
Discussion
Our analysis of 31,306 CATIs carried out by mobile WaSH teams between July 2013 and June 2017 shows that implementation of the first nationwide coordinated alert-response strategy to control cholera in Haiti was feasible at an annual cost of less than $1 USD per inhabitant. Response exhaustiveness, intensity and quality were initially insufficient but markedly improved over the course of the study period, with 75% of alerts receiving a response in the same week during the last semester of this four-year study. This amelioration was independent of available funds, which suggests that a significant buffer period was necessary to establish coordination between response partners and the MOH, to organize and commit mobile teams, and to secure administrative support for the strategy, as described inS1 Text. Response interventions were significantly heterogeneous between contracted NGOs, which was likely due to disparities in NGO engagement and capacity to coordinate activities, notably with peripheral health authorities. Response interventions were also heterogeneous between
Table 2. Exhaustiveness of case-area targeted interventions (CATIs) in response to cholera alerts from July 2013 to June 2017: Factors associated with the odds of CATI response to alerts (logistic mixed models).
Red and orange alerts Univariate analysisbc Multivariate analysisd Responded Non-responded cOR
[95%-CI] p-value aOR [95%-CI] p-value Number of alerts (%) 3824 (49%) 4032 (51%) Commune <0.0001b Departmenta 0.79b
NGO responsible for CATIa 0.3b
Commune, department and NGO random effectsd <0.01
Alert level,red vs. orangea 2.22
[1.97–2.50]
<0.0001c 2.52
[2.22–2.86]
<0.0001
Semester since mid-2013a 1.42
[1.37–1.46]
<0.0001c 1.43
[1.38–1.48]
<0.0001
Weekly UNICEF disbursements for CATIs, mean (SD; $10,000 USD) 12.9 (4.7) 12 (4.7) 1.06 [1.05–1.07]
<0.0001c 1.01
[1.00–1.02]
0.22
Weekly accumulated rainfall in the commune, mean (SD; cm) 12.3 (14.2) 6.4 (9.6) 0.99 [0.98–1.00]
0.24c 0.99 [0.97–1]
<0.05
Population of the commune, mean (SD; 10,000 inhabitants) 12.3 (14.2) 6.4 (9.6) 1.03 [0.68–1.81]
<0.01c 1.01
[1–1.03]
0.11
OCV in the commune before or during the study period, number (%) 935 (24%) 1091 (27%) 1.11 [0.68–1.81]
0.67c ND ND
Distance from the capital Port-au-Prince, mean (SD; 10 km) 14.5 (8.1) 16.8 (7.8) 1.02 [0.97–1.08]
0.44c ND ND
Distance from the department capital, mean (SD; 10 km) 3.4 (2.7) 4.3 (3) 0.92 [0.86–0.98]
<0.01c 0.94
[0.88–1]
0.06
Mountainous commune, no. of alerts (%) 1456 (38%) 1646 (41%) 1.01 [0.68–1.50]
0.96c ND ND
Comparisons between responded and non-responded alerts were estimated using generalized linear mixed models with a binomial distribution. a
Response rates for each class are summarized inS3 Tableprovided as supplementary information b
For each of these univariate analyses, communes, departments or NGOs was modeled as a unique random effect variable. c
For these univariate analyses, communes, departments and NGOs were modeled as random effect variables, with communes nested within departments. Models provided a commonP-value for both random effects.
d
For the multivariate analysis, the model included communes, departments and NGOs as random effect variables, with communes nested within departments, and all fixed variables for which univariateP-value was <0.25 The model provided a common P-value for random effect variables.
SD, standard deviation; cOR, crude odds ratio; aOR, adjusted odds ratio; 95%-CI, 95% confidence interval; ND, no data (variables not included in the multivariate analysis).
communes and departments, which reflects logistic obstacles to reach cholera outbreaks in remote areas, as confirmed by the significantly lower odds of CATI response during heavy rainfall. Response to alerts was however not significantly hampered by the distance between the affected commune and Port-au-Prince, probably thanks to the decentralized response capacity at the department level. Finally, the odds of response were significantly higher forred
alerts thanorange alerts, and significantly more complete CATIs were conducted in response
tored alerts affecting the more populated communes, thus suggesting that response teams
pri-oritized more severe outbreaks, as requested.
To monitor the response strategy, we chose to use alerts that were retrospectively computed based on consolidated surveillance databases [19]. Cholera alerts proved to be a practical and original indicator, albeit with several limits. Alerts could not be used to accurately assess response promptness because the weekly alert time scale largely exceeded the 48-hour inter-vention deadline that mobile teams were requested to respect. As the quality of reporting
Table 3. Intensity and quality of case-area targeted interventions (CATIs) in response to cholera alerts from July 2013 to June 2017: Factors associated with the inci-dence of complete CATIs per responded alert (negative-binomial mixed models).
Univariate analysisbc Multivariate analysisd cIR
[95%-CI]
p-value aIR
[95%-CI]
p-value
Mean number of complete CATIs per responded alert, 5.1 (SD, 7.8)
Commune <0.0001b
Departmenta <0.0001b
NGO responsible for CATIa 0.98b
Commune, department and NGO random effectsd <0.001
Alert level,red vs. orangea 1.72
[1.60–1.85]
<0.0001c 1.85
[1.72–1.98]
<0.0001
Semester since mid-2013a 1.21
[1.18–1.23]
<0.0001c 1.22
[1.20–1.25]
<0.0001
Weekly UNICEF disbursements for CATIs, mean (SD; $10,000 USD) 1.03 [1.02–1.03]
<0.0001c 1.00
[0.99–1.01]
0.84
Weekly accumulated rainfall in the commune, mean (SD; cm) 1.00 [0.99–1.01]
0.92c ND ND
Population of the commune, mean (SD; 10,000 inhab.) 1.02 [1.01–1.03]
<0.0001c 1.02
[1.01–1.02]
<0.0001
OCV in the commune before or during the study period, number (%) 1.18 [0.92–1.51]
0.18c 0.99
[0.81–1.20]
0.91
Distance from the capital Port-au-Prince, mean (SD; 10 km) 1.01 [0.98–1.04]
0.4c ND ND
Distance from the department capital, mean (SD; 10 km) 0.96 [0.93–1.00]
<0.05c 1.00
[0.97–1.02]
0.77
Mountainous commune, number of alerts (%) 1.05 [0.85–1.29]
0.65c ND ND
Comparison of the number of complete CATIs per responded alert was estimated using generalized linear mixed models with a negative-binomial distribution. a
Number of complete CATIs for each class are summarized inS3 Tableprovided as supplementary information. b
For each of these univariate analyses, communes, departments or NGOs was modeled as unique random effect variables. c
For these univariate analyses, communes, departments and NGOs were modeled as random effect variables, with communes nested within departments. Models provided a common p-value for both random effects.
d
For all multivariate analysis, the model included communes, departments and NGOs as random effect variables, with communes nested within departments, and all fixed variables for which univariate p-value was <0.25 The model provided a common p-value for random effect variables.
SD, standard deviation; cIR, crude incidence ratio; aIR, adjusted incidence ratio; 95%-CI, 95% confidence interval; ND, no data (variables not included in the multivariate analysis).
appeared heterogeneous especially at the beginning of the study period, we could not analyze CATI details, such as the exact quantities of distributed items, nor medical activities carried out by MOH mobile teams and medical NGOs, such as active case finding and chemoprophy-laxis. Several other organizations also operated in community cholera prevention during the study period, such as Brigada Me´dica Cubana, Me´decins sans Frontières–Netherlands, Ghes-kio, Zanmi Lasante, and Canadian Red Cross. However, their cholera field response activities appeared limited in comparison with the 31,306 CATIs included in the present study (field investigation results). Finally, the results may have been biased by the fact that our statistical analyses did not really consider temporal and spatial autocorrelation of alerts and targeted interventions. Both aspects were however partially included in the mixed models, by assessing the covariates semester and remoteness of communes and departments. We therefore believe our analyses were relevant enough to assess the overall dynamics and key determinants of tar-geted intervention implementation.
Further evaluation is required to assess several additional outputs and outcomes of response interventions, including exact promptness (daily scale); exact geographic targeting; number of persons reached; education session methodology; quantity of distributed items; changes in knowledge, attitude and practice of targeted households concerning handwashing, defecation and water treatment [48,66,67]. Analysis of data from surveys conducted two weeks after the initial response intervention to assess water treatment in targeted households is ongoing. Con-sidering the potential risk of bacterial drug resistance [52], the use of doxycycline chemopro-phylaxis should be evaluated in detail. After three years of reactive use and regular monitoring of antibiotic resistance by the MOH, it seems that no resistantVibrio cholerae clinical strains
have been isolated in Haiti (unpublished data from the MOH).
This study was not designed to evaluate the effectiveness and impact of the response strat-egy. Pre-published complementary results suggest that this CATI strategy was significantly effective in mitigating and shortening cholera outbreaks between 2015 and 2017 in Centre Department [68]. Another similar study is underway for the entire country. In addition to the OCV campaigns that have targeted 10% of the population since 2012 [69], the slow progress achieved in water infrastructure provision [70], and the other prevention activities conducted by the MOH, DINEPA and other organizations, this national alert-response strategy may thus have contributed to reduce cholera incidence in 2014 and since 2017 [3].
The present evaluation thus shows that the unprecedented large-scale implementation of CATIs to control cholera is achievable and may cost less than $1 USD per inhabitant and per year. This strategy however requires continuous efforts to improve response exhaustiveness, intensity and quality. Uniform methodology, centralized coordination, decentralized response capacity, and sustained funding should be key elements of similar strategies. Recent prelimi-nary results concerning CATI effectiveness in Haiti seem promising [68] and will help to opti-mize future elimination efforts. In Haiti, CATIs still constitute a core element of the 2016– 2018 mid-term development of the national plan for cholera elimination [71] and the UN’s new approach to cholera in Haiti, which was adopted by the General Assembly in December 2016 [72]. On a global scale, rapid response has also become a key component of the new multi-sectoral approach promoted by the Global Task Force on Cholera Control to reduce cholera deaths by 90% and eliminate the disease in 20 countries by 2030 [73]. Together with the results of ongoing impact studies, these lessons learnt from the field will be very informa-tive for actors and international donors involved in cholera control and elimination, both in Haiti and other countries affected by cholera outbreaks.
Supporting information
S1 Table. Main organizations involved in case-area targeted interventions.
(PDF)
S1 Fig. Organization of cholera surveillance and rapid response in Haiti.
(PDF)
S1 Text. Narrative of the epidemic and response dynamics.
(PDF)
S2 Table. Definitions of cholera alerts used in the study.
(PDF)
S3 Table. Response to alerts, CATI activities in responded alerts, number of complete CATIs for responded alerts. Difference between departments, NGOs, alert levels, and
semes-ters over the course of the study. (PDF)
S2 Fig. Response to cholera alerts by case-area targeted interventions during the same week, from July 2013 to June 2017: responded and non-responded red and orange alerts
(Panel A) and number of complete CATIs per responded alert (Panel B). Difference between alert levels, change over the course of the eight-semester study period, and difference between departments.
(PDF)
S4 Table. List of the databases used in the study.
(PDF)
S1 Database. Databases used in the study.
(XLSX)
Acknowledgments
We are grateful to the people who organized the strategy at the national and departmental lev-els. We also thank the staff of Ministry of Health, UNICEF, DINEPA and NGOs, who cared for patients, conducted alert investigations, implemented and coordinated field responses, gathered epidemiological and intervention data, analyzed stool cultures, or compiled and pro-spectively analyzed the cholera and interventions databases.
Author Contributions
Conceptualization: Stanislas Rebaudet, Gregory Bulit, Jean Gaudart, Aaron Aruna Abedi,
Florence Duperval Guillaume, Edouard Beigbeder, Renaud Piarroux.
Data curation: Stanislas Rebaudet, Gregory Bulit, Edwige Michel, Claudia Evers, Samuel
Beaulieu, Robert Barrais, Katilla Pierre, Jacques Boncy, Paul Adrien.
Formal analysis: Stanislas Rebaudet, Jean Gaudart.
Funding acquisition: Gregory Bulit, Claudia Evers, Samuel Beaulieu, Jacques Boncy, Paul
Adrien, Florence Duperval Guillaume, Edouard Beigbeder, Renaud Piarroux.
Investigation: Stanislas Rebaudet, Pierre Gazin, Claudia Evers, Samuel Beaulieu, Aaron Aruna
Abedi, Lindsay Osei.
Project administration: Stanislas Rebaudet, Renaud Piarroux. Supervision: Renaud Piarroux.
Validation: Jean Gaudart, Samuel Beaulieu, Sandra Moore, Jacques Boncy, Renaud Piarroux. Visualization: Stanislas Rebaudet.
Writing – original draft: Stanislas Rebaudet, Lindsay Osei, Sandra Moore, Renaud Piarroux. Writing – review & editing: Stanislas Rebaudet, Gregory Bulit, Jean Gaudart, Edwige Michel,
Pierre Gazin, Claudia Evers, Samuel Beaulieu, Aaron Aruna Abedi, Lindsay Osei, Robert Barrais, Katilla Pierre, Sandra Moore, Jacques Boncy, Paul Adrien, Florence Duperval Guil-laume, Edouard Beigbeder, Renaud Piarroux.
References
1. Piarroux R, Barrais R, Faucher B, Haus R, Piarroux M, Gaudart J, et al. Understanding the cholera epi-demic, Haiti. Emerg Infect Dis. 2011; 17: 1161–1168.https://doi.org/10.3201/eid1707.110059PMID: 21762567
2. Orata FD, Keim PS, Boucher Y. The 2010 Cholera Outbreak in Haiti: How Science Solved a Contro-versy. PLoS Pathog. 2014; 10: e1003967.https://doi.org/10.1371/journal.ppat.1003967PMID: 24699938
3. Republic of Haiti. Ministry of Public Health and Population. Centre de Documentation. Bulletins cholera 2010–2018.http://mspp.gouv.ht/newsite/documentation.php. Accessed 1 Sep 2018.
4. Global Task Force on Cholera Control. Cholera outbreak: assessing the outbreak response and improv-ing preparedness. Geneva: World Health Organization (WHO); 2010 Nov p. 87.http://www.who.int/ cholera/publications/OutbreakAssessment/en/. Accessed 1 Sep 2018
5. Barzilay EJ, Schaad N, Magloire R, Mung KS, Boncy J, Dahourou GA, et al. Cholera Surveillance during the Haiti Epidemic—The First 2 Years. N Engl J Med. 2013; 368: 599–609.https://doi.org/10.1056/ NEJMoa1204927PMID:23301694
6. Santa-Olalla P, Gayer M, Magloire R, Barrais R, Valenciano M, Aramburu C, et al. Implementation of an Alert and Response System in Haiti during the Early Stage of the Response to the Cholera Epidemic. Am J Trop Med Hyg. 2013; 89: 688–697.https://doi.org/10.4269/ajtmh.13-0267PMID:24106196 7. Gelting R, Bliss K, Patrick M, Lockhart G, Handzel T. Water, Sanitation and Hygiene in Haiti: Past,
Pres-ent, and Future. Am J Trop Med Hyg. 2013; 89: 665–670.https://doi.org/10.4269/ajtmh.13-0217PMID: 24106193
8. Gartley M, Valeh P, Lange R de, DiCarlo S, Viscusi A, Lenglet A, et al. Uptake of household disinfection kits as an additional measure in response to a cholera outbreak in urban areas of Haiti. J Water Health. 2013; 11: 623–628.https://doi.org/10.2166/wh.2013.050PMID:24334836
9. Eisenberg MC, Kujbida G, Tuite AR, Fisman DN, Tien JH. Examining rainfall and cholera dynamics in Haiti using statistical and dynamic modeling approaches. Epidemics. 2013; 5: 197–207.https://doi.org/ 10.1016/j.epidem.2013.09.004PMID:24267876
10. Health Section of the Secretariat of the League of Nations. Cholera, 2013. Wkly Epidemiol Rec. 2014; 89: 345–355.
11. Rebaudet S, Gazin P, Barrais R, Moore S, Rossignol E, Barthelemy N, et al. The dry season in Haiti: a window of opportunity to eliminate cholera. PLoS Curr Outbreaks. 2013; 5.https://www.doi.org/10. 1371/currents.outbreaks.2193a0ec4401d9526203af12e5024ddcPMID:23873011
12. Republic of Haiti, Ministry of Public Health and Population, National Directorate for Water Supply and Sanitation. National Plan for the Elimination of Cholera in Haiti 2013–2022. Port-au-Prince, Haïti; 2013 Feb p. 114.http://www.paho.org/hq/index.php?option=com_docman&task=doc_view&gid=
20326&Itemid=270&lang=en. Accessed 1 Sep 2018
13. Re´publique d’Haïti, Ministère de la Sante´ Publique (MSPP). Enquête Mortalite´, Morbidite´ et Utilisation des Services—EMMUS-V—HAI¨TI 2012. Pe´tionville, Haïti: Institut Haïtien de l’Enfance; 2013 Avril p. 536.http://mspp.gouv.ht/site/downloads/Rapport%20preliminaire%20final%20EMMUS-V.pdf. Accessed 1 Sep 2018
14. Ivers LC, Teng JE, Lascher J, Raymond M, Weigel J, Victor N, et al. Use of Oral Cholera Vaccine in Haiti: A Rural Demonstration Project. Am J Trop Med Hyg. 2013; 89: 617–624.https://doi.org/10.4269/ ajtmh.13-0183PMID:24106187
15. Rouzier V, Severe K, Juste MAJ, Peck M, Perodin C, Severe P, et al. Cholera Vaccination in Urban Haiti. Am J Trop Med Hyg. 2013; 89: 671–681.https://doi.org/10.4269/ajtmh.13-0171PMID:24106194 16. Ministry of Health Haiti. Vaccination against Cholera in two areas in Haiti, 2013. WHO Glob Immun
Newsl GIN. 2014; 6.
17. Roy M, Zinck RD, Bouma MJ, Pascual M. Epidemic cholera spreads like wildfire. Sci Rep. 2014; 4: srep03710.https://doi.org/10.1038/srep03710PMID:24424273
18. North MP, Stephens SL, Collins BM, Agee JK, Aplet G, Franklin JF, et al. Reform forest fire manage-ment. Science. 2015; 349: 1280–1281.https://doi.org/10.1126/science.aab2356PMID:26383934 19. Rebaudet S, Bulit G, Gaudart J, Michel E, Gazin P, Evers C, et al. The national alert-response strategy
against cholera in Haiti: a four-year assessment of its implementation. bioRxiv. 2018. Preprint.https:// doi.org/10.1101/259366
20. Azurin JC, Alvero M. Field evaluation of environmental sanitation measures against cholera. Bull World Health Organ. 1974; 51: 19–26. PMID:4549038
21. Deb BC, Sircar BK, Sengupta PG, De SP, Mondal SK, Gupta DN, et al. Studies on interventions to pre-vent eltor cholera transmission in urban slums. Bull World Health Organ. 1986; 64: 127–131. PMID: 3488134
22. Taylor DL, Kahawita TM, Cairncross S, Ensink JHJ. The Impact of Water, Sanitation and Hygiene Inter-ventions to Control Cholera: A Systematic Review. PLoS ONE. 2015; 10: e0135676.https://doi.org/10. 1371/journal.pone.0135676PMID:26284367
23. George CM, Monira S, Sack DA, Rashid M-U, Saif-Ur-Rahman KM, Mahmud T, et al. Randomized Con-trolled Trial of Hospital-Based Hygiene and Water Treatment Intervention (CHoBI7) to Reduce Cholera. Emerg Infect Dis. 2016; 22: 233–241.https://doi.org/10.3201/eid2202.151175PMID:26811968 24. Curtis V, Cairncross S. Effect of washing hands with soap on diarrhoea risk in the community: a
system-atic review. Lancet Infect Dis. 2003; 3: 275–281. PMID:12726975
25. Fewtrell L, Kaufmann RB, Kay D, Enanoria W, Haller L, Colford JM. Water, sanitation, and hygiene interventions to reduce diarrhoea in less developed countries: a systematic review and meta-analysis. Lancet Infect Dis. 2005; 5: 42–52.https://doi.org/10.1016/S1473-3099(04)01253-8PMID:15620560 26. Cairncross S, Hunt C, Boisson S, Bostoen K, Curtis V, Fung IC, et al. Water, sanitation and hygiene for
the prevention of diarrhoea. Int J Epidemiol. 2010; 39: i193–i205.https://doi.org/10.1093/ije/dyq035 PMID:20348121
27. Ramesh A, Blanchet K, Ensink JHJ, Roberts B. Evidence on the Effectiveness of Water, Sanitation, and Hygiene (WASH) Interventions on Health Outcomes in Humanitarian Crises: A Systematic Review. PLoS ONE. 2015; 10: e0124688.https://doi.org/10.1371/journal.pone.0124688PMID:26398228 28. Pollitzer R. Cholera studies- 11. Prevention and control. Bull World Health Organ. 1957; 17: 67–162.
PMID:13479774
29. Brown V, Jacquier G, Bachy C, Bitar D, Legros D. Prise en charge des e´pide´mies de chole´ra dans un camp de re´fugie´s. Bull Socie´te´ Pathol Exot 1990. 2002; 95: 351–354.
30. UNICEF. UNICEF—Cholera Toolkit. New York, NY; 2013.https://www.unicef.org/cholera_toolkit/. Accessed 1 Sep 2018
31. Debes AK, Ali M, Azman AS, Yunus M, Sack DA. Cholera cases cluster in time and space in Matlab, Bangladesh: implications for targeted preventive interventions. Int J Epidemiol. 2016; 45: 2134–2139. https://doi.org/10.1093/ije/dyw267PMID:27789673
32. Azman AS, Luquero FJ, Salje H, Mbaïbardoum NN, Adalbert N, Ali M, et al. Micro-Hotspots of Risk in Urban Cholera Epidemics. J Infect Dis. 2018; 218: 1164–1168.https://doi.org/10.1093/infdis/jiy283 PMID:29757428
33. Finger F, Bertuzzo E, Luquero FJ, Naibei N, Toure´ B, Allan M, et al. The potential impact of case-area targeted interventions in response to cholera outbreaks: A modeling study. PLoS Med. 2018; 15: e1002509.https://doi.org/10.1371/journal.pmed.1002509PMID:29485987
34. Rowe A, Angulo FJ, L R, R T. Chlorinating well water with liquid bleach was not an effective water disin-fection strategy in Guinea-Bissau. Int J Env Health Res. 1998; 8: 339–340.https://doi.org/10.1080/ 09603129873444
35. Dunston C, McAfee D, Kaiser R, Rakotoarison D, Rambeloson L, Hoang AT, et al. Collaboration, chol-era, and cyclones: a project to improve point-of-use water quality in Madagascar. Am J Public Health. 2001; 91: 1574–1576.https://doi.org/10.2105/AJPH.91.10.1574PMID:11574309
36. Einarsdo´ ttir J, Passa A, Gunnlaugsson G. Health education and cholera in rural Guinea-bissau. Int J Infect Dis IJID Off Publ Int Soc Infect Dis. 2001; 5: 133–138.
37. Piarroux R. [Management of a cholera epidemic by a humanitarian organization]. Med Trop (Mars). 2002; 62: 361–367.
38. Gue´vart E, Van Hecke C, Noeske J, Solle´ J, Bita Fouda A, Manga B. [Handmade devices for continuous delivery of hypochlorite for well disinfection during the cholera outbreak in Douala, Cameroon (2004)]. Med Trop. 2008; 68: 507–513.
39. Kakar F, Ahmadzai AH, Habib N, Taqdeer A, Hartman AF. A successful response to an outbreak of cholera in Afghanistan. Trop Doct. 2008; 38: 17–20.https://doi.org/10.1258/td.2006.006336PMID: 18302855
40. Bartels SA, Greenough PG, Tamar M, VanRooyen MJ. Investigation of a cholera outbreak in Ethiopia’s Oromiya Region. Disaster Med Public Health Prep. 2010; 4: 312–317.https://doi.org/10.1001/dmp. 2010.44PMID:21149233
41. Cavallaro EC, Harris JR, da Goia MS, dos Santos Barrado JC, da No´brega AA, de Alvarenga de Junior IC, et al. Evaluation of pot-chlorination of wells during a cholera outbreak, Bissau, Guinea-Bissau, 2008. J Water Health. 2011; 9: 394–402. PMID:21942203
42. Deepthi R, Sandeep SR, Rajini M, Rajeshwari H, Shetty A. Cholera outbreak in a village in south India —Timely action saved lives. J Infect Public Health. 2013; 6: 35–40.https://doi.org/10.1016/j.jiph.2012. 05.003PMID:23290091
43. Date K, Person B, Nygren B, Were V, Kola S, Ayers T, et al. Evaluation of a Rapid Cholera Response Activity—Nyanza Province, Kenya, 2008. J Infect Dis. 2013; 208: S62–S68.https://doi.org/10.1093/ infdis/jit198PMID:24101647
44. Bwire G, Mwesawina M, Baluku Y, Kanyanda SSE, Orach CG. Cross-Border Cholera Outbreaks in Sub-Saharan Africa, the Mystery behind the Silent Illness: What Needs to Be Done? PloS One. 2016; 11: e0156674.https://doi.org/10.1371/journal.pone.0156674PMID:27258124
45. Ngwa MC, Liang S, Mbam LM, Mouhaman A, Teboh A, Brekmo K, et al. Cholera public health surveil-lance in the Republic of Cameroon-opportunities and challenges. Pan Afr Med J. 2016; 24: 222.https:// doi.org/10.11604/pamj.2016.24.222.8045PMID:27800077
46. Wang A, Hardy C, Rajasingham A, Martinsen A, Templin L, Kamwaga S, et al. Notes from the Field: Chlorination Strategies for Drinking Water During a Cholera Epidemic—Tanzania, 2016. MMWR Morb Mortal Wkly Rep. 2016; 65: 1150–1151.https://doi.org/10.15585/mmwr.mm6541a6PMID:27764079 47. Ohene S-A, Klenyuie W, Sarpeh M. Assessment of the response to cholera outbreaks in two districts in
Ghana. Infect Dis Poverty. 2016; 5: 99.https://doi.org/10.1186/s40249-016-0192-zPMID:27802834 48. International Health Partnership (IHP+), World Health Organization (WHO). Monitoring, evaluation and
review of national health strategies: a country-led platform for information and accountability. Geneva: World Health Organization (WHO); 2011.http://apps.who.int/iris/handle/10665/85877. Accessed 15 Jan 2019
49. Azman AS, Rudolph KE, Cummings DAT, Lessler J. The incubation period of cholera: A systematic review. J Infect. 2013; 66: 432–8.https://doi.org/10.1016/j.jinf.2012.11.013PMID:23201968 50. Poncelet JL. Cholera in Haiti: successes and challenges in a low income country. Wkly Epidemiol Rec.
2015; 90: 542–544. PMID:26433984
51. Feachem RG, Bradley DJ, Garelick H, Mara DD. Vibrio cholerae and cholera. Sanitation and Disease: Health Aspects of Excreta and Wastewater Management. Chichester: Published for the World Bank by John Wiley & Sons Ltd; 1983. pp. 297–325.http://documents.worldbank.org/curated/en/1983/01/ 439534/sanitation-disease-health-aspects-excreta-wastewater-management. Accessed 1 Sep 2018
52. Reveiz L, Chapman E, Ramon-Pardo P, Koehlmoos TP, Cuervo LG, Aldighieri S, et al. Chemoprophy-laxis in Contacts of Patients with Cholera: Systematic Review and Meta-Analysis. PLoS ONE. 2011; 6. https://doi.org/10.1371/journal.pone.0027060PMID:22102873
53. Grandesso F. The use of doxycycline to prevent cholera. Twenti-sixth Scientific Day of Epicentre; 2016 Jun 2; Paris, France.
54. UNICEF Haiti. Michel Ange works towards eliminating cholera in Haiti [Film].https://www.youtube.com/ watch?v=KOYRX4Fmabo. Accessed 1 Sep 2018
55. IHSI (Institut Haitien de Statistique et d’Informatique), Direction des Statistiques De´ mographiques et Sociales, Ministère de l’Economie et des Finances, Re´publique d’Haïti. Population totale, population de 18 ans et plus, Me´nages et densite´s estime´ s en 2015. Port-au-Prince, Haiti; 2015 Mar p. 129.http:// ihsi.ht/pdf/projection/Estimat_PopTotal_18ans_Menag2015.pdf. Accessed 1 Sep 2018
56. OpenStreetMap. Available:https://www.openstreetmap.org/. Accessed 1 Sep 2018
57. FAO Emergency for Haiti. Haiti—Agro Ecological Zones. Food and Agriculture Organization of the United Nations (FAO); 2010. Available:http://www.fao.org/fileadmin/user_upload/emergencies/docs/ haiti-earthquake-map-agro%20ecological%20zones-FAO.pdf. Accessed 1 Sep 2018
58. NASA GES DISC. Giovanni online data system.https://giovanni.gsfc.nasa.gov/giovanni/. Accessed 1 Sep 2018
59. Berridge DM, Crouchley R. Multivariate Generalized Linear Mixed Models Using R. 1 edition. Boca Raton, FL: CRC Press; 2011.
60. Mickey RM, Greenland S. The impact of confounder selection criteria on effect estimation. Am J Epide-miol. 1989; 129: 125–137.https://doi.org/10.1093/oxfordjournals.aje.a115101PMID:2910056 61. Open Source Geospatial Foundation Project. Système d’Information Ge´ographique QGIS.http://www.
qgis.org/fr/site/. Accessed 1 Sep 2018
62. RStudio.https://www.rstudio.com/. Accessed 1 Sep 2018
63. R Foundation for Statistical Computing. R: A Language and Environment for Statistical Computing. https://www.r-project.org/. Accessed 1 Sep 2018
64. Wickham H. ggplot2: Elegant Graphics for Data Analysis. 2nd ed. 2016 edition. New York, NY: Springer; 2016.
65. Bates D, Ma¨chler M, Bolker B, Walker S. Fitting Linear Mixed-Effects Models Using lme4. J Stat Softw. 2015; 67: 1–48.https://doi.org/10.18637/jss.v067.i01
66. Beau De Rochars VEM, Tipret J, Patrick M, Jacobson L, Barbour KE, Berendes D, et al. Knowledge, attitudes, and practices related to treatment and prevention of cholera, Haiti, 2010. Emerg Infect Dis. 2011; 17: 2158–2161.https://doi.org/10.3201/eid1711.110818PMID:22204033
67. Lantagne D, Bastable A, Mintz E. Innovative WASH interventions to prevent cholera. Wkly Epidemiol Rec. 2015; 90: 534–537. PMID:26433981
68. Michel E, Gaudart J, Beaulieu S, Bulit G, Piarroux M, Boncy J, et al. Effectiveness of Case-Area Tar-geted Response Interventions Against Cholera: A Quasi-Experimental Study in Haiti. SSRN. 2018. Pre-print.https://papers.ssrn.com/abstract=3304278. Accessed 3 Feb 2019
69. Ivers LC. Eliminating Cholera Transmission in Haiti. N Engl J Med. 2017; 376: 101–103.https://doi.org/ 10.1056/NEJMp1614104PMID:27959699
70. Re´publique d’Haïti, Ministère de la Sante´ Publique (MSPP), Institut Haïtien de l’Enfance (IHE), The DHS Program. Haïti. Enquête Mortalite´, Morbidite´ et Utilisation des Services (EMMUS-VI). 2016–2017. Pe´tionville, Haïti: Institut Haïtien de l’Enfance; 2018 Juillet p. 646.https://www.cliohaiti.org/IMG/pdf/ haiti_enquete_mortalite_2c_morbidite_et_utilisation_des_services_emmus-vi_2016-2017_5bfr326_ 5d_1_.pdf. Accessed 3 Feb 2019
71. Re´publique d’Haïti, Ministère de la Sante´ Publique et de la Population, Direction Nationale de l’Eau Potable et de l’Assainissement. Plan national d’e´limination du chole´ra. De´veloppement du moyen terme. Juillet 2016—De´ cembre 2018. Re´publique d’Haïti; 2016.http://mspp.gouv.ht/newsite/?p=4387. Accessed 1 Sep 2018
72. United Nations. UN News—General Assembly calls on Member States to support new UN approach to cholera in Haiti. In: UN News Centre. 16 Dec 2016.http://www.un.org/apps/news/story.asp?NewsID= 55817#.WFaNb5Ipf0E. Accessed 1 Sep 2018
73. Global Task Force on Cholera Control. Ending Cholera. A Global Roadmap to 2030. Geneva: World Health Organization (WHO); 2017 Oct p. 32.https://reliefweb.int/sites/reliefweb.int/files/resources/ global-roadmap.pdf. Accessed 1 Sep 2018