HAL Id: hal-00476710
https://hal.archives-ouvertes.fr/hal-00476710
Submitted on 27 Apr 2010
HAL is a multi-disciplinary open access
archive for the deposit and dissemination of
sci-entific research documents, whether they are
pub-lished or not. The documents may come from
teaching and research institutions in France or
abroad, or from public or private research centers.
L’archive ouverte pluridisciplinaire HAL, est
destinée au dépôt et à la diffusion de documents
scientifiques de niveau recherche, publiés ou non,
émanant des établissements d’enseignement et de
recherche français ou étrangers, des laboratoires
publics ou privés.
To cite this version:
Ricardo Martinez, Martine Collard. Extracted knowledge interpretation in mining biological data:
A survey. International Journal of Computer Science & Applications, 2007, 4 (2), pp.145-163.
�hal-00476710�
Mining Biological Data : a Survey
Ricardo Martinez
aMartine Collard
bEXECO Project
Laboratoire I3S - CNRS UMR 4070
Les Algorithmes, 2000 route des Lucioles,
BP.121 - 06903 Sophia-Antipolis - France
Email:
a[email protected],
b[email protected]
Abstract
This paper discusses different approaches for integrating biological knowledge in gene ex-pression analysis. Indeed we are interested in the fifth step of microarray analysis proce-dure which focuses on knowledge discovery via interpretation of the microarray results. We present a state of the art of methods for processing this step and we propose a classification in three facets: prior or knowledge-based, standard or expression-based and co-clustering. First we discuss briefly the purpose and usefulness of our classification. Then, following sec-tions give an insight into each facet. We summarize each section with a comparison between remarkable approaches.
Keywords: data mining, knowledge discovery, bioinformatics, microarray, biological sources of information, gene expression, integration.
1
Introduction
Nowadays, one of the main challenges in gene expression technologies is to highlight the main co-expressed1and co-annotated2gene groups using at least one of the different sources
of biological information [1]. In other words, the issue is the interpretation of microarray results via integration of gene expression profiles with corresponding biological gene anno-tations extracted from biological databases.
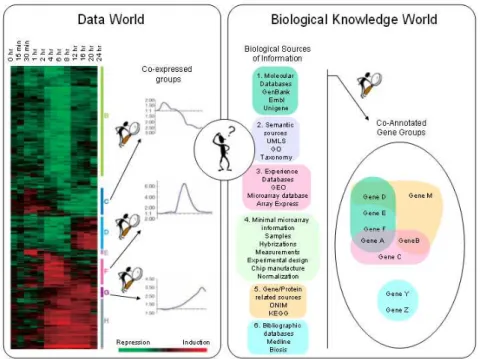
Analyzing microarray data consists in five steps: protocol and image analysis, statistical data treatment, gene selection, gene classification and knowledge discovery via data inter-pretation [2]. We can see in Figure 1 the goal of the fifth analysis step devoted to interpre-tation, which is the integration between two domains, the numeric one represented by the gene expression profiles and the knowledge one represented by gene annotations issued from different sources of biological information.
At the beginning of gene expression technologies, researches were focused on the numeric3
side. So, there have been reported ([3, 4, 5, 6, 7, 8]) a variety of data analysis approaches which identify groups of co-expressed genes based only on expression profiles without taking into account biological knowledge. A common characteristic of purely numerical approaches is that they determine gene groups (or clusters) of potential interest. However, they leave to the expert the task of discovering and interpreting biological similarities hidden within these groups. These methods are useful, because they guide the analysis of the co-expressed gene groups. Nevertheless, their results are often incomplete, because they do not include biological considerations based on prior biologists knowledge.
1Co-expressed gene group: group of genes with a common expression profile.
2Co-annotated gene group: group of genes with the same annotation. A gene annotation is a piece of biological
information related to the gene that can be relational, syntactical, functional, etc.
3We understand by numeric part the analysis of the gene expression measures only, disregarding the biological
Figure 1: Interpretation of microarray results via integration of gene expression profiles with corresponding sources of biological information
In order to process the interpretation step in an automatic or semi-automatic way, the bioin-formatics community is faced to an ever-increasingly volume of sources of biological infor-mation on gene annotations. We have classified them into the following six sources of bio-logical information: molecular databases (GenBank, Embl, Unigene, etc.); semantic sources as thesaurus, ontologies, taxonomies or semantic networks (UMLS, GO, Taxonomy, etc.); experience databases (GEO, Arrayexpress, etc.); bibliographic databases (Medline, Biosis, etc.); Gene/protein related specific sources (ONIM, KEGG, etc.); and minimal microarray information as seen in 1. Exploiting these different sources of biological information is quite a complex task so scientists developed several tools for manipulating them or integrate them into more complex databases [9], [10].
This paper presents a complete survey of the different approaches for automatic integration of biological knowledge with gene expression data. A first discussion of these methods is presented by Chuaqui in [11]. Here we present an original classification of the different microarray analysis interpretation approaches.
The interpretation step may be defined as the result of the integration between gene expres-sion profiles analysis with corresponding gene annotations. This integration process consists in grouping together co-expressed and co-annotated genes. Based on this definition, three research axes may be distinguished: the prior or knowledge-based axis, the standard or expression-based axisand the co-clustering axis. Our classification emphasizes the weight of the integration process scheduling on the final results [12, 13, 14, 15].
Indeed the main criteria underlying the classification we propose is the scheduling of phases which alternatively consider gene measures or gene annotations. In prior or knowledge-based approaches, first the co-annotated gene groups are built and then the gene expression profiles are integrated. In standard or expression-based approaches, first co-expressed gene groups are built and then gene annotations are integrated. Finally, co-clustering approaches integrate co-expressed and co-annotated gene groups at the same time.
This paper is organized in the following way: each section fully explains the corresponding interpretation axis, giving an insight and a comparison of their remarkable approaches. Then, we develop a discussion among the three interpretation axis.
2
Prior or Knowledge-Based Axis
Prior or knowledge-based approaches are based on biological knowledge from the sources of biological information (see Figure 1). Therefore, first they build co-annotated gene groups sharing the same biological annotations. Then, they integrate the expression profiles informa-tion for each of the genes classified into co-annotated groups, highlighting those ones which are co-expressed. Later on, the statistical significance of co-annotated and co-expressed gene groups is tested. We give a detail description of this three-step methodology: co-annotated gene groups composition, gene expression profiles integration and significant co-annotated and co-expressed gene groups selection.
2.1
Prior or Knowledge-based Methodology
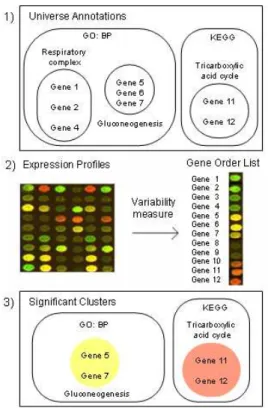
1. Co-Annotated Gene Groups Composition There exist several ways to build co-annotated gene groups. We present here one structured way of building them. First, we need to choose among different sources of biological information. Each kind of information is stored in a specific format (xml, sql, etc. ) and has intrinsic characteristics. In each case, the analy-sis process needs to deal with each biological source format. Another issue is to choose a nomenclature for each gene identity that has to be coherent with the sources of information and thereafter with the expression data. Next, all the annotations of each gene are to be col-lected in one or more sources of information. Finally, we gather in a subset of genes that share the same annotation. Thus, we obtain all the co-annotated gene groups as shown in Figure 2.
2. Gene Expression Profiles Integration There are different ways to integrate gene ex-pression profiles with previously built co-annotated gene groups. Here we present one current way to do it. First, expression profiles measures are taken for each gene. Then, a variability measure, as f old change or t − statistic or f − score [16] is used to build a sorted list of gene-ranks based on expression profiles. Finally, this measure is incorporated gene by gene into the co-annotated groups. Thus, we obtain co-annotated gene groups with the expression profiles information within as shown in Figure 2.
3. Selection of the Significant Co-Annotated and Co-Expressed Gene Groups At this stage all co-annotated and co-expressed gene groups are built. The next step is to reveal which of these groups or subgroups are statistically significant. To tackle this issue the most frequent technique is the statistical hypothesis testing. Here, we present the four steps for statistical hypothesis testing:
a) Formulate the null hypothesis, H0,
H0: Commonly, that the genes that are co-annotated and co-expressed were expressed
together as the result of pure chance.versus the alternative hypothesis, H1,
H1 : Commonly, that the co-expressed and co-annotated gene groups are found to-gether because of a biological effect combined with a component of chance variation. b) Identify a test statistic: The test is based on a probability distribution that will be used
Figure 2: Gene expression profiles integration into previously co-annotated groups
c) Compute the p − value: The p − value is the probability that a test statistic at least as significant as the one observed would be obtained assuming that the null hypothesis was true.
d) Compare the p − value: This consists in comparing the p − value to an acceptable significance value α. If p − value ≤ α we can consider that the co-annotated and co-expressed gene group is gathered by a biological effect and thus is statistically sig-nificant. Consequently, the null hypothesis is ruled out, and the alternative hypothesis is valid.
At the end of the four-step methodology explained before, the prior approaches present the interpretation results as significant co-expressed and co-annotated groups of genes (see third step of Figure 2). The next section will present some of the most remarkable approaches and methods of the prior or knowledge-based axis.
2.2
Remarkable Prior or Knowledge-based Approaches
We present here four representative approaches: GSEA [17], iGA [18], PAGE [19] and CGGA [20]. In the following we describe each of them and emphasize some parameters particularly: the source of biological information, the profiles expression measure, the ex-pression variability measure, the hypothesis testing parameters and details (type of test, test statistic, distribution, corrections etc.).
1. Gene Set Enrichment Analysis, GSEA
This approach [17] proposes a statistical method designed to detect coordinated changes in expression profiles of pre-defined groups of co-annotated genes. This method is born from
the need of interpreting metabolic pathways results, where a group of genes is supposed to move together along the pathway.
In the first step, it builds a priori defined gene sets using specific sources of information which are the NetAFFX and GenMapp metabolic pathways databases.
In the second step, it takes the Signal to Noise Ratio (SNR) to measure the expression profiles of each gene within the co-annotated group. Then it builds a sorted list of genes for each of the co-annotated groups.
Third, it uses a non-parametric statistic: enrichment score, ES, (based in a Kolmogorov-Smirnoff normalized statistic) for hypothesis testing. It takes as null hypothesis:
H0: The rank ordering of genes is random with regard of the sample.
Then, it assesses the statistical significance of the maximal ES by running a set of permu-tations among the samples. Finally, it compares the max ES with a threshold α, obtaining the significant co-expressed and co-annotated gene groups.
2. Parametric Analysis of Gene Set Enrichment, PAGE
This approach [19] detects co-expressed genes within a priori co-annotated groups of genes like GSEA, but it implements a parametric method.
In first step, it builds a priori defined gene sets from Gene Ontology (GO)4, NetAFFX5 and GenMapp6metabolic databases.
In second step, it takes the f old change to measure the expression profiles of each gene within the co-annotated group. Then, it builds a z−score from the corresponding f old change of the two comparative groups (normal versus non normal) as variability expression measure.
Third, it uses the z − score as parametric test statistic. Then, it uses the central limit theorem [21] to argue that when the sampling size of a co-annotated group is large enough, it would have a normal distribution. Using the null hypothesis:
H0: The z − score within the groups has a standard normal distribution.
Thus, if the size of the co-annotated gene groups is not big enough to reach normality, then it would be significantly co-expressed.
3. Iterative Group Analysis, iGA
This approach [18] finds co-expressed gene groups within a priori functionally enriched groups, sharing the same functional annotation.
In a first step, it builds a priori functionally enriched groups of genes from Gene Ontology (GO) or other sources of biological information.
In a second step, it uses the f old change gene expression measure to build a complete sorted list of genes. Then, it generates a reduced sorted list specific to the functionally en-riched group.
In a third step, it calculates iteratively the probability of change for each functionally en-riched group (based in the cumulative hypergeometric distribution). It states the null hypoth-esis:
H0 : The top x genes are associated by chance within the functionally
enriched group.
Then, it assesses the statistical significance of each group comparing the probability of change p − value against a user-determined α value.
4. Co-expressed Gene Group Analysis, CGGA
This approach [20] automatically finds co-expressed and co-annotated gene groups.
4http://www.geneontology.org 5http://www.affymetrix.com/analysis 6http://www.genmapp.org
In a first step, it builds a priori defined gene groups from a source of biological information for instance Gene Ontology (GO) and KEGG7.
In a second step, it uses the f old change as a gene expression measure. Then, it composes the f −score from the corresponding gene’s f old change. Using the f −score on each gene it builds a sorted list of gene ranks. Then, it generates a reduced list of gene ranks specific to the co-annotated enriched group.
In a third step, it states the null hypothesis:
H0 : x genes from a annotated gene group (or subgroup) are
co-expressed by chance.
A hypergeometric distribution and p − value calculated from the cumulative distribution is assumed. This p − value is compared against α to reveal all the significant co-expressed and co-annotated gene groups, including all the possible subgroups.
2.3
Comparison between Prior or Knowledge-based Approaches
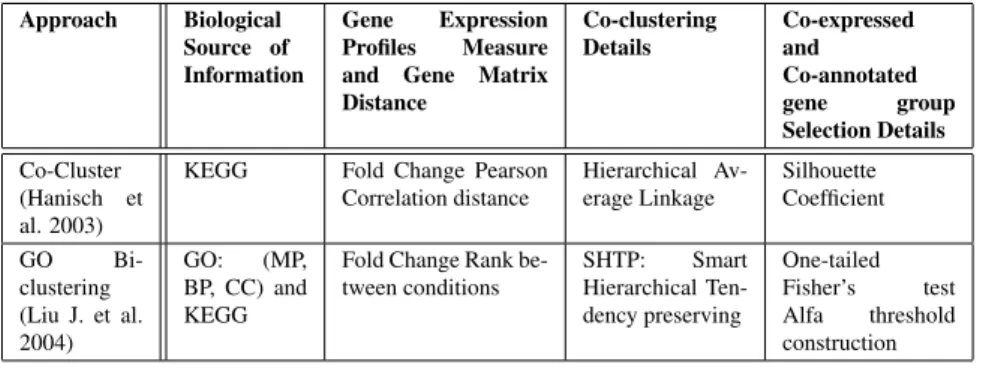
Table I presents the brief summary of the four prior approaches described in last section. For each approach the four following parameters are presented: sources of biological informa-tion used, expression profile measure, variability expression measure and hypothesis testing details (test statistic, distribution and particular characteristics).
First of all, the four approaches are concerned by metabolic pathways within biological processes, but they use different sources of information: iGA, PAGE and CGGA uses Gene Ontology and GSEA uses manual metabolic annotations, GENMAPP and NetAffx. CGGA is the only one which uses KEGG database combined with Gene Ontology.
For expression profiles parameters, GSEA is the only one which choice is the SNR measure while the others opted for the f old change measure. PAGE and CGGA use respectively z −score and f −score variability measures to detect the changes in gene expression profiles. For hypothesis testing, GSEA is the only one which uses a non parametric method based on a maximal ES statistic and sampling to calculate the p−value. In the contrary, PAGE (normal distribution), CGGA (hypergeometric distribution) and iGA (hypergeometric distribution) chose a parametric approach. iGA chose a hypothesis proof based in the most over-expressed or under-expressed genes (in the rank list) of a co-annotated group, while CGGA searches all the possible co-expressed subgroups within a co-annotated group (the internal sub-group position in the group does not matter).
3
Standard or Expression-based Approach
This axis is called standard because it follows the more frequent procedure for microarray data analysis, which consists of five steps: image analysis, statistical data treatment, genes selection, genes classification and results interpretation via biological knowledge integration. This axis has been used since the beginning of microarray technology with encouraging in-terpretation results [4], [5] and [3]. Thereafter, it has been used as the reference methodology in microarray data analysis. Expression-based approaches start by building gene groups or clusters of genes sharing similar expression profiles. Then, they integrate the biological an-notations of each gene contained inside the expression cluster, building co-expressed and annotated subsets of genes. Later on, the statistical significance of expressed and co-annotated gene groups is tested. In the following section, we explain in detail this three-step methodology: gene expression profiles classification, biological annotations integration and significant co-expressed and co-annotated gene groups selection.
Approach Biological Source of Information Expression Profile Measure Variability Expression Measure
Hypothesis Testing Details
GSEA (Mootha et al. 2003) Manual Annotations, NetAffx and GENMAPP SNR (Signal to Noise Ra-tio) Mean Ex-pression Difference
One-tailed test. Test sta-tistic: Maximal ES. Non-parametric distribution. iGA
(Breitling et al. 2004)
GO Fold Change Fold Change
One-tailed test. Modi-fied Fisher’s exact statis-tic: The most over or Un-der expressed Genes in a group. Hypergeometric dis-tribution.
PAGE (Kim et al. 2005)
GO Fold Change z-score One-tailed test. z-score sta-tistic. Normal distribution. CGGA (Martinez et al. 2006) GO: (MP, BP, CC) and KEGG
Fold Change F-score One-tailed test. Modi-fied Fisher’s exact statistic: All over or under expressed genes in a group. Hyperge-ometric distribution. Bino-mial distribution for N large. Bonferroni Correction. TABLEI
COMPARISON BETWEEN FOUR KNOWLEDGE-BASED INTEGRATION APPROACHES
3.1
Standard or Expression-based Methodology
1. Gene Expression Profiles Classification There exist several methods for classifying gene expression profiles from cleaned microarray data, i.e. data matrix of thousands of genes measured in tens of biological conditions. Various supervised methods and non supervised methods tackled the gene classification issue. Between the most common methods, we can mention: hierarchical clustering, k-means, Diana, Agnes, Fanny [22], model-based clustering [23] support vector machines SVM, self organizing maps (SOM), and even association rules (see more details in [24]).
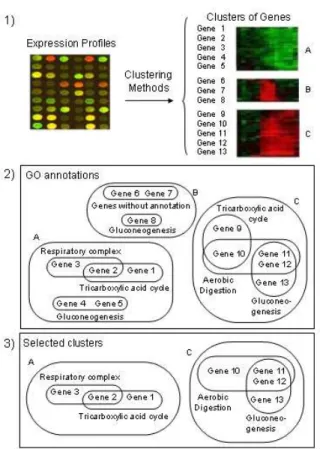
The target of these methods is to classify genes into clusters sharing similar gene expres-sion profiles as shown in the first step of Figure 3.
2. Biological Annotations Integration Once clusters of genes are built by similar expres-sion levels, each gene annotation is extracted from sources of biological information. As in prior axis, this step deal with different formats of information. A list of annotations is composed for each gene, and then all the annotations are integrated into the clusters of genes (previously built by co-expression profiles). Thus, subsets of co-annotated and co-expressed gene groups are built within each cluster. Figure 3 illustrates this process: three clusters of similar expression profiles are first built, and then all the individual gene annotations are col-lected to be incorporated in each cluster. For example in the first under-expressed green group we have found three subsets of co-annotated genes. These subsets are respiratory complex: Gene E and Gene D, gluconeogenesis: Gene G and Y and tricarboxylic acid cycle Gene E and Gene T. We can observe intersections of genes within the under-expressed cluster because of the different annotations that each gene may have. Thus, we obtain all the co-annotated gene groups.
3. Selection of the Significant Co-Annotated and Co-Expressed Gene Groups At this stage all the co-expressed and co-annotated gene groups are built and the issue is to reveal
Figure 3: Interpretation of microarray results via integration of gene expression profiles with corresponding sources of biological information
which of these groups or the possible subgroups are statistically significant. The most current technique in use is the statistical hypothesis testing (see Figure 3).
Afterward, this full three-step methodology the expression-based approaches present the interpretation results as significant co-expressed and co-annotated groups of genes.
The next section presents some of the most representative approaches and methods of the expression-based axis. Since these approaches are quite numerous, we have classified them according their main source of biological information. Thus, we have the following clas-sification: minimal information approaches, ontology approaches and bibliographic source approaches.
3.2
Expression-based Semantic Approaches
Expression-based semantic approaches integrate fundamentally semantic annotations (con-tained in ontologies, thesaurus, semantic networks etc.) into co-expressed gene groups. Nowadays, semantic sources of biological information i.e. structured and controlled vocabu-laries are one of the best available sources of information to analyze microarray data in order to discover meaningful rules and patterns [1].
Actually, expression-based semantic approaches are widely exploited. In this section we present seven among them: FunSpec [25], OntoExpress [26], Quality Tool [27], EASE [28], THEA [29], Graph Theoretic Modeling [12] and GENERATOR [30]. Each approach uses Gene Ontology (GO) as source of biological annotation, sometimes combined with another gene/protein related specific sources as MIPS, KEGG, Pfam, Smart, etc. or molecular data-base as Embl, SwissProt8, etc.
During last years, GO has been chosen preferably over other sources of information, be-cause of its non ambiguous and comprehensible structure. That is the reason of the recent explosion of many more expression-based GO approaches. Among these approaches, we can cite the integration tools which integrate gene expression data with GO as GoMiner [31], FatiGO [32], Gostat [33], GoToolbox [34], GFINDer [35], CLENCH [36], BINGO [37], etc. This up to date GO compendium9gives more integration methods, GO searching tools, GO browsing tools and related GO tools.
In the next section, we describe seven remarkable expression-based semantic solutions.
3.3
Remarkable Expression-based Semantic Approaches
1. FunSpec: web-based cluster interpreter
This approach [25] proposes a statistical evaluation of groups of co-expressed genes and proteins with respect to existing annotations.
It takes as input clusters of genes previously built by similarity in expression. Then it searches for all gene and protein annotations in four biological sources of information: Gene Ontology (GO), Munich Information Center for Protein Sequences (MIPS)10, Nucleotide
se-quence database (EMBL)11, Protein families of alignments and HMMs (Pfam)12. It builds
all the subsets of co-annotated and co-expressed gene and protein groups within each cluster. It makes the selection of the significant subsets (really functionally enriched) via hypothesis testing. It states the null hypothesis:
H0 : A functionally enriched group of genes is associated by chance within the cluster of co-expressed genes.
8http://www.ebi.uniprot.org
9http://www.geneontology.org/GO.tools.shtml 10http://mips.gsf.de
11http://www.ebi.ac.uk/embl
This one-tailed hypothesis is solved on the basis of an hypergeometric distribution and using a p − value calculated from the cumulative distribution as in Fisher’s exact test [38]. A Bonferroni correction is applied to compensate for multiple testing. Finally, it assesses the statistical significance of each group comparing the p − value against a user-determined α value (more details in [39]).
2. Onto-Express: Global functional profiling of gene expression
This approach [26] proposes several statistical evaluations of co-expressed gene groups with respect to GO existing annotations. It takes as input clusters of genes previously built by similarity in expression. In a second step, it takes all the existing GO annotations included in three ontologies, molecular function, cellular component and biological process. Then, it builds all the subsets of co-annotated and co-expressed gene groups within each cluster.
In a third step, it makes the selection of the significant subsets rejecting the null hypothesis: H0: A GO annotated group of genes is associated by chance within the
cluster of co-expressed genes.
This one-tailed hypothesis is solved using a probability distribution and using a p − value calculated from the cumulative distribution. Finally, it assesses the statistical significance of each group comparing the p − value against a user-determined α value. Onto-Express gives the following test options: binomial distribution [21] (when the number of genes is very large), Fisher’s exact test [40] (when the number of genes is not too important), and χ2
test for equality of proportions [41].
3. Quality Tool: judging the quality of gene expression-based clustering methods
This approach [27] proposes a measure for testing the quality of clusters of gene expression profiles based on mutual information between cluster membership and known gene annota-tions. In a first step, it takes clusters of co-expressed genes. In a second step, it takes all the existing GO annotations included in the three ontologies: molecular function, cellular com-ponent and biological process. Then, it builds a wide matrix of GO attributes for all genes containing 1 if the gene matches the attribute and 0 if not. It builds a contingency table for each cluster-attribute pair, from which it computes cluster-attribute entropy and mutual infor-mation [42]. In a third step, it compares this measure with clusters grouped by chance from the same microarray experiments, to check if they are better than random clusters.
This approach uses the same one-tailed hypothesis as seen before (Onto-Express and Fun-Spec), but it supposes a normal distribution and uses z − score statistic for calculations. Finally, it obtains co-expressed and co-annotated significants groups of genes.
4. Identifying biological themes within lists of genes
This approach [28] provides a friendly interface for quick annotation of genes within a cluster, giving a selection method for co-expressed and co-annotate gene groups. In a first step, it takes clusters of co-expressed genes (previously made by classification algo-rithms). In a second step it takes the available gene annotations from GO, KEGG, Swiss-Prot, PFAM, SMART. Then, it builds all the subsets of co-annotated and co-expressed gene groups within each cluster. In a third step, it shows the statistically significant co-expressed and co-annotated gene groups.
This approach uses the same one tailed hypothesis testing assumptions: null hypothesis, hypergeometric distribution, fisher’s exact test, p − value and α as used in Onto-Express and FunSpec. The only difference is the use of an alternative statistic named ease − score, which is a conservative adjustment that weights statistical significance in favor of co-annotated groups supported by more genes.
5. THEA: Tools for high-throughput experiments analysis
This approach [29] proposes a set of tools designed for manipulating microarray results ob-tained by hierarchical clustering trees. It integrates gene annotations from biological sources of information and evaluates co-expressed and co-annotated groups of genes.
It takes as input clusters of genes obtained by a hierarchical clustering algorithm. Then, it queries a database in order to obtain all the possible gene annotations from the ontologies in GO on biological process, molecular function and cellular component. Then, it shows all the possible subsets of co-annotated and co-expressed gene groups within each cluster. It displays graphically the statistical evaluation of the co-expressed and co-annotated gene groups. This approach uses the same one tailed hypothesis: H0, Fisher’s exact test, p − value and α set of
values as used in Onto-Express and FunSpec. 6. Graph-theoretic modeling
This approach [12] extracts common GO annotations of the genes within a cluster of co-expressed genes through the modified structure of gene ontology called GO tree.
In a first step, it takes as input clusters of co-expressed genes obtained with any clustering technique. In a second step, it annotates all genes in a cluster with GO terms, taking into account the hierarchical nature of GO. It proposes a quantitative measure for estimating how well gene clusters of expression profiles are gathered together along with known GO cate-gories. This measure is based in a graphical distance between nodes in the directed acyclic graph (DAG) of GO. In a third step, it compares this quantitative measure with the same measure taken from random clusters to see if it is better or not. Thus, it obtains co-expressed and co-annotated significants groups of genes.
7. GENERATOR: Theme discovery from gene lists for identification and viewing of multi-ple functional groups
This approach [30] takes co-expressed gene groups and it splits them into homogeneous co-annotated significant groups within each group.
In a first step, it takes co-expressed gene groups. In a second step, it takes all GO annota-tions (studying each GO ontology separately) for each gene group. Then, it runs a clustering algorithm based in a Non-negative Matrix Factorization (NMF) to create a k-means (begins with k=2) partition of co-annotated groups within each gene group. This process is repeated, applying k-means algorithm (increasing each time the number of k clusters) and building a non-nested hierarchical clustering tree. At each step, it tests for significant co-expressed and co-annotated groups. For this purpose, it uses one-sided test hypothesis with the same as-sumptions: null hypothesis: H0, hypergeometric distribution, fisher’s exact test, p − value
and α as used in Onto-Express.
3.4
Expression-based Bibliographic Approach
Nowadays bibliographic databases represent one of the richest update sources of biological information. This type of information, however, is under-exploited by researchers because of the highly unstructured free-format characteristics of the published information and because of its overwhelming volume. The main challenges coming up with bibliographic databases integration are to manage interactions with textual sources (abstracts, articles etc.) and to re-solve syntactical problems that appears in biological language like synonyms or ambiguities. At the moment, some text mining methods and tools have been developed for manipulate this kind of biological textual information. Among these methods we can mention Suiseki [43] which focuses on the extraction and visualization of protein interactions, MedMinder [44] takes advantage of GeneCards13as a knowledge source and offers gene information related
to specific keywords, XplorMed [45] which presents specified gene-information through user interaction, EDGAR [46] which extracts information about drugs and genes relevant to cancer from the biomedical literature, GIS [47] which retrieves and analyzes gene-related informa-tion from PubMed14abstracts. These methods are useful as stand-alone applications but they
do not integrate gene expression profiles.
13http://www.genecards.org 14http://www.pubmed.gov
Approach Biological Source of Information
Hypothesis-testing Type and Statistics Hypothesis-testing Dis-tribution and details Distinctive Characteristic FunSpec (Robinson et al. 2002) GO, MIPS, EMBL and Pfam One-tailed test Fisher’s exact statistic Hypergeome-tric Bonferroni Correction
Online integration of 4 dif-ferent sources of biologi-cal information OntoExpress (Draghici et al. 2002) GO (MP, BP and CC) One-tailed test Fisher’s exact statistic χ2 statistic Binomial Hy-pergeometric χ2
Choice of 3 different sta-tistical methods Quality Tool (Gibbons et al. 2002) GO (MP, BP and CC) One-tailed test z-score
Normal Measure based in cluster-attribute Entropy and mu-tual information EASE (Ho-sack et al. 2003) GO, KEGG, Pfam, Smart, and Swis-sProt One-tailed test Fisher’s exact statistic Hypergeo-metric Ease correction
Friendly interface for quick gene annotation
THEA (Pasquier et al. 2004) GO (MP, BP and CC) One-tailed test Fisher’s exact statistic Hypergeome-tric Binomial Bonferroni Correction
Friendly interface for quick annotation and cluster’s analysis Graph Theoretic Modeling (Sung 2004) GO (MP, BP and CC) One-tailed test Average PD statistic Non-Parametric
Graphical method who proposes an Average statistic for cluster’s significance GENE-RATOR (Pehkonen et al. 2005) GO (MP, BP and CC) One-tailed test Fisher’s exact statistic Hypergeome-tric Non-negative matrix factorization to create k-means partition. Results presented as a non-nested hierarchical tree Annotation-Tool (Masys et al. 2001) Medline (abstracts), Mesh (key-words), UMLS One-tailed test Estimated likelihood Vs. Observed likeli-hood Semi-Parametric: Empirical Likelihood
Hierarchical groups of co-annotated groups within co-expressed clusters
TABLEII
We define expression-based bibliographic approaches as methods that integrates at least one of the bibliographic databases (Medline, Biosis, MeSH, etc.) annotations into co-expressed gene groups. Only a small number of approaches have integrated this kind of biological infor-mation into co-expressed gene groups. Masys et al. [48] proposed to use keyword hierarchies to interpret gene expression patterns for integrating bibliographic databases.
In a first step, his method proposes to take as input clusters of genes grouped by similarity in expression (previously built by any of the supervised or non supervised methods). Sec-ond, it searches for gene indexing terms contained in some PubMed articles. Then, it trans-lates these indexing terms to MeSH15 “keywords” terms. Later, it combines the UMLS16 knowledge, the enzyme code nomenclature and MeSH terms to build hierarchical groups of genes classified by annotation. Third, it makes the selection of the significant groups of co-annotated genes in each co-expressed cluster. For this purpose, it states:
H0: Keyword would appear at or above the observed frequency by chance
in a group of keywords of the same size within the cluster of co-expressed genes.
This hypothesis test is solved by comparing the observed versus the expected frequency of each keyword retrieved in association with a set of genes and a p − value estimate of the likelihood under the null hypothesis. Finally, it obtains co-expressed and co-annotated significant groups of genes.
3.5
Comparison between several Expression-based Approaches
Table II presents a brief summary of eight expression-based approaches. The comparison is based on four characteristics: the source of biological information, the hypothesis-testing type and statistics, the hypothesis-testing distribution and a distinctive characteristic.
All the approaches appear in chronological order, the first one integrates bibliographic sources of information i.e. Medline abstracts and the seven others integrate semantic sources of information principally GO, sometimes combined with another gene/protein related spe-cific sources as MIPS, KEGG, Pfam, Smart, etc. or molecular database as Embl, SwissProt, etc.
Concerning selecting co-expressed and co-annotated gene groups all the approaches have chosen a one-tailed test. FunSpec, OntoExpress, EASE, THEA and Generator have opted for Fisher’s exact statistic, and their statistical evaluation methods have small variations. FunSpec, THEA, EASE, Generator have used the typical fisher’s test with hypergeometric distribution. The first two of these have chosen bonferroni correction against multi-testing problem and EASE has used an ease-score correction against the over-representation weight given in bigger gene groups by Fisher’s test. Only two approaches Graph Theoretic Model-ing and AnnotationTool have chose non-parametric and semi-parametric statistical evaluation models respectively.
The last column in Table II contains an important distinctive feature. For example GEN-ERATOR uses a particular method based on k − means that builds a non-nested hierarchical tree, as final result.
4
Co-Clustering Axis
From the beginning of gene expression technologies, clustering algorithms were focused on grouping gene expression profiles with biological conditions [16]. Sources of biological in-formation and well structured ontologies as GO and KEGG particularly, are constantly
grow-15http://www.nlm.nih.gov/mesh 16http://umlsks.nlm.nih.gov
ing in quantity and quality and have opened the interpretation challenge of grouping hetero-geneous data as numeric gene expression profiles and textual gene annotations. Co-clustering approaches focus their effort to answer this challenge. Each co-clustering approach has its specific parameters: biological source of information, clustering method and integration al-gorithm. They generally follow a three-step methodology described in the following.
New co-clustering integration approaches are currently one of the interpretation challenges in gene expression technologies. At the moment, few co-clustering approaches have been reported since the principal barrier is the difficulty to build clustering methods fitting hetero-geneous sources of information. Among the co-clustering approaches we can cite Co-Cluster [15] and Bicluster [14] described in subsection remarkable co-clustering methods.
4.1
Co-Clustering Methodology
In a first step, they state two different measures: one measure to manipulate gene expression profiles and the other one for gene annotations in an independent manner.
In a second step, they apply an integration criterion (merging function, graphical function etc.) within the co-clustering algorithm for building the co-expressed and co-annotated gene groups simultaneously.
They select the significant co-expressed and co-annotated gene groups. In the last step, most recent solutions [49], [50], [51], [52], [53], [54] and [55] test the quality of the final clusters.
4.2
Remarkable Co-Clustering Methods
1. Co-cluster: Co-clustering of biological networks and gene expression data
This approach [15] constructs a merging distance function which combines information from gene expression data and metabolic networks, computing a joint clustering of co-expressed genes and vertices (annotations from KEGG database) of the network.
In a first step, it computes two distances: a network distance obtained from the proximity of enzymes in the metabolic pathway network beneath undirected graph form, and a gene expression distance obtained from Pearson correlation coefficients of expression matrix [56]. In a second step, it builds a merging function that consists in a mapping that relates genes to enzymes nodes in the undirected graph. Then, it applies hierarchical average linkage clustering algorithm using the merged (enzyme-gene) distance.
Finally, it evaluates the significant co-expressed and co-annotated clusters using the silhou-ette coefficient [57]. This quality cluster method determines the number of optimal clusters in a hierarchical dendrogram.
2. Bi-cluster: Gene Ontology friendly bi-clustering of expression profiles
This approach [58] directly incorporates Gene Ontology information into the gene expres-sion clustering process, using Smart Hierarchical Tendency Preserving clustering algorithm (SHTP). HTP is a bi-clustering algorithm capable of discovering gene expression patterns embedded in only a subset of conditions. It becomes “Smart” when it integrates the GO functional annotations.
In a first step, it calculates two trees, the Tendency Preserving (TP) Cluster tree obtained from gene expression matrix (rank measures) and the Gene Ontology tree decomposition obtained from GO gene annotations.
In a second step, it builds a hierarchical structure by mapping the TP cluster tree onto GO Hierarchy.
While applying HTP clustering algorithm, the GO annotations tree is useful for two pur-poses: assessing functional enrichments of a cluster (using one-tailed Fisher’s test as shown in OntoExpress) and selecting the subset of conditions critical to a function category (build-ing the α threshold). Finally, the subset of co-expressed genes contained in the subset of the
Approach Biological Source of Information
Gene Expression Profiles Measure and Gene Matrix Distance Co-clustering Details Co-expressed and Co-annotated gene group Selection Details Co-Cluster (Hanisch et al. 2003)
KEGG Fold Change Pearson Correlation distance Hierarchical Av-erage Linkage Silhouette Coefficient GO Bi-clustering (Liu J. et al. 2004) GO: (MP, BP, CC) and KEGG
Fold Change Rank be-tween conditions SHTP: Smart Hierarchical Ten-dency preserving One-tailed Fisher’s test Alfa threshold construction TABLEIII
CO-CLUSTERINGINTEGRATIONAPPROACHES
GO annotations tree becomes the selected significant group of co-annotated and co-expressed genes by tendency.
4.3
Comparison between Co-clustering Approaches
Table III presents a brief summary of the two co-clustering approaches explained in last sub-section. It is based on four parameters: source of biological information, expression profile measure, co-clustering details, and co-expressed and co-annotated gene groups selection de-tails as seen in Table III.
Both approaches select well-structured ontologies: KEGG database in Co-Cluster and GO for Bi-Cluster. These ontologies have a graph-based representation that allows the clustering algorithm to integrate gene expression profiles with gene database annotations.
For manipulating gene expression measures, both methods use f old change expression measures. Nevertheless, co-cluster chooses Pearson’s correlation coefficient as gene to gene distance and bi-cluster chooses a gene tendency measure based in the gene-rank between biological conditions.
Concerning to co-clustering details, both co-cluster and bi-cluster have chosen a hierarchi-cal clustering method. However, co-cluster has opted for typihierarchi-cal hierarchihierarchi-cal average linkage algorithm and bi-cluster has developed the Smart Hierarchical Tendency preserving (SHTP) algorithm.
Related to gene group selection, co-cluster uses the silhouette coefficient for determining the quality of the clusters built (selecting the significant ones). In the other hand, bi-cluster states for a selection in two different stages.
First it uses standard one-tailed Fisher’s test for calculate the p−value for the co-annotated and co-expressed gene groups and then it builds a particular α threshold for each of them. Finally, as seen in the previous approaches, it compares p − value against α to select or not the co-expressed and co-annotated gene group.
5
Discussion
The bioinformatics community has developed many approaches to tackle the interpretation microarray challenge, we classify them in three different interpretation axes: prior, standard and co-clustering. The important intrinsic characteristics of each axis have been developed before.
Standard or expression-based approaches give importance to gene expression profiles. However, microarray history has revealed intrinsic errors in microarray measures and
proto-cols that increase during the whole microarray analysis process. Thus, the expression-based interpretation results can be severely biased [13], [14].
On the other hand prior or knowledge-based approaches give importance to biological knowledge. Nevertheless, all sources of biological information fix many integration con-straints: the database format or structure, the weak quantity of annotated genes or the avail-ability of maintaining up to date and well revised annotations for instance. Consequently, the knowledge-based interpretation results can be poor or somewhat quite small in relation to the whole studied biological process.
Co-clustering approaches represent the best compromise in terms of integration, giving the same weight to expression profiles and biological knowledge. But, they have to deal with the algorithmic issue of integrating these two elements at the same time. However, they are often forced to give more weight to one of these elements. In the last section above, we have seen two examples: co-cluster algorithm gives more weight to knowledge, and expression profiles were used to guide the clustering analysis while hand bi-cluster algorithm gives more weight to tendency in expression profiles and GO annotations are used to guide the clustering analysis.
Indeed, the improvement of microarray data quality, microarray process analysis and the completion of biological information sources should make the interpretations results more independent on the interpretation axis.
As long as there is not enough reliability on these main elements, the choice of the inter-pretation approach remains of crucial importance for the final interinter-pretation results.
References
[1] T. Attwood and C. J. Miller, “Which craft is best in bioinformatics?” Computer Chem-istry, vol. 25, pp. 329–339, 2001.
[2] A. Zhang, Advanced analysis of gene expression microarray data, 1st ed., ser. Science, Engineering, and Biology Informatics. World Scientific, 2006, vol. 1.
[3] R. Cho, M. Campbell, and E. Winzeler, “A genome-wide transcriptional analysis of the mitotic cell cycle,” Molecular Cell, vol. 2, pp. 65–73, 1998.
[4] J. DeRisi, L. Iyer, and V. Brown, “Exploring the metabolic and genetic control of gene expression on a genomic scale,” Science, vol. 278, pp. 680–686, 1997.
[5] M. Eisen, P. Spellman, P. Brown, and D. a. Botsein, “Cluster analysis and display of genome wide expression patterns,” in Proceedings of the National Academy of Sciences of the USA, vol. 95, no. 25, 1998, pp. 14 863–8.
[6] P. Tamayo and D. Slonim, “Interpreting patterns of gene expression with self-organizing maps: Methods and application to hematopoietic differentiation,” in Proceedings of the National Academy of Sciences of the USA, vol. 96, 1999, pp. 2907–2912.
[7] S. Tavazoie, J. Hughes, M. Campbell, R. Cho, and G. Church, “Systematic determina-tion of genetic network architecture,” Nature Genetics, vol. 22, pp. 281–285, 1999. [8] A. Ben-Dor, R. Shamir, and Z. Yakhini, “Clustering gene expression patterns,”
Compu-tational Biology, vol. 6, pp. 281–297, 1999.
[9] C. Blaschke, L. Hikrschman, and A. Valencia, “Co-clustering of biological networks and gene expression data,” Bioinformatics, vol. 18, pp. S145–S154, 2002.
[10] H. Muller, E. Kenny, and P. Sternberg, “Textpresso: An ontology-based information retrieval and extraction system for biological literature,” PLoS Biology, vol. 2, no. 11, p. 309, 2004.
[11] G. Churchill, “Fundamentals of experimental design for cdna micro-arrays,” Nature Genetics, vol. 32, pp. 490–495, 2002.
[12] S. G. Lee, J. U. Hur, and Y. S. Kim, “A graph theoretic modeling on go space for biolo-gical interpretation of gene clusters,” Bioinformatics, vol. 3, pp. 381–386, 2004. [13] Z. Fang, J. Yang, Y. Li, Q. Luo, and L. Liu, “Knowledge guided analysis of microarray
data,” Biomedical Informatics, vol. 10, pp. 1–11, 2005.
[14] J. Liu, J. Yang, and W. Wang, “Biclustering in gene expression data by tendency,” in Computational Systems Bioinformatics Conference, CSB 2004 Proceedings, 2004, pp. 182–193.
[15] D. Hanisch, A. Zien, R. Zimmer, and T. Lengauer, “Co-clustering of biological net-works and gene expression data,” Bioinformatics, vol. 18, pp. S145–S154, 2002. [16] A. Riva, A. Carpentier, B. Torresani, and A. Henaut, “Comments on selected
funda-mental aspects of microarray analysis,” Computational Biology and Chemistry, vol. 29, pp. 319–336, 2005.
[17] V. Mootha, C. Lindgren, K. Eriksson, and A. Subramanian, “Pgc-l’alpha-reponsive genes involved in oxidative phosphorylation are coordinately downregulated in human diabetes,” Nature Genetics, vol. 34, no. 3, pp. 267–273, 2003.
[18] R. Breitling, A. Amtmann, and P. Herzyk, “IGA: A simple tool to enhance sensitiv-ity and facilitate interpretation of microarray experiments,” BMC Bioinformatics, vol. 2005, no. 34, 2004.
[19] S. Kim and D. Volsky, “Page: Parametric analysis of gene set enrichment,” BMC Bioin-formatics, vol. 6, p. 144, 2005.
[20] R. Martinez, N. Pasquier, C. Pasquier, M. Collard, and L. Lopez-Perez, “Co-expressed gene groups analysis (CGGA): An automatic tool for the interpretation of microarray experiments,” Journal of Integrative Bioinformatics, vol. 3, no. 11, pp. 1–12, 2006. [21] W. Feller, An Introduction to Probability Theory and Its Applications, 3rd ed. Wiley
and sons, 1971.
[22] L. Kaufman and P. Rousseeuw, Findings Groups in Data. An introduction to Cluster Analysis. New York, USA: Wiley and Sons, 1990.
[23] J. Banfield and A. Raftery, “Model-based gaussian and non-gaussian clustering,” Bio-metrics, vol. 49, pp. 803–822, 1993.
[24] K. Cios, W. Pedrycz, and R. Swiniarski, Data Mining Methods for Knowledge Discov-ery. Boston/London: Kluwer Academic Publishers, 1998.
[25] M. Robinson, “Funspec : a web based cluster interpreter for yeast,” BMC Bioinformat-ics, vol. 3, p. 35, 2002.
[26] S. Draghici and P. Khatri, “Global functional profiling of gene expression,” Genomics, no. 81, pp. 1–7, 2003.
[27] D. Gibbons and F. Roth, “Judging the quality of gene expression-based clustering meth-ods using gene annotation,” Genome Research, vol. 12, pp. 1574–1581, 2002.
[28] D. Hosack and G. Dennis, “Identifying biological themes within lists of genes with ease,” Genome Biology, vol. 4, no. 70, 2003.
[29] C. Pasquier, F. Girardot, K. Jevardat, and R. Christen, “Thea : Ontology-driven analysis of microarray data,” Bioinformatics, vol. 20, no. 16, 2004.
[30] P. Pehkonen, G. Wong, and P. Toronen, “Theme discovery from gene lists for identifi-cation and viewing of multiple functional groups,” BMC Bioinformatics, vol. 6, p. 162, 2005.
[31] W. Feng, G. Wang, B. Zeeberg, K. Guo, A. Fojo, D. Kane, W. Reinhold, S. Lababidi, J. Weinstein, and M. Wang, “Development of gene ontology tool for biological inter-pretation of genomic and proteomic data,” in AMIA Annual Symposium Proceedings, 2003, p. 839.
[32] F. Al-Shahrour, R. Diaz-Uriarte, and J. Dopazo, “Fatigo: a web tool for finding signifi-cant associations of gene ontology terms with groups of genes,” Bioinformatics, vol. 20, no. 4, pp. 578–580, 2004.
[33] T. Beissbarth and T. Speed, “Gostat: find statistically overrepresented gene ontologies within a group of genes,” Bioinformatics, vol. 20, no. 9, pp. 1464–1465, 2004.
[34] D. Martin, C. Brun, E. Remy, P. Mouren, D. Thieffry, and B. Jacq, “Gotoolbox: func-tional analysis of gene datasets based on gene ontology,” Genome Biology, vol. 5, no. 12, 2004.
[35] M. Masseroli, D. Martucci, and F. Pinciroli, “Gfinder: Genome function integrated discoverer through dynamic annotation, statistical analysis, and mining,” Nucleic Acids Research, vol. 32, pp. 293–300, 2004.
[36] N. Shah and N. Fedoroff, “Clench: a program for calculating cluster enrichment using the gene ontology,” Bioinformatics, vol. 20, pp. 1196–1197, 2004.
[37] S. Maere, K. Heymans, and M. Kuiper, “Bingo: a cytoscape plugin to assess overrepre-sentation of gene ontology categories in biological networks,” Bioinformatics, vol. 21, pp. 3448–3449, 2005.
[38] R. Fisher, “On the interpretation of x2 from contingency tables, and the calculation of p,” Journal of the Royal Statistical Society, vol. 85, no. 1, pp. 87–94, 1922.
[39] K. Kerr and G. Churchill, “Statistical design and the analyissi of gene expression mi-croarray data,” Genetics Research, vol. 77, pp. 123–128, 2001.
[40] M. Man, Z. Wang, and Y. Wang, “Power sage: comparing statistical test for sage exper-iments,” Bioinformatics, vol. 16, no. 11, pp. 953–959, 2000.
[41] L. Fisher and G. Van Belle, Biostatistics: a methodology for health sciences. New York, USA: Wiley and Sons, 1993.
[42] T. Cover and J. Thomas, Elements of information theory. New York, USA: Wiley-Interscience, 1991.
[43] C. Blaschke, R. Hoffmann, A. Valencia, and J. Oliveros, “Extracting information au-tomatically from biological literature,” Comparative and Functional Genomics, vol. 2, no. 5, pp. 310–313, 2001.
[44] L. Tanabe, U. Scherf, L. Smith, J. Lee, L. Hunter, and J. Weinstein, “Medminer: an in-ternet text-mining tool for biomedical information, with application to gene expression profiling,” Biotechniques, vol. 27, no. 6, pp. 1210–1217, 1999.
[45] C. Perez-Iratxeta, P. Bork, and M. Andrade, “Exploring medline abstracts with xplormed,” Drugs Today, vol. 38, no. 6, pp. 381–389, 2002.
[46] T. Rindflesch, L. Tanabe, J. Weinstein, and L. Hunter, “Edgar: extraction of drugs, genes and relations from the biomedical literature,” in Proceedings of the Pacific Symposium on Biocomputing, 2000, pp. 517–528.
[47] J. Chiang, H. Yu, and H. Hsu, “Gis: a biomedical text-mining system for gene informa-tion discovery,” Bioinformatics, vol. 1, no. 20, pp. 120–121, 2004.
[48] D. Masys, “Use of keyword hierarchies to interpret gene expressions patterns,” Bioin-formatics, vol. 17, pp. 319–326, 2001.
[49] K. Zhang and H. Zhao, “Assessing reliability of gene clusters from gene expression data,” Functional Integrative Genomics, pp. 156–173, 2000.
[50] M. Halkidi, Y. Batistakis, and M. Vazirgiannis, “On clustering validation techniques,” Intelligent Information Systems, vol. 17, pp. 107–145, 2001.
[51] F. Azuaje, “A cluster validity framework for genome expression data. bioinformatics,” Bioinformatics, vol. 18, pp. 319–320, 2002.
[52] A. Ben-Hur, A. Elisseeff, and I. Guyon, “A stability based method for discovering struc-ture in clustered data,” in Pacific Symposium on Biocomputing, vol. 7, 2002, pp. 6–17. [53] S. Datta and S. Datta, “Comparisons and validation of clustering techniques for
mi-croarray gene expression data,” Bioinformatics, vol. 4, pp. 459–466, 2003.
[54] C. Giurcaneanu, I. Tabus, I. Shmulevich, and W. Zhang, “Stability-based cluster analy-sis applied to microarray data,” in Proceedings of the Seventh International Symposium on Signal Processing and its Applications, 2003, pp. 57–60.
[55] M. Smolkin and D. Ghosh, “Cluster stability scores for microarray data in cancer stud-ies,” BMC Bioinformatics, vol. 4, no. 36, 2003.
[56] D. Elihu, P. Nechama, and L. Menachem, “Mercury exposure and effects at a ther-mometer factory,” Scandinavian Journal of Work Environmental Health, vol. 8, no. 1, pp. 161–166, 2004.
[57] P. Rousseeuw, “Silhouettes: a graphical aid to the interpretation and validation of cluster analysis,” Computational and Applied Mathematics, vol. 20, pp. 53–65, 1987.
[58] J. Liu, J. Yang, and W. Wang, “Gene ontology friendly biclustering of expression pro-files,” in Computational Systems Bioinformatics Conference, CSB 2004 Proceedings, 2004, pp. 436–447.