HAL Id: inserm-00149805
https://www.hal.inserm.fr/inserm-00149805
Submitted on 28 May 2007
HAL is a multi-disciplinary open access archive for the deposit and dissemination of sci-entific research documents, whether they are pub-lished or not. The documents may come from teaching and research institutions in France or abroad, or from public or private research centers.
L’archive ouverte pluridisciplinaire HAL, est destinée au dépôt et à la diffusion de documents scientifiques de niveau recherche, publiés ou non, émanant des établissements d’enseignement et de recherche français ou étrangers, des laboratoires publics ou privés.
Medical informatics and bioinformatics: a bibliometric
study.
Jean-Yves Bansard, Dietrich Rebholz-Schuhman, Graham Cameron, Dominic
Clark, Erik van Mulligen, Francesco Beltrame, Eva del Hoyo Barbolla,
Fernando Martin-Sanchez, Luciano Milanesi, Ioannis Tollis, et al.
To cite this version:
Jean-Yves Bansard, Dietrich Rebholz-Schuhman, Graham Cameron, Dominic Clark, Erik van Mul-ligen, et al.. Medical informatics and bioinformatics: a bibliometric study.. IEEE Transactions on Information Technology in Biomedicine, Institute of Electrical and Electronics Engineers, 2007, 11 (3), pp.237-43. �10.1109/TITB.2007.894795�. �inserm-00149805�
MEDICAL INFORMATICS AND BIOINFORMATICS:
A BIBLIOMETRIC STUDY
Authors: Bansard J.Y (1,2), Rebholz-Schuhmann D (3), Cameron G (3), Clark D (3), van Mulligen
E (4), Beltrame F (5), Del Hoyo Barbolla E (6), Martin-Sanchez F (7), Milanesi L (8), Tollis I (9), van der Lei J (4), Coatrieux J.L (1,2)
1 INSERM, U 642, Rennes, F-35000, France
2 Université de Rennes 1, LTSI, Rennes, F-35000, France 3 EMBL-European Bioinformatics Institute,
EMBL-European Bioinformatics Institute, Wellcome Trust Genome Campus, Hinxton, Cambridge, CB10 1SD, U.K.
4 Erasmus University Medical Center, Dept of Medical Informatics,
Erasmus Medical Center,
P.O.Box 1738, 3000 DR Rotterdam, The Netherlands.
5 Dist University of Genova, Department of Bioengineering, DIST, University of Genova, Viale F.Causa 13, 16145 Genova, ITALY.
6 Universite Polytechnica de Madrid Life Supporting Technologies,
ETSI Telecomunicación, Ciudad. Universitaria s/n., Madrid 28040
SPAIN
7 Institute of Health "Carlos III", Medical Bioinformatics Department Institute of Health "Carlos III" Ctra. Majadahonda a Pozuelo, Km. 2. 28220 Majadahonda,
Madrid, SPAIN
8 CNR-ITB Institute of Biomedical Technologies, CNR-ITB Institute of Biomedical Technologies Via, Fratelli Cervi 93,
20090 Segrate (Milano) ITALY
9 Foundation for Research and Technology
Foundation for Research and Technology Hellas, Vassilika Vouton, P.O. Box 1385 GR 711 10, Heraklion, Crete, Greece
This material is presented to ensure timely dissemination of scholarly and technical work. Copyright and all rights therein are retained by authors or by other copyright holders.
All persons copying this information are expected to adhere to the terms and constraints invoked by each author's copyright. In most cases, these works may not be reposted without the explicit permission of the copyright holder.
HAL author manuscript inserm-00149805, version 1
HAL author manuscript
Abstract
This paper reports on an analysis of the bioinformatics and medical informatics literature with the objective to identify upcoming trends that are shared among both research fields to derive benefits from potential collaborative initiatives for their future. Our results present the main characteristics of the two fields and show that these domains are still relatively separated.
Keywords: medicine, informatics, biology, bioinformatics, correspondence analysis, bibliometrics.
Introduction
Bibliometric analyses have attracted much attention within the past years for several reasons: (i) the availability of full databases of scientific literature with worldwide electronic access (Medline, ISI, Inspec, etc.); (ii) the availability of efficient tools to perform automatic textual analysis; and (iii) the major interest they raise at institutions aiming to analyze recent research trends, position national effort outcomes in relation to others, and evaluate national policies and laboratories, etc.
This study reports part of the work performed during the SYMBIOmatics1 project. Its specific
objective was to identify the present links and potential synergies between the bioinformatics (BI) and medical informatics (MI) research areas. These two research fields have matured over the last decades almost independently: the former is mainly concerned with biological research (genomics, proteomics, etc.) while the latter is focused on patient-based clinical research and information technology for medical care (hospital information systems, home healthcare, telemedicine, etc). Both domains, however, have commonalities: they benefit from advances in other disciplines (signal and image analysis, data mining, large computing resources, new sensing capabilities, ..) and they share the same goal, a better patient care. Therefore it is interesting to look at their current frontiers and to see where and how BI and MI are coupled together. Some elements of cross-fertilization have been reported in [1], [2] but it is only recently that a full joint analysis of the scientific literature has been performed [3].
Recently, a number of studies has been published that used Medline abstracts to extract information on gene expression patterns, protein-protein interactions, mutations, etc. [4] - [7]. They rely on a
priori defined terms (words), syntactical descriptions [8] or microchains of collective reasoning [9].
These approaches are not well suited for the exploration of the joint BI-MI literature corpus as it may be difficult beforehand to define all terms describing both domains without introducing uncontrolled bias. This is the motivation of the current approach that makes use of the most significant words and groups of words emerging from the contents of the documents under analysis. The paper is organized as follows. We first define the materials that have been analyzed and we sketch the method that has been applied. The 'Result' section describes the findings and, in the 'Discussion' section, these results are compared to those obtained by another approach, the bigram technique, also developed during the SYMBIOmatics project.
Materials and method
The BI and MI corpus have been extracted from EBI’s2 inhouse installation of Medline (release date
November 25, 2005) of papers that were published during the period the period 2000 to 2005. The following journals were selected.
1 A Specific Support Action supported by the European Commission. This project included international expert survey in addition to statistical analysis of the literature.
2 European Bioinformatics Institute
1. BI corpus: Bioinformatics, Biosystems, BMC Bioinformatics, Brief Bioinform, Comput. Methods Programs Biomed., IEEE Trans Inform. Technol. Biomed., J. Bioinform. Comput. Biol., J. Biomed. Inform., J. Comput. Aided Mol. Des., J. Comput. Biol., Pac Symp. Bio-comput.
2. MI corpus: AMIA Annu. Symp. Proc., Artif. Intell. Med., BMC Med. Inform. Decis. Mak., Int. J. Med. Inform., J. Am. Med. Inform. Assoc., Medinfo, Methods Inf. Med., Proc. AMIA Symp.
Both corpora together consist of 9334 documents, each with title, authors, journal and abstracts. The basic concepts behind the bibliometric analysis employed rely on correspondence factorial analysis [10] - [12]. They are derived from the observation that documents that use the same words with similar association frequencies have closely related contents. Therefore, the first step consists of estimating the frequencies of word occurrences within the whole set of documents. Then, the frequencies of word co-occurrences per document are estimated and analyzed. This analysis allows the construction of a space of words and a space of documents such that the words will be closer as they will be more often associated (a notion of “neighborhood” based on co-occurrence) and that the documents will be less distant as far as they contain the same word co-occurrences (a “neighborhood” of documents due to characteristic co-occurring “constellations” of close words). We extract then, without any prior considerations:
1. Groups of words, named “metakeys”, describing the contents of close document sets (a “metakey” is only valid for the corpus under study)
2. Sets of close documents, the proximity being based on their contents.
It can be seen that, in this method, the definition of “metakeys” results from the statistical analysis of the whole set of documents. Moreover, these “metakeys” are associated with the contents of the documents: they emerge a posteriori (the statistical analysis defines a classification, through the contents of the document database). The relevance of the document grouping can be later submitted to experts who can interpret the contents of documents and the words that compose the “metakeys”. This expertise allows us to name and provide meaning to the sets of associated words, the “metakeys”.
The interests of the correspondence analysis can be found in its capability of addressing textual data, its underlying barycentre interpretation, the duality of spaces (which leads to an interpretation, within the same space, of rows and columns of the table under study or, better said, respective words and documents). The graphical representation that is provided is also an important feature in order to look into a large set of data: the projections onto the factorial planes and easily visualize the similarity/proximity of words and documents. The principle of distributional equivalence and the adjunction of supplementary elements (year of publication, for instance) are some of the other advantages that can be highlighted (any new document belonging to the same corpus can be projected onto the computed space). This approach has been applied to very different bibliometric studies, in particular to Cancer and Genomics research [13], [14] and to the IEEE literature [15]. The bigram analysis is described in detail in [3]. In short terms all noun phrases were selected from the documents and all bigrams, i.e. any combination of two consecutive words, in the noun phrase was extracted. For every bigram, the term frequency (Tf), the document frequency (Df) and the TfIdf value (Tf / Df) were calculated and used for ranking. All bigrams were selected that had a high rank (amongst top 10) in at least one document, and were present in at least 20 documents. Finally, all bigrams were again ranked according to their TfIdf value.
The overall set of documents was filtered to eliminate unmeaning terms like verbs, articles and prepositions. Then, the most frequent and most occurring words (911) were selected. Documents containing at least 20 from these 911 words were kept for analysis. This allowed to form a matrix with documents in rows (7293) and words in columns (911). Its decomposition into eigenvalues
(ranked by decreasing values) and eigenvectors lead to the formation of factorial planes where both words and documents can be projected.
Results
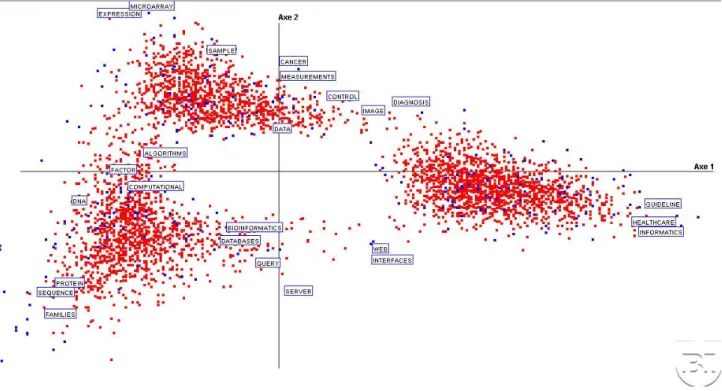
Figure 1 depicts three main, well discriminated, clusters in the first factorial plane F1-F2, related to the two largest eigenvalues where documents and words are displayed. They will be detailed later but let us primarily examine some specific areas. On the extreme right side and close to the first factorial axis, terms referring to MI can be found ('healthcare', 'guideline', 'informatics'). On the upper part of and close to the second factorial axis, words like 'microarray', 'sample', 'expression' are projected: they all concern observation techniques in biology. The transition between these first two clusters is represented by 'image', 'measurement', 'control', in other words, observational techniques make the bridge between them. 'Cancer' is the only pathology that appears significant in this study of MI and BI.
On the first factorial axis, on the left side, we find 'algorithm', 'novel', 'computational', 'factor', which represent computational methods. The third quadrant, along the diagonal, points out 'protein', 'sequence', 'proteins', 'families', as main objects. In the fourth quadrant, the few words isolated along the diagonal, are 'interface', 'web'.
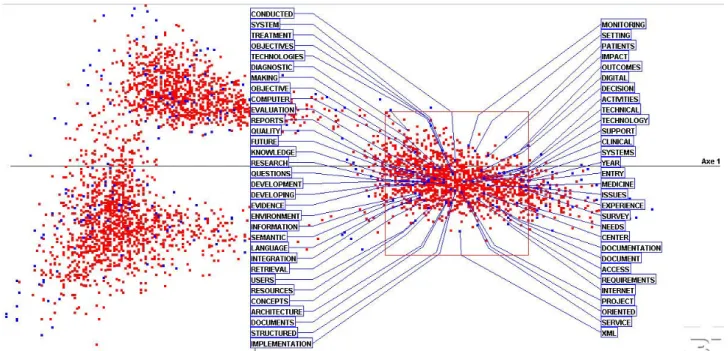
Figure 2 provides more details on the first cluster. These confirm and precise the MI label with, for the most salient terms, 'patient', 'decision', 'clinical', 'medicine' on one hand, and 'service', 'internet', 'access', 'record', 'knowledge' and 'semantic', 'retrieval', 'language', 'evidence', on the other.
Figure 3 shows details of the second cluster The dominant terms contributing to F2 are 'noise', 'microarray', 'expression', 'gene', 'cell', 'sample', 'experiments'. Downwards along this factorial axis, statistical methods appear like 'cluster', 'classification', 'Bayesian', 'neural', 'network'. A possible interpretation is that this cluster depicts both observational tools and processing methods. This is confirmed by the transition with the third cluster defined by 'algorithm', 'DNA', 'prediction'.
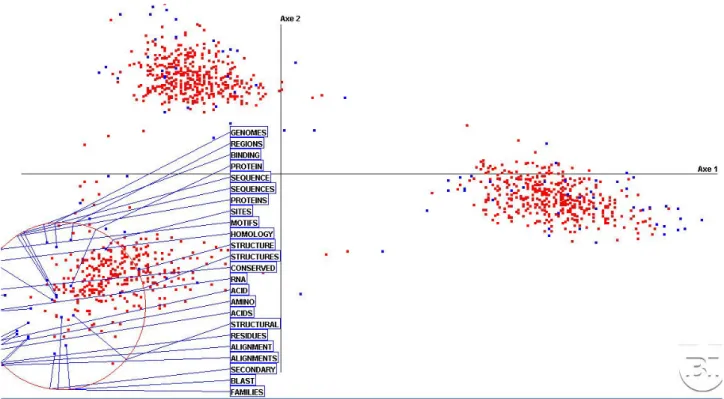
Figure 4 gives some insights into the third cluster. The terms 'genomic/genome', 'site', 'sequence', 'alignment', 'protein', 'structure', 'pairs', 'motif', 'RNA', 'homology' are some prototypical features of biological research. Terms in Figure 1 like 'database', 'bioinformatics', 'query', 'server', located in this area are slightly shifted toward the first cluster, the MI. They appear coherent with the words on the next diagonal such as 'web' and 'interface' and 'domain', 'program', 'searching' (theses are not displayed to keep the picture readable) that are shared by BI and MI.
To continue the exploration of the factorial space, Figure 5 provides the main features in plane F3-F4. It can be seen that the right side of F3 is influenced by 'annotation', 'ontology', 'tool', 'visualization', 'database' and many others. They are shared by MI and BI and may be rooted to the analogy between language and genome on one hand and, on the other hand, to the use of similar analysis tools. On the opposite side (left of F3), we find 'binding', 'RNA', 'alignment' and, with a less degree of contribution, 'structure', 'prediction'. The separation brought by the F4 axis is already more difficult to interpret: if the upper part is clearly defined by 'image', 'modeling', etc., the lower side goes from 'transcription' to 'health' up to 'education'.
Another way to get additional insights into the factorial representation consists of looking for groups of words, or metakeys, mainly contributing to the successive factorial axes. In that case, we determine for each axis, the subsets of words that are highly correlated to it. Without exploring all the space, let us mention some findings. 'Interaction', 'cellular', 'regulation' appear highly correlated with F5 for instance. Terms like 'transcription', 'binding', 'DNA', 'image', 'site' determine F9. 'Pathway', 'metabolic', 'organism' appear with F11 and computational methods with 'learning', 'classification', 'regression', 'feature', 'cluster' are only strongly contributing to F13 and F15. When
going farther in the exploration of the factorial space, we find the group 'acid', 'amino', 'map', 'pattern' on F21. Of course, when going farther, the eigenvalues are smaller and have low contributions to the overall inertia.
A search of constellations of words that are associated to a certain word was the next step. As an example, 'microarray', which contributes to many factorial axes, is grouped with 'alignment', 'motif', 'RNA', 'protein', 'CDNA', 'cell', 'model', 'network', 'variability'. Doing the same search for 'machine', we find that 'support' and 'vector' are very close ('support vector machine' being a recent classification method) but also 'algorithm', 'decision', 'mining'. That is not surprising from the MI viewpoint. They are more loosely associated with 'motif', 'transcription' which would establish a link with BI. Conversely, 'mining' is of concern for both domains.
In the last step, we analyzed which journals are represented in the three different clusters to verify our findings according to the categorization of a journal into the BI or MI domain (Table 1). We found that BI journals are mainly located in the second and third clusters but they also delivered a significant number of papers in the first cluster. Three singularities can be observed with 'Computer Methods and Programs in Biomedicine', IEEE Transactions on Information in Biomedicine' and 'Journal of Biomedical Informatics': they have a relatively high presence in the first cluster, which is dominated by MI. Conversely, the MI journals are currently far away from BI. A possible interpretation is that the trend toward medicine for BI is stronger than the evolution of MI towards BI. MI still concentrates a large part of its research to health care information systems.
The bigram analysis complements our approach by focusing on pairs of words (collocations). Although several studies on different sets of documents have been performed during the SYMBIOmatics projects using this method, we will limit our comparison to the conclusions reported in [3]. Tables 2 and 3 show the most frequent bigrams. They have been extracted and ranked by frequency of occurrence. They point out that BI and MI bigrams are closely associated with several factorial planes. The pair 'open', 'source' (Table 3), for instance, while not displayed in previous pictures, is highly correlated to the F3 axis. There are, however, words with very low frequencies (and ranked far in bigrams) that have not been depicted like 'nucleotide', 'CDNA' for BI and 'medical error' for MI. Overall, the two studies are highly coherent.
Discussion
The rich literature of MI and BI demonstrates that the two areas are very active. The former has brought new concepts, advanced information techniques, and sophisticated decision tools into the healthcare scene. The latter has introduced in-depth insights into biological entities, from genes to proteins, their structural features and functional interactions. Both undergo fast changes thanks to new sensing techniques and innovative methods in information processing.
The bibliometric study, however, shows that these are independent developments with limited overlaps. The first factorial axis (Figure 1) enhances this separation between BI (left of F2) and MI (right of F2). The right side of F1 points out 'Healthcare', 'clinician', 'hospital': they remain very far from the rest. When going progressively to the left, we find 'technical', 'records', 'decision' and then 'knowledge', 'evidence', 'semantic', 'language', all things that denote a more recent trend in MI. The two clusters to the left of F1 when projected on F1 cannot be discriminated: they gather both IT aspects (including techniques like 'microarray', 'noise', 'sample' and also statistical methods with 'classification', 'feature', 'parameters, 'dataset', all being basic components in information processing) and biological entities and concerns ('gene', 'protein', 'sequence', 'prediction', 'similarity'). If the three clusters are projected onto the F2 axis, a continuum appears where MI is in the middle, indicating that it overlaps with information processing, with technologies (positive segment of F2) and 'biology' (negative side of F2) on both sides. In other words, MI and BI share a lot in information technology (IT) without working on the same objects and in the same environments.
Factorial correspondence analysis renders an overall view of BI and MI through the whole set of documents. It shows the constellations of words contributing to the several factorial axes. Additional variables can be examined at the same time like the years of publications, the countries of the authors, etc. However, one critical assumption is that only the most frequent words within the set of documents are taken into account: these frequencies of occurrences and co-occurrences must be high enough to type and define robust relations with documents.
While the two research fields share a number of observational and methodological tools, they still remain focused on different topics and objects. 'Internet', 'access', 'ontology', 'XML' are terms typical to the medical/clinical dimension of MI while BI is characterized by 'alignment', 'motif', 'sequence' with 'protein', 'amino-acid', RNA, etc. It has also been shown that 'imaging', 'algorithm', 'web' and others make the transitions between these three subsets. A previous analysis conducted during the same study, the bigram technique, arrived at similar conclusions. Beyond their own merits, they complement each other: the factorial analysis renders easily interpretable global graphical representations and the bigram extracts more detailed information.
Conclusion
The analysis of MI and BI literature shows that three different subsets can be identified, respectively the MI domain, the sensing and information processing techniques, and the BI field. The study points out the following: (i) genetics and proteomics are still not embedded in the medical field, (ii) the aspects of MI focused on hospital information and patient management are far from BI topics, (iii) BI and MI overlap in using the same computer science and mathematical methods and techniques. This overlap should lead to bridging between biology and medicine.
References
[1] Martin-Sanchez F, Iakovidis I, Norager S, Maojo V, de Groen P, Van der Lei J, Jones T,
Abraham-Fuchs K, Apweiler R, Babic A, Baud R, Breton V, Cinquin P, Doupi P, Dugas M, Eils R, Engelbrecht R, Ghazal P, Jehenson P, Kulikowski C, Lampe K, De Moor G, Orphanoudakis S, Rossing N, Sarachan B, Sousa A, Spekowius G, Thireos G, Zahlmann G, Zvarova J, Hermosilla I, Vicente FJ, Synergy between medical informatics and bioinformatics: facilitating genomic
medicine for future health care. J Biomed Inform, 37(1):30-42, 2004.
[2] Friend HF: How DNA microarrays and expression profiling will affect clinical practice, Br Med
J , 319:1–2, 1999.
[3] Rebholz-Schuhmann D, Cameron G, Clark D, van Mulligen E, Beltrame F, Coatrieux J.L, Del Hoyo Barbolla E, Martin-Sanchez F, Milanesis L, Tollis I, van der Lei J, SYMBiomatics :
Synergies in medical informatics and bioinformatics-exploring current scientific literature for emerging topics. BMC Bioinformatics, vol. 8, suppl 1, p. S18, 2007.
[4] Teufel S: Meta-discourse markers and problem-structuring in scientific articles, Workshop on Discourse Structure and Discourse Markers, ACL, Montreal, QC, Canada, 1998.
[5] Blaschke C, Andrade MA, Ouzounis C, Valencia A: Automatic extraction of biological information from scientific text: Protein-protein interactions. Proc Int Conf ISMB, 7:60–7,1999. [6] Rebholz-Schuhmann D, Marcel S, Albert S, Tolle R, Casari G, Kirsch H: Automatic extraction of mutations from Medline and cross-validation with OMIM. Nucleid Acids Research, 32 (1), 135– 142, 2004.
[7] Rzhetsky A, Iossifov I, Koike T, Krauthammer M, Kra P, et al: GeneWays: A system for extracting, analyzing, visualizing, and integrating molecular pathway data. J Biomed Inf, 37:43–53, 2004.
[8] Lisacek F, Chichester C, Kaplan A, Sandor A: Discovering Paradigm Shift Patterns in Biomedical Abstracts: Application to Neurodegenerative Diseases. SMBM, European Bioinformatics Institute, Cambridge, UK, 2005.
[9] Rzhetsky A, Iossifov I, Loh JM, White KP: Microparadigms: chains of collective reasoning in publications about molecular interactions. Proc Natl Acad Sci U.S.A., 103(13):4940-5, 2006. [10] Benzecri JP, L'analyse de données. Tome 2: L'Analyse des Correspondances, 2nd.edition, Paris, France: Dunod, 1976.
[11] Greenacre M, Correspondence Analysis in Practice, London, UK: Academic Press, 1993. [12] Lebart L, Salem A, Statistique Textuelle, Paris, France: Dunod, 1994.
[13] Filliatreau G, Kerbaol M, Bansard JY, Aubertin C , Analyse bibliométrique de la recherche sur le cancer au cours de la décennie 90 , Observatoire des Sciences et Techniques, collection : les
études OST- Domaines de R&D,Paris, France, 2005.
[14] Filliatreau G, Ramanana-Rahary S, Blanchard V, Teixera N, Kerbaol M, Bansard JY, Bibliometric Analysis of Research in Genomics during the 1990's, Observatoire des Sciences et Techniques, Collection : les études thématiques, Paris, France, 2003.
[15] Kerbaol M, Bansard JY, Coatrieux JL, An analysis of IEEE publications, IEEE Engineering in
Medicine and Biology Magazine; 25 (2) : 6-9, 2006.
Figure 1. Global view to the first factorial plane (F1 and F2 being identified by 'axis 1' and 'axis 2' respectively and in all other figures) with the three clusters and the words characterizing them.
Figure 2. Details on the first cluster with the most frequent words characterizing it. This cluster is clearly dominated by MI.
Figure 3. Details of the second cluster with the most frequent words. Sensing techniques and mathematical tools are its main features.
Figure 4. Details on the third cluster with the most frequent words. They define a highly coherent view of current BI research.
Figure 5. Factorial plane F3-F4 with the most frequent words.
Table 1. Number of papers in the 3 clusters according to the journal where they appear.
Clusters (first factorial plane) I II III
Bioinformatics 5 137 652
Biosystems 2 5 18
BMC Bioinformatics 1 23 131 Brief Bioinform. 5 2 22 Comput Methods Programs Biomed. 81 2 1 IEEE Trans Inf Technol Biomed. 94 2 1 J Bioinform Comput Biol. 0 7 28 J Biomed Inform. 84 1 0 J Comput Aided Mol Des. 0 1 38 J Comput Biol. 0 16 71 Pac Symp Biocomput. 6 15 50
AMIA Annu Symp Proc. 331 1 1 Artif Intell Med. 71 1 0 BMC Med Inform Decis Mak. 43 0 0 Int J Med Inform. 377 0 0 J Am Med Inform Assoc. 276 0 0 Medinfo. 419 1 1 Methods Inf Med. 222 0 1 Proc AMIA Symp. 345 2 0
(a) Cluster I represents the MI content, cluster II sensing techniques and mathematical tools, and cluster III represents the BI content. It can be clearly seen that the content of the BI journals are somewhat mixed appearing in all the three clusters, whereas almost all the content of MI journals is concentrated in the first cluster.
Cluster I Cluster II Cluster III
BI journal corpus 278 211 1012 MI journal corpus 2084 5 3
(b) Two corpus and the corresponding papers in the 3 clusters.
Bigrams Rank 2000-2005 Bigrams Rank 2000-2005
Gene expression 1 Microarray experiment 22
Amino acid 2 Microarray data 25
Protein sequence 3 Expression profile 26
Expression datum 4 Gene ontology 37
Sequence alignment 5 Support vector 38
Dna sequence 7 Vector machine 41
Protein structure 8 Protein interaction 62
Binding site 10 Whole genome 74
Microarray datum 12 Nucleotide polymorphism 80
Neural network 13 Cdna microarray 83
Secondary structure 14 Microarray technology 84 Data set 16 Microarray gene 85
Source code 18 Data mining 87
Markov model 21 Interaction network 88
Table 2 - Bigrams in the BI journals corpus [3]. Ranked according to their highest document frequency during 2000-2005.
Bigrams Rank 2000-2005 Bigrams Rank 2000-2005
Information system 1 Patient safety 75
Health care 2 Gene expression 87
Decision support 3 Medical error 92
Medical record 4 Digital assistant 94
Patient record 5 Personal digital 95
Medical informatics 6 Disease management Clinical information 7 Open source
Health information 8 Provider order
Patient care 9 Clinical documentation Support system 10 Clinical document Electronic medical 11 Support vector Information technology 12 Vector machine Clinical practice 13 Expression datum Medical information 14 Study objective
Knowledge base 15 Snomed ct
Hospital information 16
Table 3. Bigrams in the MI journals corpus [3]. With the same ranking rule as in table 2.

![Table 2 - Bigrams in the BI journals corpus [3]. Ranked according to their highest document frequency during 2000-2005.](https://thumb-eu.123doks.com/thumbv2/123doknet/14651366.551615/14.892.87.766.87.597/table-bigrams-journals-ranked-according-highest-document-frequency.webp)
![Table 3. Bigrams in the MI journals corpus [3]. With the same ranking rule as in table 2.](https://thumb-eu.123doks.com/thumbv2/123doknet/14651366.551615/15.892.86.815.87.668/table-bigrams-mi-journals-corpus-ranking-rule-table.webp)
