HAL Id: hal-02148988
https://hal.archives-ouvertes.fr/hal-02148988
Submitted on 6 Jun 2019
HAL is a multi-disciplinary open access
archive for the deposit and dissemination of
sci-entific research documents, whether they are
pub-lished or not. The documents may come from
teaching and research institutions in France or
abroad, or from public or private research centers.
L’archive ouverte pluridisciplinaire HAL, est
destinée au dépôt et à la diffusion de documents
scientifiques de niveau recherche, publiés ou non,
émanant des établissements d’enseignement et de
recherche français ou étrangers, des laboratoires
publics ou privés.
Christian France-Lanord, V. Spiess, A. Klaus, R.R. Adhikari, S.K. Adhikari,
J.-J. Bahk, A. Baxter, J.W. Cruz, S.K. Das, P. Dekens, et al.
To cite this version:
Christian France-Lanord, V. Spiess, A. Klaus, R.R. Adhikari, S.K. Adhikari, et al.. Site U1449.
Bengal Fan. Proceedings of the International Ocean Discovery Program, 354: College Station, TX
(International Ocean Discovery Program)., 2016, �10.14379/iodp.proc.354.103.2016�. �hal-02148988�
Proceedings of the International Ocean Discovery Program Volume 354 publications.iodp.org
doi:10.14379/iodp.proc.354.103.2016
Site U1449
1C. France-Lanord, V. Spiess, A. Klaus, R.R. Adhikari, S.K. Adhikari, J.-J. Bahk, A.T. Baxter, J.W. Cruz, S.K. Das, P. Dekens, W. Duleba, L.R. Fox, A. Galy, V. Galy, J. Ge, J.D. Gleason, B.R. Gyawali, P. Huyghe, G. Jia, H. Lantzsch, M.C. Manoj, Y. Martos Martin, L. Meynadier, Y.M.R. Najman, A. Nakajima, C. Ponton, B.T. Reilly, K.G. Rogers, J.F. Savian, T. Schwenk, P.A. Selkin, M.E. Weber, T. Williams, and K. Yoshida2
Keywords: International Ocean Discovery Program, IODP, Expedition 354, JOIDES Resolution, Site U1449, Bengal Fan
1France-Lanord, C., Spiess, V., Klaus, A., Adhikari, R.R., Adhikari, S.K., Bahk, J.-J., Baxter, A.T., Cruz, J.W., Das, S.K., Dekens, P., Duleba, W., Fox, L.R., Galy, A., Galy, V., Ge, J., Gleason, J.D., Gyawali, B.R., Huyghe, P., Jia, G., Lantzsch, H., Manoj, M.C., Martos Martin, Y., Meynadier, L., Najman, Y.M.R., Nakajima, A., Ponton, C., Reilly, B.T., Rogers, K.G., Savian, J.F., Schwenk, T., Selkin, P.A., Weber, M.E., Williams, T., and Yoshida, K., 2016. Site U1449. In France-Lanord, C., Spiess, V., Klaus, A., Schwenk, T., and the Expedition 354 Scientists, Bengal Fan.
Proceed-Contents
1 Site summary
2 Background and objectives
4 Operations
6 Lithostratigraphy
11 Biostratigraphy
12 Paleomagnetism
15 Geochemistry and microbiology
19 Physical properties
23 Downhole measurements
23 Stratigraphic synthesis
27 References
Site summary
Site U1449 (proposed Site MBF-6A) is part of our seven-site transect designed to document turbiditic transport processes and the architecture of deposition in the Middle Bengal Fan at 8°N since the Pleistocene. Sediments will also be used to trace sources of eroded material in the Himalaya and reconstruct erosion rates as a function of climate change. Site U1449 is located at 08°0.419′N, 088°6.599′E in a water depth of 3653 m. The main Hole U1449A penetrated to 213.5 m drilling depth below seafloor (DSF) and was cored by a combination of the advanced piston corer (APC), half-length APC (HLAPC), and extended core barrel (XCB) systems. Hole U1449B consists of a single APC core from the mudline taken for microbiological studies.
Principal results
Different structural elements of the sedimentary fan were cored, including a more than 40 m thick levee succession, interlevee sand sheets, and hemipelagic sequences. General lithologic boundaries correlate well with downcore variability in all physical properties and were attributed to major seismic facies types and reflectivity characteristics. In situ and average core seismic velocities are in close agreement, which confirms that the major lithologies were properly sampled and sections not recovered by XCB drilling likely contained unconsolidated sand.
Cored sediments allowed us to characterize the sedimentologi-cal, physisedimentologi-cal, and geochemical properties of the material delivered mostly through turbidity currents and likely originating from the Himalayan range. Integration of lithology, physical properties, seis-mic facies, and geochronological data shows that sedimentation varies over several orders of magnitude between centimeters per thousand years for hemipelagic units that represent a local absence
of turbiditic sedimentation and much higher rates (>>10 cm/ky) for interlevee units and levees that built up rapidly.
High accumulation rates of turbiditic deposition in the lower 120 m of Hole U1449A since ~2 Ma were followed by a low-accu-mulation hemipelagic episode around ~0.8–1.3 Ma. Intercalated le-vee and interlele-vee deposits then formed until ~300 ky ago, after which hemipelagic sedimentation dominated again.
Operations
Hole U1449A was drilled to total depth of 213.5 m DSF. The APC system penetrated 57.1 m of formation and recovered 52.37 m (92%). The HLAPC penetrated 71.9 m of formation and recovered 74.98 m (104%). The XCB system penetrated 83.5 m of formation and recovered only 2.03 m (2%). Because of low recovery with the XCB system and because most objectives were achieved, drilling was terminated before reaching the initially planned depth of 300 meters below seafloor (mbsf) to save time. Hole U1449B consists of a single APC core from the mudline taken for microbiological inves-tigations and recovered 7.91 m of sediments.
This first Expedition 354 drilling experience in the fan sedi-ments allowed us to refine the drilling strategy for subsequent drill sites. As expected, recovery of sands intercalated between muddy units was challenging, but the HLAPC system proved to be particu-larly efficient for sampling both turbiditic sequences and loose sand intervals.
Lithostratigraphy
The predominant lithology is siliciclastic and composed of nor-mally graded intervals of mica-rich quartz-dominant fine sand, silt, and clay of varying thicknesses (i.e., turbidites). The observed min-eralogical assemblage is characteristic of sediments found in Hima-layan rivers. Turbidite sequences are generally separated by hemipelagic intervals (mottled calcareous clays) and occasional
glassy volcanic ash layers. Lithologic differences between siliciclas-tic units and variations in grain size and bed thickness reflect cycles of proximal turbidity current channel activity, including activation, flow-stripping, avulsion, and abandonment. Bioturbated calcareous clays likely represent times of channel-levee inactivity at Site U1449 and hence reduced deposition of terrigenous material.
Biostratigraphy
Calcareous nannofossils and planktonic foraminifers provide biostratigraphic constraints at Site U1449. Overall, the abundance and preservation of these microfossils is dependent on the type of lithology recovered. Coarser sandy intervals contain few to barren calcareous nannofossils and barren to <0.1% foraminifers, but abun-dance and preservation improve considerably in the pelagic and hemipelagic intervals. These intervals are discontinuous at this site because of the regular influx of turbidites and levee sedimentation. Biostratigraphic controls are based on 53 nannofossil and 34 plank-tonic foraminifer samples, which provide a total of six biomarker horizons and a lower Pleistocene age at the bottom of Hole U1449A.
Paleomagnetism
We studied 38 of the 30 cores collected from Hole U1449A, avoiding deformed or sandy intervals. Most cores were unoriented, so polarity reversals were identified using declination data within each core, both from discrete samples and archive section halves. The upper 91 m in Hole U1449A reveals normal polarity corre-sponding to the Brunhes Chron (<0.781 Ma). A pelagic deposit be-tween 88 and 97 m core depth below seafloor (CSF-A) contains several magnetic polarity transitions, including the Brunhes/Matu-yama boundary and the boundaries of the Jaramillo and Cobb Mountain Subchrons. Interpretation of the magnetic polarity be-neath the hemipelagic unit is difficult, but at least two cores (20H and 22H) may have reverse magnetization. Correlation between multiple holes from our transect, particularly in pelagic and hemi-pelagic intervals, is expected to clarify the interpretation of the magnetostratigraphy of Hole U1449A.
Physical properties
Acquired data allow three lithologic groups to be distinguished. Sand-dominated lithologies reveal high acoustic velocity (~1700 m/s), high wet bulk density (~2.1 g/cm3), generally high magnetic
susceptibility (~50 × 10–5 to 200 × 10–5 SI), and intermediate levels
of natural gamma radiation (NGR) (~70 counts/s). Silty clay litholo-gies show intermediate values of acoustic velocity (~1550 m/s), wet bulk density (~2.0 g/cm3), and magnetic susceptibility (30 × 10–5 to
100 × 10–5 SI) and the highest NGR levels (~90 counts/s).
Hemipe-lagic lithologies are easily distinguished by their low acoustic veloc-ity (~1500 m/s), low wet bulk densveloc-ity (~1.6 g/cm3), very low
magnetic susceptibility (0–20 × 10–5 SI), low NGR (~25 counts/s),
and the lightest color. Detailed comparisons between lithology and physical properties on selected intervals confirm the predictive ca-pabilities of physical property data for high-resolution reconstruc-tion of deposireconstruc-tional processes. Also, the data show a particularly high variability in coarser grained intervals, which were probably disturbed by coring; thus, deviation from in situ properties cannot be excluded.
Geochemistry
Shipboard sampling allowed analysis of 39 interstitial water samples, including a detailed sampling of the upper 9 m in single-core Hole U1449B. Inorganic and organic geochemical analyses were acquired on 12 samples for major and trace elements and 37 samples for organic and inorganic carbon. Data from turbidite sedi-ments exhibit geochemical compositions similar to those observed for sediments from Himalayan rivers and from the upper fan levees and shelf. A total of 31 samples were taken for postexpedition mi-crobiological research.
Background and objectives
Site U1449 (see Figures F3, F4, and F8 in the Expedition 354 summary chapter [France-Lanord et al., 2016d]) is the first of a seven-site transect drilled during Expedition 354 to study Pleisto-cene fan architecture and the evolution of the Middle Bengal Fan at 8°N. Seismic data along the transect reveal that the upper section of the fan is characterized by deposition related to channel-levee sys-tems (Schwenk and Spiess, 2009), whereas below that section, fewer and smaller scale channel systems are present. The onset of this per-vasive channel-levee transport and deposition likely occurred during the latest Miocene. Since then, the fan appears to have been built by an accumulation of lenses corresponding to distinct chan-nel-levee episodes intercalated with more slowly accumulating in-tervals of fine-grained sediment. Thus, accumulation at any point is likely highly variable in rate and composition, and changes are very irregular in space and time.
The objectives for this site were to provide characteristics of li-thologies building the structural and depositional elements of the fan and to estimate accumulation rates for different sedimentary de-position processes. Combined with the other six transect sites, this site should document depocenter migration and overall accumula-tion rates since the Pliocene.
Turbiditic sediments throughout the Bengal Fan carry detrital particles dominantly supplied by the Ganges and Brahmaputra Riv-ers (France-Lanord et al., 1993). Therefore, sediment collected at Site U1449 will be used to document Pleistocene erosion rates and erosion processes, as well as links between erosion and climate. This site was selected to initiate the expedition and provide the initial ex-perience of drilling/coring conditions in this type of environment so that we could refine the overall drilling strategy for the rest of the expedition.
Site U1449 is located in a relatively flat environment with a smooth morphology. Topographic expressions of channels are ab-sent in the vicinity (Figure F1), but an abandoned channel is present ~35 km west. Minor incisions <10 m deep are observed in the seis-mic data throughout the area but are not resolved by multibeam bathymetry.
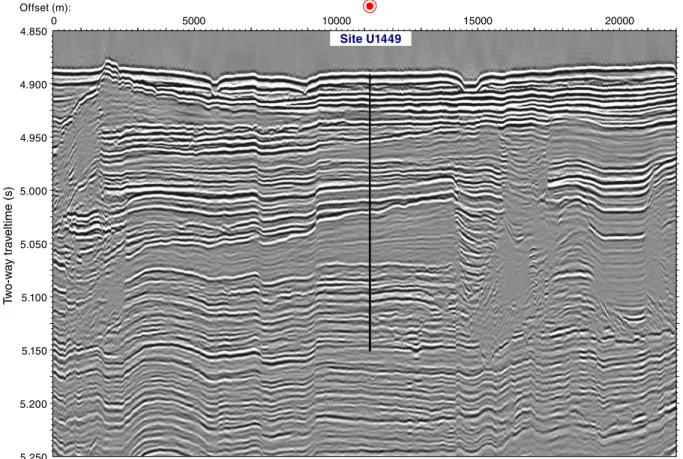
Figure F2 shows a portion of the transect seismic profile in the vicinity of Site U1449. Two major buried channel systems are pres-ent within the upper 300 ms two-way traveltime (TWT); they formed levees and contributed to the sedimentary succession drilled at Site U1449. Coarser grained interlevee units, onlapping onto the levees, are intercalated. Channel switching and associated depocenter migration, as well as the lifetime of such units, were in-vestigated by coring at this site.
Figure F1. Bathymetric and track chart, Site U1449. Projection is UTM Zone 45N. Multibeam bathymetry was acquired during R/V Sonne Cruises SO125 and SO188. Blue line = seismic Line SO125-GeoB97-027 with common depth point annotation. Contour interval is 20 m. A portion of the seismic profile is shown in Figure F2 (red line).
3500 3540 3580 3620 3660 3700 3740 3780 3820 N 1 20 0 0 1 30 0 0 1 40 0 0 1 50 0 0 1 60 0 0 1 70 0 0 1 80 0 0 1 9 0 0 0 0 3 07 87°45'E 88°0' 88°15' 88°30' 580000 590000 600000 610000 620000 630000 640000 650000 660000 X/Y: Meters 855000 865000 875000 885000 895000 905000
Site U1450 Site U1449
7°45' 8°15' N 8°0' W ater depth (m) (m) 0 5000 10000 15000 20000 25000
Figure F2. Seismic Line SO125-GeoB97-027 across Site U1449. Total penetration depth is 213 m DSF, assuming an average velocity of 1640 m/s.
0 4.850 4.900 4.950 5.000 5.050 5.100 5.150 5.200 5.250 Site U1449 Offset (m): Tw o-w ay tr av eltime (s) 5000 10000 15000 20000
Operations
Singapore port call
The R/V JOIDES Resolution was scheduled to arrive at Loyang offshore terminal in Singapore in the early morning of 29 January 2015 but had to anchor outside the port. The ship occupying our intended berth had a mechanical problem, and the arrival had to be shifted to the next day (30 January). In the late afternoon, water taxis were used to disembark Expedition 353 (Indian Monsoon) sci-entists and JOIDES Resolution Science Operator (JRSO) staff. The Expedition 354 Co-Chief Scientists and JRSO staff also boarded the ship by water taxi.
At 0600 h on 30 January, the pilot boarded the ship, and we started the short 9 nmi transit to Loyang port. The first line ashore at 0821 h marked the end of Expedition 353 and the start of Expedi-tion 354. This first day of port call activities included boarding the Bengal Fan scientists, completing ship operator crew change, off-loading Expedition 353 core and sample shipments, and shipping a variety of items to and from the ship. The Bengal Fan scientists set-tled in their rooms, were introduced to life on board, and then were given an initial safety orientation, laboratory tours, and an introduc-tion to informaintroduc-tion technology on the ship.
On 31 January, the scientists and JRSO technical staff were in-troduced to each other and the Co-Chief Scientists kicked off the expedition with a presentation of the expedition science objectives. In the afternoon, the Captain introduced key staff and gave the overall ship safety orientation. The International Ocean Discovery Program (IODP) Expedition Project Manager then gave the scien-tists an orientation. Port call activities continued with loading drill-ing mud, fueldrill-ing the ship, completdrill-ing a variety of shipments to and from the ship, and giving tours for a group of Texas A&M University (USA) alumni from Singapore and journalism students from Nanyang Technological University (Singapore). Port call continued with activities at the Loyang Offshore Supply Base jetty, including loading drilling equipment, expedition stores, and food. All public relation activities were concluded on 1 February. On 2 February, we conducted our first safety drills (fire and boat; anti-piracy security), and then all scientists and staff were given the afternoon off because our departure from Singapore was scheduled for the next day. In the afternoon, the final port call activities included loading life rafts and the remainder of fresh food and dry goods, securing the ship for heading out to sea, and preparing for the installation of a new core line.
Transit to Site U1449
At 0800 h on 3 February 2015, we were cleared by immigration for departure. The pilot arrived on board at 1020 h, and the last line was released at 1048 h. Our departure was assisted by two harbor tugs, and we proceeded to the pilot station, where the pilot departed the vessel (1202 h). We then began our transit through the Malacca Strait, into the Bay of Bengal, and to Site U1449. During the transit, we retarded the ship’s clock 2 h to UTC + 6 h. All times from this point until the end of Expedition 354 coring operations are given in this ship local time (UTC + 6 h). During the transit, the Co-Chief Scientists, key IODP staff, and the ship’s crew met to review the cor-ing and loggcor-ing plan for the expedition.
Site U1449
The original plan for Site U1449 was to core a single hole with the APC and XCB systems to 300 mbsf. Instead, two holes were cored. Hole U1449A was cored with the APC, HLAPC, and XCB
systems to 213.5 m DSF. The nature of the formation (interbedded sands, silts, and muds) created coring challenges that reduced pene-tration rate and recovery. Hole U1449B consisted of a single mud-line core for high-resolution microbiology and geochemistry.
Hole U1449A
After completing the transit from Singapore (1105 nmi; 3.9 days; 11.8 nmi/h), we arrived at Site U1449 at 0623 h on 7 February 2015. We assembled a bit and bottom-hole assembly (BHA), verified the correct space-out of the core barrel, and lowered it to the seafloor. The BHA included a nonmagnetic drill collar, and we used nonmag-netic core barrels throughout coring at Site U1449. We placed the bit at 3660 m drilling depth below rig floor (DRF) and prepared to spud Hole U1449A. After a failed first attempt APC core (the shear pins did not break), Hole U1449A was spudded at 2125 h on 7 Feb-ruary. Core 1H recovered 6.27 m and established the seafloor at 3652.7 meters below sea level (3663.3 m DRF). We used the APC, HLAPC, and XCB systems to penetrate and recover core in Hole U1449A. All cores, penetration depths, core recovery, and time re-covered on deck are presented in Table T1.
Core orientation started with Core 2H, but after it only pene-trated 3.72 m the orientation tool was removed from the system. Af-ter Core 2H, we drilled 1 m without coring through a hard layer (9.9–10.9 m DSF) and then XCB cored to 17 m without any recov-ery. We then used both piston coring systems and penetrated 22.5 m (17.0–39.5 m DSF; Cores 5H, 6F, 7H, and 8H) and recovered 18.3 m of core (82%). Orientation was attempted on Cores 8H and 9H with poor results; Core 8H was also the only time we deployed the advanced piston corer temperature tool (APCT-3) to obtain a for-mation temperature measurement. Core 9H did not penetrate the formation, so we switched to XCB coring. Cores 10X–12X extended from 39.5 to 68.4 m DSF but recovered only 0.86 m (3%). We switched back to the HLAPC system, and Cores 13F–17F pene-trated 19.6 m of formation (68.4–88.0 m DSF) and recovered 20.03 m (102%). Because we wanted to core deeply at this site, the forma-tion appeared soft enough, and the HLAPC system takes longer, we switched back to the APC system. Cores 18H–21H extended from 88.0 to 113.4 m DSF and recovered 25.02 m of core (99%); however, all but the first were only partial strokes (7.6, 4.9, and 3.4 m) and were advanced by recovery.
We switched back to the HLAPC system, and Cores 22F–31F penetrated 43.1 m (113.4–156.5 m DSF) and recovered 45.33 m; the last two were only partial strokes. As the formation still appeared to be too firm for full APC coring and achieving our primary objective of obtaining deeper samples would take much longer with the HLAPC system, we deployed the XCB coring system. Cores 32X– 36X penetrated 48.5 m (156.5–205.0 m DSF) but only recovered 1.17 m of sediment (2%). We then switched back to APC coring, first with HLAPC Core 37F, which penetrated from 205.0 to 209.7 m DSF and recovered 4.79 m (102%). The final core of Hole U1449A was another attempt at APC Core 38H that only partially stroked out from 209.7 to 213.5 m DSF and recovered 3.87 m of core.
Because we (1) had achieved a substantial part of this site’s ob-jectives, (2) had exceeded the operational time allocated for this site, and (3) had many high-priority expedition objectives remaining, we decided to not to spend any more time attempting to sample to the full 300 mbsf originally planned.
The APC system penetrated a total of 57.1 m of formation and recovered 52.37 m (91%, but includes advance by recovery and one core that did not penetrate the formation) (Table T2). The HLAPC system penetrated 71.9 m of formation and recovered 74.98 m
(104%). The XCB system penetrated a total of 83.5 m of formation and recovered only 2.03 m (2%). Ten barrels of sepiolite mud was circulated during or shortly after cutting Cores 10X and 33X.
Hole U1449B
After finishing coring in Hole U1449A, we offset the ship 20 m east and obtained a single mudline core in Hole U1449B for high-Table T1. Site U1449 core summary. * = cores when sepiolite mud was circulated. DRF = drilling depth below rig floor, mbsl = meters below sea level, DSF = drill-ing depth below seafloor. H = advanced piston corer, F = half-length APC, X = extended core barrel. Download table in .csv format.
Hole U1449A Hole U1449B
Latitude: 8°0.4194′N Latitude: 8°0.4206′N Longitude: 88°6.5994′E Longitude: 88°6.6091′E Time on hole (days): 2.9 (70.0 h) Time on hole (days): 0.5 (11 h)
Seafloor (drill pipe measurement below rig floor, m DRF): 3663.3 Seafloor (drill pipe measurement below rig floor, m DRF): 3662.6 Distance between rig floor and sea level (m): 10.6 Distance between rig floor and sea level (m): 10.7
Water depth (drill pipe measurement from sea level, mbsl): 3652.7 Water depth (drill pipe measurement from sea level, mbsl): 3651.9 Total penetration (drilling depth below seafloor, m DSF): 213.5 Total penetration (drilling depth below seafloor, m DSF): 7.9 Total depth (drill pipe measurement from rig floor, m DRF): 3652.7 Total depth (drill pipe measurement from rig floor, m DRF): 3651.9 Total length of cored section (m): 213.5 Total length of cored section (m): 7.9
Total core recovered (m): 129.38 Total core recovered (m): 7.91 Core recovery (%): 61 Core recovery (%): 100 Drilled interval (m): 1 Drilled interval (m): 0 Total number of cores: 37 Total number of cores: 1
Core Top of cored inter-val DSF (m) Bottom of cored inter-val DSF (m) Interval cored (m) Interval ad-vanced without cor-ing (m) Core recovered length (m) Curated length (m) Recovery (%) Date on deck (mm/dd/yy), time on deck UTC (h) Date on deck (mm/dd/yy), time on deck UTC + 6 (h) (ship local time) 354-U1449A-1H 0.0 6.2 6.2 6.27 6.27 101 02/07/15 1550 02/07/15 2150 2H 6.2 9.9 3.7 3.72 3.72 101 02/07/15 1725 02/07/15 2325 31 9.9 10.9 — 1.0 *****Drilled interval***** 02/07/15 1910 02/08/15 0110 4X 10.9 17.0 6.1 0 0 0 02/07/15 2045 02/08/15 0245 5H 17.0 20.0 3.0 2.99 2.99 100 02/07/15 2145 02/08/15 0345 6F 20.0 24.5 4.5 4.83 4.83 107 02/07/15 2312 02/08/15 0512 7H 24.5 34.0 9.5 5.01 5.01 53 02/08/15 0035 02/08/15 0635 8H 34.0 39.5 5.5 5.49 5.49 100 02/08/15 0205 02/08/15 0805 9H 39.5 39.5 0.0 0 0 0 02/08/15 0415 02/08/15 1015 10X* 39.5 49.0 9.5 0.73 0.77 8 02/08/15 0635 02/08/15 1235 11X 49.0 58.7 9.7 0.02 0.02 0 02/08/15 0805 02/08/15 1405 12X 58.7 68.4 9.7 0.11 0.11 1 02/08/15 0920 02/08/15 1520 13F 68.4 71.4 3.0 3.04 3.04 101 02/08/15 1125 02/08/15 1725 14F 71.4 74.4 3.0 2.97 2.97 99 02/08/15 1230 02/08/15 1830 15F 74.4 78.6 4.2 4.20 4.20 100 02/08/15 1345 02/08/15 1945 16F 78.6 83.3 4.7 4.75 4.75 101 02/08/15 1450 02/08/15 2050 17F 83.3 88.0 4.7 5.07 5.07 108 02/08/15 1600 02/08/15 2200 18H 88.0 97.5 9.5 9.03 9.03 95 02/08/15 1710 02/08/15 2310 19H 97.5 105.1 7.6 7.65 7.65 101 02/08/15 1820 02/09/15 0020 20H 105.1 110.0 4.9 4.92 4.92 100 02/08/15 2000 02/09/15 0200 21H 110.0 113.4 3.4 3.42 3.42 101 02/08/15 2130 02/09/15 0330 22F 113.4 118.1 4.7 5.06 5.06 108 02/08/15 2250 02/09/15 0450 23F 118.1 122.8 4.7 5.09 5.09 108 02/09/15 0015 02/09/15 0615 24F 122.8 127.5 4.7 5.14 5.14 109 02/09/15 0125 02/09/15 0725 25F 127.5 132.2 4.7 5.04 5.04 107 02/09/15 0230 02/09/15 0830 26F 132.2 136.9 4.7 5.02 5.02 107 02/09/15 0335 02/09/15 0935 27F 136.9 141.6 4.7 4.85 4.85 103 02/09/15 0440 02/09/15 1040 28F 141.6 146.3 4.7 4.89 4.89 104 02/09/15 0540 02/09/15 1140 29F 146.3 151.0 4.7 4.57 4.57 97 02/09/15 0645 02/09/15 1245 30F 151.0 152.5 1.5 1.55 1.55 103 02/09/15 0745 02/09/15 1345 31F 152.5 156.5 4.0 4.12 4.12 103 02/09/15 0850 02/09/15 1450 32X 156.5 166.2 9.7 0 0 0 02/09/15 1040 02/09/15 1640 33X* 166.2 175.9 9.7 0.27 0.27 3 02/09/15 1220 02/09/15 1820 34X 175.9 185.6 9.7 0.84 0.84 9 02/09/15 1340 02/09/15 1940 35X 185.6 195.3 9.7 0.02 0.00 0 02/09/15 1444 02/09/15 2044 36X 195.3 205.0 9.7 0.04 0.04 0 02/09/15 1610 02/09/15 2210 37F 205.0 209.7 4.7 4.79 4.79 102 02/09/15 1720 02/09/15 2320 38H 209.7 213.5 3.8 3.87 3.87 102 02/09/15 1850 02/10/15 0050 Totals: 212.5 1.0 129.38 129.40 61 354-U1449B-1H 0 7.9 7.9 7.91 7.91 100 02/10/15 0115 02/10/15 0715 Totals: 7.9 7.91 7.91 100
resolution microbiological and geochemical sampling. The bit was spaced out to 3661.0 m DRF in an attempt to recover approximately 7.0 m with the mudline core. Core 1H extended from the seafloor to 7.9 m DSF. We then retrieved the drill string, secured the rig floor, and started the short transit to Site U1450 at 1530 h on 10 February 2015.
Lithostratigraphy
At Site U1449, two holes were cored (U1449A and U1449B) to total depths of 213.5 m DSF (61% recovery) and 7.9 m DSF (100% recovery), respectively. The sediments recovered from these holes are divided into five lithostratigraphic units based on lithologic and paleontological characteristics obtained through macroscopic and smear slide analyses, as well as physical properties (Figure F3; Table
T3). The overall predominant lithology is siliciclastic and composed of normally graded intervals of fine sand, silt, and clay (i.e., turbi-dites). Turbidite sequences are generally separated by clay- and silt-sized pelagic and hemipelagic intervals and occasionally by volcanic ash layers. Lithostratigraphic Unit I (Hole U1449A = 0–6.27 m CSF-A; Hole U1449B = 0–6.57 m CSF-A) is dominated (95%) by biotur-bated nannofossil-rich calcareous clay containing foraminifers. Ad-ditionally, Unit I contains three volcanic ash layers composed of fine-grained glass particles: two in Hole U1449A (1.80–2.01 and 2.17–2.23 m CSF-A) and one in Hole U1449B (1.70–1.90 m CSF-A). Lithostratigraphic Unit II (Hole U1449A = 6.20–83.35 m CSF-A; Hole U1449B = 6.57–7.80 m CSF-A) is composed of successions of dominantly silty and fine-sandy intervals (silt/sand turbidites; 71%) and intervals predominantly composed of clay and silt of varying thicknesses (mud turbidites). Also present is nannofossil-rich cal-careous clay. Lithostratigraphic Unit III (Hole U1449A = 83.35– 97.00 m CSF-A) is characterized by nannofossil-rich calcareous clay (73%) topped with mottled clays. This unit contains only one thin (~40 cm) turbidite interval and a volcanic ash layer. Lithostrati-graphic Unit IV (97.00–147.8 m CSF-A) is dominated by repeated sequences of laminated silt and silty clay turbidites of varying thick-nesses (>99%). Turbidites here have sharp planar lower boundaries and fine upward from laminated silt to silty clay. The unit also con-tains a very thin calcareous clay and a thin volcanic ash layer. Litho-stratigraphic Unit V (Hole U1449A = 157.97–213.54 m CSF-A) has poor recovery. The dominant (56%) lithology of recovered sections is thick-bedded fine sands. The lowermost sand intervals contain thin layers of alternating clay and silt, as well as nannofossil-rich calcareous clays.
Turbidite sequences at Site U1449 are compositionally classified as mica rich (muscovite and biotite) and quartz dominant. Feldspars and heavy minerals (e.g., tourmaline, apatite, zircon, and opaque minerals) are common in silt- and sand-rich layers, whereas organic and pyritized aggregations (i.e., preserved burrows) appear occa-sionally in silty sections and within calcareous clays. Intervals of
cal-careous clay consistently include foraminifers, radiolarians, and diatoms.
Lithologic differences between siliciclastic units and variations in grain size and bed thickness most probably reflect cycles of prox-imal turbidity current channel activity, including activation, flow stripping, avulsion, and abandonment. These differences are consis-tent with the channel-levee stacking patterns observed in seismic Profile GeoB97-020/027 collected on the Bengal Fan during the R/V Sonne SO125 cruise (Schwenk and Spiess, 2009). Bioturbated pe-lagic and hemipepe-lagic calcareous clays likely represent times of local channel-levee inactivity and hence reduced siliciclastic deposition expressed as a relative increase in the influx of suspended sediment from the pelagic zone. Many calcareous intervals show repeated se-quences of color-graded beds corresponding to upward-increasing entrainment of siliciclastic material.
The nomenclature for lithologic descriptions of fine sediments containing carbonate consists of a principal name and a modifier based on the composition estimated from visual description of the cores and from smear slide observations. The principal name of sediment that appears to contain >75% carbonate is calcareous ooze (see Figure F4 in the Expedition 354 methods chapter [France-La-nord et al., 2016a]). The principal name of sediment that appears to contain <10% carbonate is clay. If sediment contains a mixture of clay-sized siliciclastic particles and calcareous components (i.e., carbonate content between 10% and 75%), the principal name is cal-careous clay. This nomenclature was adopted to describe the con-tinuum of sediments recovered from almost pure clay to almost pure calcareous ooze. In most cases, lithologic names assigned us-ing this protocol match well with measured carbonate content and accurately reflect the continuum of sediments recovered at this site. Examples can be seen in Figure F6 in the Site U1451 chapter (France-Lanord et al., 2016b) and Figure F5 in the Site U1452 chap-ter (France-Lanord et al., 2016c), respectively.
Drilling disturbances observed in recovered sediments from Site U1449 vary in intensity from slight to high and include fractures, up-arching, flow-in, and “soupy” sand-rich layers. See Figure F6 in the Expedition 354 methods chapter (France-Lanord et al., 2016a) for a more detailed description and graphic examples of drilling dis-turbance types.
Unit I
Intervals: U1449A-1H-1, 0 cm, to 1H-CC, 15 cm; 354-U1449B-1H-1, 0 cm, to 1H-5, 57 cm
Depths: Hole U1449A = 0–6.27 m CSF-A; Hole U1449B = 0– 6.57 m CSF-A
Age: Middle Pleistocene–recent
Lithology: nannofossil-rich calcareous clay with foraminifers (major); volcanic ash (minor)
Description
Unit I is composed of 6.57 m of light brown to light gray nanno-fossil-rich calcareous clay with foraminifers. Figure F4A shows an example of such a lithology taken from Unit III. Greenish layers (<1 cm thick) occur in five intervals (354-U1449A-1H-1, 143–150 cm; 1H-2, 133–150 cm; 1H-3, 56–114 cm; 1H-4, 47–101 cm; 1H-5, 0–56 cm). In most cases, these layers are identified by slight color varia-tions. The only exception to this case is a layer of dark greenish silty clay at 1H-3, 76–83 cm, that is slightly coarser than the surrounding sediment. Mottling (due to bioturbation) occurs throughout the core, and prominent burrows filled with white foraminifer-rich fine sand were observed at 1H-1, 57 and 75 cm. A single vertical Zoophy-Table T2. Core recovery by coring system, Site U1449. APC includes advance
by recovery and one core that did not penetrate the formation. Download table in .csv format.
Coring
sys-tem cored (m)Interval Core recov-ered (m) Recovery (%)
APC 57.1 52.37 92
HLAPC 71.9 74.98 104
Figure F3. Lithostratigraphic summary, Hole U1449A. For legend, see Figure F5 in the Expedition 354 methods chapter (France-Lanord et al., 2016a). 200 180 160 140 120 100 80 60 40 20 0 1H 2H 31 4X 5H 6F 7H 8H 9H 10X 11X 12X 13F 14F 15F 16F 17F 18H 19H 20H 21H 22F 23F 24F 25F 26F 27F 28F 29F 30F 31F 32X 33X 34X 35X 36X 37F 38H I IIa IIb IIc III IV V P-wave velocity (m/s) 1640 1440 Graphic lithology Core recovery GRA (g/cm3) 2 1.6 1.2
U1449A Hole summary
Magnetic susceptibility Loop Point (SI) 200 100 0 -10 -5 0 5 10 14 10 6 2 -2 Reflectance L*a*b* 48 28 8 Natural gamma radiation (cps) 95 55 15 Lith. unit Drilling dist ur ba nc e Lith olo gica l acc ess orie s De pth CS F-A (m )
Table T3. Intervals, depths, major and minor lithologies, and ages of units, Site U1449. Download table in .csv format.
Unit Interval Top depth CSF-A (m) Bottom
depth
CSF-A (m) Major lithology Minor lithology Top age Bottom age
354-I U1449A-1H-1, 0 cm, to 1H-CC, 15 cm 0.00 6.27 Calcareous clay Volcanic ash recent Middle Pleistocene U1449B-1H-1, 0 cm, to 1H-5, 57 cm 0.00 6.57
II U1449A-2H-1, 0 cm, to 16F-CC, 18 cm 6.20 83.35 Sand Clay, calcareous clay Middle Pleistocene Middle Pleistocene U1449B-1H-5, 57 cm, to 1H-6, 80 cm 6.57 7.80
III U1449A-17F-1, 26 cm, to 18H-6, 150 cm 83.30 97.00 Calcareous clay Silt, clay, volcanic ash Middle to early
Pleistocene Middle to early Pleistocene IV U1449A-19H-6, 0 cm, to 29F-1, 150 cm 97.50 147.80 Silt, clay Calcareous clay, volcanic ash early Pleistocene early Pleistocene V U1449A-29F-1, 150 cm, to 38H-3, 99 cm 147.80 213.54 Sand Silt, clay, calcareous clay early Pleistocene early Pleistocene
cos backfill trace is present at 1H-2, 92–100 cm (1 cm thick). Two layers of brown volcanic ash (Figure F4B) are present at 1H-2, 30– 51 and 67–73 cm. The upper ash layer fines upward from fine sand– to silt-sized glass fragments; the grain size of the lower layer is fine sand and shows no internal variation in structure.
Composition from smear slides
See Figure F5 for representative smear slide images. Calcareous clay
Calcareous clay mainly consists of calcareous nannofossils with small fragments of radiolarians and diatoms. Minor amounts of clay minerals were also found.
Ash
Ash layers mainly contain volcanic glass shards 0.01–0.3 mm in diameter, accompanied by minor feldspar, quartz, and mica grains. Volcanic glass usually occurs in the form of clear plates, flakes, and strands, with a relatively low refractive index. The typical range for the volcanic glass proportion is 85%–95% of total grains.
Silty sand
Silty sand layers intercalated in the upper part of the unit consist of quartz, feldspar, mica, and lithic fragments. Heavy minerals in-cluding tourmaline, zircon, apatite, and opaque minerals are fre-quently recorded. The maximum diameter of sand grains is 0.25 mm.
Unit II
Intervals: U1449A-2H-1, 0 cm, to 16F-CC, 18 cm; 354-U1449B-1H-5, 57 cm, to 1H-6, 80 cm
Depths: Hole U1449A = 6.20–83.35 m CSF-A; Hole U1449B = 6.57–7.80 m CSF-A
Age: Middle Pleistocene
Lithology: silty fine sand (major); clay, silty clay, nannofossil-rich calcareous clay (minor)
Description
Unit II is composed of 77.15 m of dark gray silty fine sands de-posited in thick beds (sand turbidites) interbedded with gray clays
and silty clays of varying thickness (0.05–1.83 m; mud turbidites). This unit is divided into three subunits. Subunit IIa (354-U1449A-2H-1, 0 cm, to 5H-CC, 19 cm) is 13.63 m thick and composed of turbidites dominated by silty fine sands (Figure F4C). Subunit IIb (6F-1, 0 cm, to 8H-1, 41 cm) is a 14.64 m thick succession of mud and sand turbidites. The upper 1.42 m consists of a massive clay bed. Figure F4D shows an example of such a bed taken from Unit IV. The massive clay is followed by silty sands, silty clays, and clays. Sandy intervals contain mud clasts. Subunit IIb also contains a 13 cm thick white bed of calcareous nannofossil–rich clay with bur-rows (7H-3, 56–69 cm). Subunit IIc (8H-1, 41 cm, to 16F-CC, 18 cm) is 48.87 m thick and comprises dark gray fine sands and silty fine sands (sand turbidites) with one 2.24 m interval of silty clays (14F-1 through 14F-2; mud turbidites).
Composition from smear slides
See Figure F5 for representative smear slide images. Silty clay and clayey silt
Silty clay and clayey silt consist of silt- and clay-sized grains of quartz, feldspar, mica, and heavy minerals. Minor amounts of large grains of quartz and mica (reaching 0.8 mm in diameter) sporadi-cally occur in this lithology. Several black layers intercalated within the silty clay and clayey silt contain organic material, including al-tered wood and plant debris and very fine grained needle-shaped opaque minerals.
Nannofossil-rich calcareous clay
Occasionally intercalated, white calcareous clay is mainly com-posed of calcareous nannofossils with radiolarians. The average range of the nannofossil component is 65%–80%.
Silty sand
Silty sand consists of quartz, feldspar, and mica. As accessory minerals, heavy minerals including tourmaline, zircon, apatite, and opaque minerals are found. The maximum grain size is 0.1–0.41 mm in diameter.
Figure F4. Line-scan images of major lithologies recovered in Hole U1449A. A. White to light gray nannofossil-rich calcareous clay with foraminifers, Unit III (18H-6, 47–64 cm). B. Brownish gray volcanic ash, Unit I (1H-2, 33–50 cm). C. Dark gray silty fine sand with mica, Unit IIa (2H-2, 28–45 cm). D. Dark gray silty clay, Unit IV (20H-2, 4–21 cm).
C
D
B
A
5 cm
Figure F5. Representative smear slide images, Hole U1449A. A. Volcanic ash with abundant glass shards (1H-2, 63.5 cm; parallel nicols). B. Silty sand including quartz, feldspars, and various kinds of heavy minerals (7H-2, 77 cm; parallel nicols). C. Clay containing clay-sized grains and clay minerals (6F-3, 33 cm; parallel nicols). D. Foraminifer-rich calcareous clay with diatoms and radiolarians (1H-3, 9 cm; parallel nicols). E. Nannofossil-rich calcareous clay (7H-3, 65 cm; parallel nicols). F. Nannofossil-rich calcareous clay (7H-3, 65 cm; crossed nicols). 1 mm 1 mm 0.1 mm A B C 0.1 mm 0.1 mm 0.1 mm D E F
Unit III
Interval: 354-U1449A-17F-1, 26 cm, to 18H-6, 150 cm; Hole U1448B not recovered
Depth: 83.30–97.00 m CSF-A Age: early–Middle Pleistocene
Lithology: clay, calcareous clay (major); silty clay, clayey silt, vol-canic ash (minor)
Description
The upper part of Unit III (16F-CC, 18 cm, to 18H-1, 15 cm) is principally composed of light gray laminated clay with frequent for-aminifers (Figure F4A). Silty clay and clayey silt are found in two intervals, at 17F-1, 0–26 cm, and 17F-3, 0–28 cm, respectively.The latter shows normal grading. Mottling (bioturbation) is commonly present, and mud clasts are also found. The lower part of the sec-tion, from 18H-1, 15 cm, to 18H-6, 150 cm, predominantly com-prises mottled (bioturbated) gray and white calcareous clay. Foraminiferal horizons are frequent, and nannofossil-rich horizons are also found. In Section 18H-3, a volcanic ash layer (11–16 cm) is overlain by silty clay (0–11 cm).
Composition from smear slides
See Figure F5 for representative smear slide images. Clayey silt
Clayey silt contains silt-sized quartz and feldspar grains with mica and heavy minerals.
Calcareous clay
Calcareous clay–sized grains and aggregates are the dominant constituents, and clay minerals rarely occur. Nannofossil-rich cal-careous clay mainly consists of nannofossils with minor radiolarians and diatoms.
Ash
The ash layer intercalated in the middle part of this unit consists of platy and flaky volcanic glass. The typical range for the volcanic glass proportion is 65%–85%. Euhedral quartz, feldspar, and very small amounts of mica grains were also observed.
Unit IV
Interval: 354-U1449A-19H-6, 0 cm, to 29F-1, 150 cm; Hole U1449B not recovered
Depth: 97.50–147.80 m CSF-A Age: early Pleistocene
Lithology: silt, silty clay (major); nannofossil-rich calcareous clay with foraminifers, volcanic ash (minor)
Description
Unit IV mostly consists of repeated silt to silty clay sequences (i.e., mud turbidites) from 97 to 147.8 m CSF-A intercalated with medium-bedded calcareous clay between 105.23 and 105.83 m CSF-A and thin volcanic ash between 118.15 and 118.18 m CSF-A. Individual turbidite sequences consist of lower normally graded laminated silt or clayey silt with sharp planar lower boundaries and upper homogeneous to faintly laminated silty clay (Figure F6). The boundary between the lower silt and upper silty clay units is grada-tional and often characterized by a series of silt-clay couplet lami-nae. Turbidite sequences are mainly thin to medium bedded, showing overall fining upward indicated by decreasing thickness and frequency of laminated silt units. The thickness of
fining-up-ward trends is variable from a few tens of centimeters to more than a meter.
Composition from smear slides
See Figure F5 for representative smear slide images. Clayey silt and silty sand
These lithologies consists of quartz, feldspar, and heavy miner-als with mica. Mica grains reaching 0.2 mm in diameter, consider-ably larger than the average grain size, frequently occur. Additionally, occasional thin black layers comprise organic material and pyrite aggregations. The maximum grain size is 0.08–0.2 mm in diameter.
Nannofossil-rich calcareous clay and ash
Nannofossil-rich calcareous clay in the upper part of the unit contains calcareous nannofossils, radiolarians, and clay minerals. Part of this clay is contaminated by significant amounts of platy vol-canic glass, clay minerals, and radiolarians.
Unit V
Interval: 354-U1449A-29F-1, 150 cm, to 38H-3, 99 cm; Hole U1449B not recovered
Depth: 147.80–213.54 m CSF-A Age: early Pleistocene
Lithology: sand, silty sand (major); silty clay, silt, clay, calcareous clay (minor)
Description
This unit has poor recovery. Thick-bedded, dark gray, fine mica-ceous sands and silty sands dominate the lithology (i.e., sand turbi-Figure F6. A. Three successive laminated silt to silty clay turbidite beds in Unit IV, Hole U1449A. Note sharp planar boundaries of the lower laminated silt units and gradational contacts with the upper silty clay units character-ized by silt-clay couplet laminae (23F-2, 0–43 cm; 119.60–120.03 m CSF-A). Arrows indicate thickening to thinning upward trend. B. Lithologic log of Sections 23F-1 and 23F-2 (118.18–121.06 m CSF-A), showing two fining-upward sequences. VF = very fine, F = fine, M = medium, C = coarse.
A
Depth CSF-A (m)
Cla
y
Silt VF sand F sand M sand C sand
Lithology 118.2 118.4 118.6 118.8 119.0 119.2 119.4 119.6 119.8 120.0 120.2 120.4 120.6 120.8 121.0
B
dites). From Section 33X-CC downhole, finer grained facies are recorded. Micaceous silt, dark gray silty clay sometimes alternating with very thinly bedded dark gray silt (mud turbidites), calcareous clay with nannofossils interbedded with thin bedded silt, and one bed of nannofossil-rich calcareous clay (38H-1, 46–80 cm) occur.
Composition from smear slides
See Figure F5 for representative smear slide images. Silty sand
Silty sand consists primarily of quartz, feldspar, lithic fragments, mica, and heavy minerals. Rock fragments are typically volcanic and granitic in texture. Gneiss lithic fragments exhibit mosaic texture with biotite and quartz. Large fragments of mica and quartz, reach-ing 0.5 mm in diameter, are ubiquitous.
Clayey silt
Clayey silt mainly contains detrital grains, calcareous nannofos-sils, and radiolarians. The mineralogy of clayey silt is similar to that of silty sand.
Nannofossil-rich calcareous clay
Nannofossil-rich calcareous clay frequently contains clay miner-als, radiolarians, and foraminifers.
Maximum grain size
Maximum grain size was determined at approximately 9 m in-tervals at Site U1449. In each case, the coarsest and/or thickest li-thology in the individual core (generally from the base of the coarsest turbidite) was chosen for smear slide analysis, and the larg-est five equant detrital grains (quartz and feldspar) were measured (Figure F7). The maximum grain size ranges from 0.05 to 0.47 mm (coarse silt to medium sand) and corresponds to the sand and silt turbidite at the base of Subunit IIa. However, background values throughout the sequence show that coarse silt–sized material reached the fan setting at Site U1449 via turbidity currents since at least the early Pleistocene.
XRD
Samples were taken at an interval of approximately one every four cores. Clay minerals were extracted from representative lithol-ogies (sand, silt, clay, and calcareous clay). The observed clay min-eral assemblages are mainly composed of illite, chlorite, smectite, and kaolinite (Figure F8). Minor sepiolite was detected in some samples, and its presence is probably due to injections of drilling mud during coring of Cores 354-U1449A-10X and 33X. Illite is the dominant clay mineral. Bulk mineralogy analyzed in ash layers shows high calcite content (31.1 wt% from inorganic geochemistry),
clay minerals, mica, and minor detrital quartz kaolinite (Figure F9). Fine sand contains quartz, feldspar, calcite, and clay minerals. Figure F7. Maximum grain size, Hole U1449A.
200 180 160 140 120 100 80 60 40 20 0 1H 2H 31 4X 5H 6F 7H 8H 9H 10X 11X 12X 13F 14F 15F 16F 17F 18H 19H 20H 21H 22F 23F 24F 25F 26F 27F 28F 29F 30F 31F 32X 33X 34X 35X 36X 37F 38H I IIa IIb IIc III IV V Graphic lithology Core
recoveryLith.unit 0 0.25 0.5 0.75 1 1.25
D ep th C S F -A ( m )
Maximum grain size (mm) Coarse sand Fine sand
Figure F8. Ethylene glycol–treated X-ray diffractograms of oriented clay aggregates, Hole U1449A. CaCO3 content of the clay sample is relatively high
(42.1 wt% from inorganic geochemistry, among the highest values encoun-tered at this site). <2 µm fraction calcite occurs in the diffractogram. Orange ovals indicate sample locations, except for the lower part, where the super-natant water was sampled.
Illi te Chlor ite Kaolinit e Kaolinit e /Chlor ite Qu ar tz Illi te Qu ar tz /I lli te Chlor ite Chlor ite In te ns ity ( co un ts /1 0 0 0 ) 5 10 15 20 25 30 °2θ 10 0 20 30 Fe ld sp ar 354-U1449A-37H-3 Supernatant water (fine sand) EG 354-U1449A-1H-4, 42-47 cm Calcareous ooze In te ns ity ( co un ts /1 0 0 0 ) 5 10 15 20 25 30 10 20 0 Illi te Chlor ite Kaolinit e Kaolinit e /Chlor ite Qu ar tz Illi te Qu ar tz /I lli te Chlor ite Chlor ite EG Fe ld sp ar °2θ 354-U1449A-17F-2, 59-64 cm Clay Smec tit e Illi te Chlor ite Kaolinit e Kaolinit e /Chlor ite Qu ar tz Illi te Qu ar tz /I lli te Chlor ite Chlor ite 5 10 15 20 25 30 In te ns ity ( co un ts /1 0 0 0 ) 0 8 12 4 EG Sepiolit e Sepiolit e Cal cit e Cal cit e Amph? Fe ld sp ar °2θ
Figure F9.ray diffractograms, Hole U1449A. A. Ethylene glycol–treated X-ray diffractogram of oriented clay aggregates. B, C. X-X-ray diffractograms of bulk samples. Orange ovals = sample locations.
354-U1449A-1H-2, 66-71 cm Ash layer <2 µm 15 10 20 25 30 5 10 20 0 In te ns ity ( co un ts /1 0 0 0 ) EG Illi te Ka olinit e /Chlorit e Ka olinit e Qu ar tz Qu ar tz /I lli te Chlor ite Smec tit e Chlor ite °2θ 354-U1449A-1H-2, 66-71 cm Ash layer In te ns ity ( co un ts /1 0 0 0 ) 40 20 30 50 60 10 10 20 0 Mi ca /I lli te Cal cit e Cal cit e Mi ca /I lli te Cal cit e Qu ar tz Qu ar tz Cal cit e Cal cit e Mi ca /I lli te Mi ca /I lli te Qu ar tz Mi ca /I lli te Kaolinit e /Chlor ite °2θ In te ns ity ( co un ts /1 0 0 0 ) 6 10 14 2 40 20 30 50 60 10 354-U1449A-17F-2, 2-7 cm Fine sand Mi ca /I lli te Cal cit e Cal cit e Qu ar tz Qu ar tz Mi ca /I lli te Qu ar tz Kaolinit e /Chlor ite Chlor ite Fe ld sp ar Cal cit e °2θ
A
B
C
Biostratigraphy
Calcareous nannofossils and planktonic foraminifers provide biostratigraphic constraints at Site U1449. Overall, the abundance and preservation of these microfossils are dependent on the type of lithology recovered. Coarser sandy intervals contain few to barren calcareous nannofossils and barren to <0.1% foraminifers, but abun-dance and preservation improve considerably in the pelagic and hemipelagic intervals. These pelagic and hemipelagic layers were interrupted by turbidites and levee sedimentation. The biostrati-graphic controls identified at this site are shown in Table T4.
Calcareous nannofossils
The distribution of calcareous nannofossils is shown in Table
T5. Based on nannofossil biostratigraphy, the sediments from Hole U1449A extend to the lower Pleistocene. Identified biomarkers in-clude the first occurrence (FO) of Emiliania huxleyi in Sample 2H-CC. Unfortunately, no core was recovered in the next two intervals, but the presence of Pseudoemiliania lacunosa in Sample 5H-CC suggests that the Zone NN20/NN19 boundary (0.44 Ma) is in Core 5H. The appearance of Helicosphaera sellii in Section 20H-2
indi-cates a depositional age older than 1.26 Ma. The presence of Calci-discus macintyrei in Sample 36X-CC suggests an age older than 1.6 Ma. Two Discoaster spp. were also observed in Sample 38X-CC, which would date the bottom of the hole to the early Pleistocene (>1.93 Ma).
Planktonic foraminifers
The planktonic foraminifer biostratigraphy for Site U1449 is based on the shipboard study of Hole U1449A core catcher samples. Supplementary samples were taken from core sections when time permitted or when no foraminifers were found in the core catcher. Sandy samples are predominantly barren (or contained <0.1% fora-minifers), whereas mud-rich samples have foraminifers in abun-dances ranging from rare (<5%) to abundant (>25%). Foraminiferal preservation ranges from moderate to very good in samples where foraminifers occur, and planktonic foraminifer fragmentation varies from light (>10%) to severe (25%–50%).
Though few index species are present, planktonic foraminifer biostratigraphic biomarkers and the assemblages present indicate the sediments at Site U1449 are Pleistocene in age. Sample 36X-CC
contains the FO of Globigerinoides fistulosus, a biomarker species for foraminiferal Zone PL6 (>1.88 Ma).
Group and species abundances of planktonic foraminifers are shown in Table T6. Biostratigraphic datums and absolute ages are shown in Table T4 and are taken from the compiled list in Table T2
in the Expedition 354 methods chapter (France-Lanord et al., 2016a).
Planktonic foraminifer assemblages at Site U1449 are tropical throughout the cored section. These assemblages are dominated by Globigerinoides ruber, Globigerinoides sacculifer, Neogloboquadrina dutertrei, Pulleniatina obliquiloculata, and Sphaeroidinella dehis-cens. There are occasional horizons dominated by Orbulina uni-versa.
Paleomagnetism
We completed a preliminary paleomagnetic study on 30 of the 38 cores collected from Hole U1449A, with our work focused on identifying polarity reversals and matching them to the timescale of Gradstein et al. (2012).
Incomplete core recovery and sandy lithologies presented chal-lenges for the collection and interpretation of paleomagnetic data in some intervals of Hole U1449A. Recovery was limited in the levee and channel fill deposits between ~40 and ~60 m CSF-A (see Litho-stratigraphy). Recovered sands are often waterlogged (soupy) or deformed. Coring deformation is common in fine-grained intervals as well, including calcareous clay, mud turbidites, and levee depos-its.
Full-vector paleomagnetic data, typically used to make polarity interpretations at low-latitude sites, were not available for most Site U1449 cores. Low inclinations (15.7°) of the geomagnetic field were expected at Site U1449 based on the geocentric axial dipole (GAD) prediction. Only two APC cores (2H and 8H) were fully oriented us-ing the Icefield MI-5 tool; however, drillus-ing disturbance rendered the declination data from these oriented cores questionable. Ac-cordingly, the declination data reported here allow identification of polarity transitions within cores; polarity transitions between cores are inferred. The declinations reported here are not oriented geo-graphically. However, declinations measured on these cores may al-low reorientation of cores for future magnetic anisotropy studies.
Remanent magnetization measurements were made on most ar-chive section halves (Nsections = 95) and on discrete samples from
working section halves (Nsamples = 42) for Hole U1449A (Figure F10;
Tables T7, T8). The natural remanent magnetization (NRM) of ar-chive section halves was measured on the shipboard superconduct-ing rock magnetometer (SRM) before and after 20 mT alternatsuperconduct-ing field (AF) demagnetization. Remanence vectors measured after 20 mT peak AF demagnetization are used here for polarity determina-tions. Sections were visually inspected before measurements and were not measured when the sediment was soupy or heavily dis-turbed by the coring process. Some sections were remeasured after correcting a problem with position measurements along the SRM core track (see Paleomagnetism in the Expedition 354 methods chapter [France-Lanord et al., 2016a]).
Discrete sample locations were chosen in fine-grained intervals where drilling deformation was not visible or minimal. These sam-ples were measured on either the SRM or JR-6 spinner magneto-meter before and after 10, 15, 20, 25, 30, 35, 40, and in some cases 50 and 60 mT AF demagnetization, with a measurement protocol de-signed to minimize gyroremanent magnetization (GRM) and an-hysteretic remanent magnetization (ARM) used above 40 mT (see
Paleomagnetism in the Expedition 354 methods chapter [France-Lanord et al., 2016a]; Table T7). AF steps ranging between 10 and 40 mT were included in the direction determination for all samples. Specific steps were chosen based on the demagnetization behavior of each sample. Demagnetization behavior of discrete samples demonstrate that 20 mT was sufficient to remove the vertical re-magnetization associated with the drill string overprint (Figure
F11). Coercivities of the remanence carriers are consistent with magnetite and/or titanomagnetite as the principal NRM carrier. The specific magnetic mineral assemblages will be assessed during postexpedition research.
Results
More than 98% of the NRM intensities from Hole U1449A ar-chive section halves range between 10–4 and 1 A/m. The pattern of
NRM intensities remains the same after 20 mT AF demagnetiza-tion, although it decreases by approximately an order of magnitude. Variations due to lithology occur in both magnetic susceptibility and NRM intensity values. Lithologic contrasts are particularly clear in the low NRM intensities (and low magnetic susceptibilities) associated with calcareous clay between 0 and ~6 m CSF-A and be-tween ~86 and ~97 m CSF-A (see Lithostratigraphy). Calcareous layers in Cores 8H and 20H are also associated with low NRM in-tensities. Sandy turbidites in Cores 5H–8H and 13F–16F are associ-Table T4. Biostratigraphic age datums and midpoint calculations, Site U1449. FO = first occurrence, LO = last occurrence. Download table in .csv format.
Top core, section, interval
(cm) Bottom core, sec-tion, interval (cm) Zone Marker event GTS2012 age (Ma) Top depth CSF-A (m) Bottom depth CSF-A (m) Midpoint depth CSF-A (m) Depth CSF-A (m) ± Planktonic foraminifer datums (Wade et al., 2011):
354-U1449A-
354-U1449A-6F-2W, 47–52 7H-CC PT1b LO Globorotalia tosaensis 0.61 21.97 29.51 25.74 3.77 28F-CC 36F-CC PL5 LO Globigerinoides fistulosus 1.88 146.39 195.34 170.87 24.48 Calcareous nannofossil datums (Gradstein et al., 2012):
354-U1449A- 354-U1449A-2H-CC 5H-1, 104–105 NN21 FO Emiliania huxleyi 0.29 9.82 18.05 13.94 4.12 NN20 Gap zone 5H-1, 104–105 5H-CC NN19 LO Pseudoemiliania lacunosa 0.44 18.04 19.99 19.02 0.97 19H-3, 14–15 20H-2, 27–28 LO Helicosphaera sellii 1.26 100.64 106.88 103.76 3.12 35X-CC 36X-CC LO Calcidiscus macintyrei 1.60 185.62 195.33 190.48 4.85
Table T5. Calcareous nannofossils, Site U1449. Download table in .csv for-mat.
Table T6. Planktonic foraminifers group and species abundance, Site U1449. Download table in .csv format.
ated with some variability in NRM intensity, although perhaps not significantly more than in muddy facies deeper in the hole (Figure
F10).
Magnetostratigraphy
Based on section-half and discrete sample data, we interpret the paleomagnetic data from Hole U1449A to indicate intervals of both normal and reversed polarity, as well as intervals in which the polar-ity is uncertain. Although both positive and negative inclinations are present in Hole U1449A, the amount of noise in the inclination data and the shallow expected inclination at the site make it difficult to use inclination for magnetic polarity assignment. Nonetheless, the majority of section halves from Cores 1H, 6F, 7H, and 8H and their discrete samples all have inclinations consistent with normal polarity. One discrete sample (6F-3, 65–67 cm) in this interval has a
low-angle, negative characteristic remanent magnetization (ChRM) inclination (–3.8°). The range of declinations in Core 7F is large, possibly due to twisting during drilling, although the inclinations are consistent with a normal magnetization. Cores 17F, 19H, 24F, and 25F and the top of Core 29F have well-defined positive inclina-tions and uniform declinainclina-tions, consistent with normal polarity. Cores 20H and 22F have well-defined negative inclinations.
Calcareous clay sediments in Core 18H have ChRM declinations that appear to be clustered in two groups with modes separated by 180°. Close examination of the declination data from this interval in Core 18H indicates five polarity transitions, including a short inter-val present near the bottom the core (Figure F12).
Core 38H, at the bottom of Hole U1449A, has considerable scat-ter in ChRM directions. Although many of the inclinations mea-sured on the archive section half could be interpreted as normal Table T7. ChRM of discrete samples, Hole U1449A. Download table in .csv format.
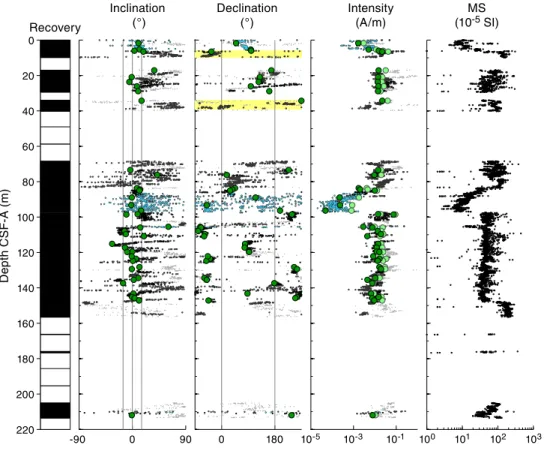
Figure F10. NRM of archive section halves and discrete samples before and after 20 mT AF demagnetization, Hole U1449A. Light gray points = before demag-netization. Dark gray circles = intervals that do not meet quality criteria (see Paleomagnetism in the Expedition 354 methods chapter [France-Lanord et al, 2016a]). Blue dots = calcareous clay, red dots = volcanic ash, black dots = other lithology. Inclination and declination: dark green dots = principal component directions from discrete samples. Inclination: gray lines either side of 0° = expected inclinations from GAD. Declination: yellow = oriented cores. Declinations are in a geographic reference frame only where orientation data are available. Intensity: intensity of magnetization before and after demagnetization. Light green dots = before demagnetization, dark green dots = after demagnetization. Magnetic susceptibility (MS) = point measurements on archive section halves.
0 20 40 60 80 100 120 140 160 180 200 220 -90 0 90 0 180 10-5 10-3 10-1 100 101 102 103 D ep th C S F -A ( m ) Inclination
(°) Declination (°) Intensity (A/m) (10MS -5 SI)
Recovery
Table T8. Orientation data, Hole U1449A.Download table in .csv format.
Hole Core Core type
Azimuthal ori-entation (°) Fisher mean declina-tion (°) Mean oriented decli-nation (°) Comments
A 2 H 212.9 117.0 –30.1 Directions from 20 mT step after removing section edges and disturbed intervals A 8 H 158.1 101.1 259.2 Directions from 20 mT step after removing section edges and disturbed intervals
polarity, many are too steep for this location. In addition, the ChRM of the discrete sample from this interval does not agree with the ar-chive-half measurements. We do not assign a polarity to this core.
Interpretation of the magnetic polarity zones is relatively straightforward to Core 18H (Table T9). We interpret Cores 1H– 17F as having acquired magnetization during the Brunhes Chron (C1n; 0–0.78 Ma; Gradstein et al., 2012). Assuming no missing time between Cores 17F and 18H and no large changes in sedimentation rates in the pelagic interval of Core 18H, we identify the polarity zones in Core 18H as the normal polarity Brunhes Chron (C1n), the reversed polarity Matuyama Chron (C1r), and the Jaramillo (C1r.1n) and Cobb Mountain (C1r.2n) Subchrons. The normal po-larity interpretation of Core 19H is problematic. Although it is
tempting to match it with the Olduvai Subchron (C2n; 1.778–1.945 Ma), this match implies an age that is much older than that deter-mined from biostratigraphic markers, particularly Helicosphaera sellii, which does not make its first appearance until Core 20H (see
Biostratigraphy). It is possible that Core 19H has been remagne-tized, either during the coring process or in situ by a chemical rema-nent magnetization (CRM). We plan to investigate these possibilities in postexpedition studies.
We expect that lithologic correlation between multiple sites in the Expedition 354 transect and the use of seismic reflectors as tie points from one site to another will help to clarify our interpretation of the magnetostratigraphy of Hole U1449A.
Figure F11. AF demagnetization diagrams (Kirschvink, 1980) of four discrete samples, Hole U1449A. Points = projected endpoints of remanent magnetization vector measured for each sample in core coordinates (azimuth not oriented). All samples have vertical overprint removed with 10–20 mT AF demagnetization. A, B. Typical demagnetizations indicating normal (Sample 17F-2, 19–21 cm) and reversed (Sample 20H-3, 27–29 cm) polarities. C, D. Demagnetization of sam-ples for which the determination of ChRM was not straightforward.
E W U1449A-17F-2W, 19-21 cm E W S, Down S, Down S, Down S, Down E W E W U1449A-17F-2W, 27-29 cm Horizontal Vertical U1449A-29F-2W, 157-159 cm U1449A-22F-3W, 84-86 cm
A
B
C
D
Unit = 2.05 × 10⁻³ A/mUnit = 3.88 × 10⁻³ A/m Unit = 2.44 × 10⁻³ A/m
N, Up
N, Up N, Up
N, Up
Geochemistry and microbiology
Sediment gas sampling and analysis
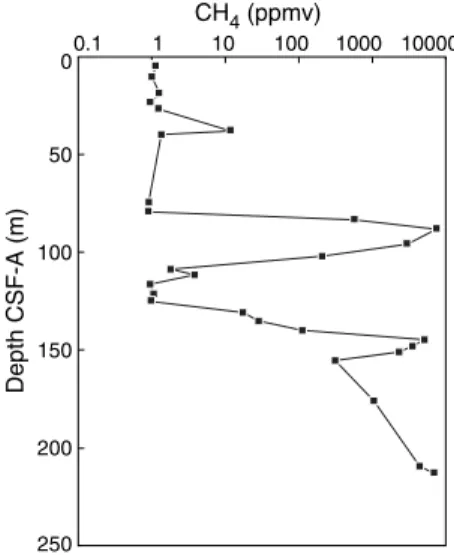
Headspace gas samples were taken at a frequency of one sample per core in Hole U1449A as part of the routine safety monitoring program (Table T10; Figure F13). Methane concentrations are con-sistently very low (1–12 ppmv) from 4.5 to 78.5 m CSF-A, peak at 7450 ppmv at 87.5 m CSF-A, and decrease sharply to reach back-ground level (~1 ppmv) at 116.4 m CSF-A. Methane concentrations start to rise again at 130.5 m CSF-A and vary between 155 and 6908 ppmv to the base of the hole. Ethane, ethene, propane, and propene are below the quantification limit in all samples.
Interstitial water sampling and chemistry
A total of 39 samples from Holes U1449A and U1449B were an-alyzed for interstitial water chemistry (Table T11). In Hole U1449A, 10 samples, including one duplicate, were obtained by Rhizon
sam-pling from the uppermost 81 m CSF-A, with coarser samsam-pling (one per 10 m) obtained from deeper whole-round samples. High-reso-lution (one per section) pore water profiling was conducted in Hole U1449B (0–7 m CSF-A). In certain sections, notably lithostrati-graphic Units II and V (6–83 and 148–213 m CSF-A, respectively), sampling was limited by poor recovery and loose sands that were not suitable for pore water analyses.
Except for one anomalous value (not duplicated by ion chroma-tography) of 582 mM, chloride concentrations vary from 550 to ~575 mM in Hole U1449B with no downcore pattern (Table T11). Thereafter, only the chloride concentrations obtained by ion chro-matography are used and are expressed as salinity (see Geochemis-try and microbiology in the Expedition 354 methods chapter [France-Lanord et al., 2016a]). They vary between 35.4 near the wa-Figure F12. Polarity interpretation, Core 354-U1449A-18H. Circles = measurements that do not pass quality control criteria. Blue dots = calcareous clay, black dots = other lithology, green dots = measurements on discrete samples. Declination is rotated and illustrates magnetostratigraphic interpretation. A single vertical axis rotation was applied to the entire core so that points interpreted as normal polarity plot near the 0° line. Intensity = intensity of magnetization after 20 mT AF demagnetization. Magnetic susceptibility (MS) = point measurements on archive section halves. Polarity: black = normal, white = reversed, gray = uncertain. Geomagnetic polarity timescale (GPTS) of Gradstein et al. (2012). J = Jaramillo Subchron, CM = Cobb Mountain Subchron.
-90 0 90 89 90 91 92 93 94 95 96 97 0 180 10-5 10-4 10-3 10-2 101 102 0.78 0.99 1.07 1.17 1.19 C1 n C1 r.1 n Brunhes Ma tu ya ma J CM Inclination
(°) Declination (°) Intensity (A/m) (10MS-5 SI)
C1 r.1 r C1 r. 2r C1 r.3 r C1 r.1 n D ep th C S F -A ( m ) Polarity GPTS 2012 Chron
Table T9. Magnetostratigraphy, Hole U1449A. Download table in .csv format.
Polarity interval top depth CSF-A (m)
Top chron/ subchron age
(Ma) Chron/subchron Comments
0.00 0 Brunhes (C1n)
91.08 0.781 Matuyama (C1r.1r) Break between Sections 18H-2 and 18H-3 93.80 0.988 Jaramillo (C1r.1n)
94.97 1.072 Matuyama (C1r.2r)
96.25 1.173 Cobb Mountain (C1r.2n) Characterized by discrete sample and section-half measurements 96.53 1.185 Matuyama (C1r.3r)
Table T10. Methane concentrations, Hole U1449A. Download table in .csv format.
ter/sediment interface to 37.0 g/kg. Bromide concentrations are closely correlated with chloride concentrations, and Br–/Cl– ratios
rise from 154 × 10–5 (close to seawater ratio) near the
water/sedi-ment interface to 161 × 10–5 at 115 m CSF-A.
Alkalinity increases rapidly in the uppermost 22 m CSF-A, reaching a peak of 21.4 mM before starting to decrease (Figure
F14). A secondary peak of 12.2 mM at 126 m CSF-A corresponds to the middle of lithostratigraphic Unit IV. In the deepest sample from Hole U1449A (212.48 m CSF-A), alkalinity decreases to 5.6 mM. Sulfate concentrations drop rapidly to values between 0 and 1 mM around 32 m CSF-A and remain constant throughout the rest of the hole. A notable exception is the duplicate of a fast-flowing Rhizon (8H-2, 75–82 cm) with values of 0.5 and 2.9 mM for the first and the last liquid sampled by the Rhizons, respectively, suggesting that fast-flowing Rhizons sample coarse-enough lithology to allow drill-ing fluid to penetrate to the inner part of the core. That duplicate, with higher sulfate concentrations, is not considered in the follow-ing description and is not included in Figure F14. Phosphate and ammonium (only measured on Hole U1449B samples) concentra-tions show similar increases (from 3.4 and 2.8 µM near the wa-ter/sediment interface to 69 and 18 µM, respectively) in the uppermost 2 m and are decoupled from 2 m CSF-A to the bottom of Hole U1449B (Figure F15). The ammonium concentration at 7 m CSF-A in Hole U1449B is 248 µM. In Hole U1449A, phosphate con-centrations reach a maximum in excess of 110 µM between 22 and 36 m CSF-A. Phosphate concentrations decrease below this interval and drop rapidly to less than 10 µM at the bottom of Unit II, with some scatter in Units III and V but never exceeding 41 µM. Silica concentrations show a downward trend in Unit I from 738 to 349 µM and remain at 150–350 µM in Units II–V with only elevated val-ues associated with ash layers (2.22 m CSF-A in Hole U1449A) or calcareous clay in lithostratigraphic Units I and III, likely related to the local dissolution of siliceous tests within these hemipelagic units.
None of the major cation concentrations, including sodium, cal-cium, magnesium, and potassium, are strongly correlated with any of the anions. All exhibit a decrease with depth (Figure F14). Within uncertainties of the sampling and analytical methods, magnesium
concentrations decrease monotonously from 55 mM at 0.5 m CSF-A to 36 mM at 212 m CSF-CSF-A. In detail, the rate of decrease is greater in the uppermost 50 m CSF-A and is correlated to a decrease in cal-cium concentrations. This rate likely reflects authigenic carbonate deposition in response to coeval increase of alkalinity and decrease of sulfate concentrations in lithostratigraphic Units I–II. Sodium concentrations slightly increase in Units I and II to a maximum of 488 mM at 27–36 m CSF-A before decreasing to values between 476 and 481 mM for the rest of the hole. Potassium first rises from the seawater/sediment interface to a peak of 12.9 mM near the bot-tom of Unit I, and then concentrations decrease with depth from seawater values to 3.4 mM at 212 m CSF-A, with a secondary peak of 7.6 mM in Unit III. In Units IV and V, all of the cations, including sodium, appear to exhibit the influence of water-sediment ex-change: K, Na, and Mg concentrations decrease, Ca concentrations increase, and Si concentrations remain constant.
Bulk-sediment geochemistry
Total inorganic carbon (TIC) concentrations were determined on 37 sediment samples from Hole U1449A (Table T12; Figure
F16). TIC values expressed as weight percent calcium carbonate (CaCO3) content (i.e., assuming inorganic carbon is exclusively
present as CaCO3) range between 1.2 and 61.0 wt% (average = 8.3
wt%) and do not show systematic variation with depth. Turbiditic sediments are characterized by low carbonate contents (1.2–5.6 wt%; average = 3.6 wt%), whereas hemipelagic intervals (calcareous clays) are characterized by higher carbonate contents (26.7–61.0 wt%). Within turbidites, no systematic covariation between grain size, as deduced from Al/Si (see below), and carbonate content was observed. Furthermore, the range in carbonate content and its inde-pendence to grain size match similar observations in the modern Ganga-Brahmaputra river system (Galy et al., 1999; Lupker et al., 2012). Our results are also consistent with findings in active chan-nel-levee sediments deposited over the past 18 ky in the Bay of Ben-gal at 16°N and with isotopic compositions diagnostic of predominant detrital origin (Lupker et al., 2013). Together, these observations suggest that detrital carbonates derived from erosion of Himalayan rocks dominate the carbonate load in turbiditic sedi-ments recovered at Site U1449.
Major and trace element concentrations were determined on 12 sediment samples from Hole U1449A by inductively coupled plasma–atomic emission spectroscopy (ICP-AES) (Table T13). Bulk-sediment samples were processed without any seawater or pore water component cleaning prior to analysis; thus, Na concen-trations are affected by contribution from these fluids. As expected, bulk-sediment major element compositions largely reflect lithology. SiO2 ranges between 72.3 wt% (sands) and 19.9 wt% (calcareous
clays). Al2O3 is highest in turbiditic clay-rich facies (18.5 wt% ± 0.6;
N = 3) and lowest in calcareous clays (5.1 wt%). CaO content is highest in calcareous lithologies (range = 31.2–17.6 wt%) and rela-tively invariant in turbiditic sediments that have >49 wt% SiO2 (CaO
= 2.4 wt% ± 0.3; N = 9). Fe2O3/SiO2 ratios show clear divisions at the
2σ level separating turbiditic sediments as a function of grain size (average sand = 0.052 ± 0.009; silty clay = 0.094 ± 0.001; clay = 0.145 ± 0.013). The Fe/Si versus Al/Si trend for this data set closely tracks that published by Galy and France-Lanord (2001) and Lupker et al. (2012) for modern sediments in the Ganga-Brahmaputra river sys-tem (Figure F17) and is controlled by the mineralogical sorting of primarily quartz-rich sand and mica-enriched silt and clay during transport (Garzanti et al., 2011). As such, Al/Si provides a proxy for grain size and mineralogy, with low values representing quartz-rich Figure F13. Methane concentrations, Hole U1449A.
0 50 100 150 200 250 0.1 1 10 100 1000 10000 Depth CSF-A (m) CH4 (ppmv)
Table T11. Interstitial water geochemical data, Site U1449. Download table in .csv format.