MiTLibraries
Document Services Room 14-0551 77 Massachusetts Avenue Cambridge, MA 02139 Ph: 617.253.2800 Email: docs@mit.edu http://Iibraries.mit.edu/docsDISCLAIMER OF QUALITY
Due to the condition of the original material, there are unavoidable flaws in this reproduction. We have made every effort possible to provide you with the best copy available. If you are dissatisfied with this product and find it unusable, please contact Document Services as soon as possible.
Thank you.
Some pages in the original document contain pictures, graphics, or text that is illegible.
THE DECONTAMINATION OF RADIOACTIVE ION
FXCHANGE RESINS USING NEUTRAL SALTS AS ELUTRIANTS
Joseph S. Baron Edward A. Mason
N. Thomas Olson
MITNE-133
Nuclear Engineering Department Massachusetts Institute of Technology
635123
ABSTRACTAn effective means of concentrating the radioactivity found on demineralizers in a water-cooled nuclear reactor's primary coolant system was sought. Elution experiments
using sodiuum and ferric chloride/sulfate salts as eluting
agents were conducted. The most tightly bound ions from
valence groups -1 to +4 were used* to represent their
val-ence groups. Operational parameters investigated included
flow rate, temperature, and eluant concentration.
Experiments-showed that for the heavy, polyvalent, metal ions, the sulfate anion proved* extremely effective
in aiding the elution through complexing. Elevated
tempera-tures which increased the diffusional rate, decreased the
complexingr. The result is that increased temperatures ere
of no advantage. Extremely low flow rates (-.Olgpm/ft
)
would have to be used to compensate for the polyvalent ion's
low diffusional rate in the resin. Concentrated ferric
sulfate solutions ( 1N) were found to be effective in
concentrating the radioactivity.
For ions in valence groups +1 and +2, dilute ferric
chloride solutions ( ~ 1/7N4) at ambient temperatures were
used to take advantage of the iron's higher valence (mass action law) and to avoid precipitation of the alkaline
earths by the sulfate anion. Ferric salts could not be
used for elution of the anionic resins due to a redox reaction with iodide which deposited iodine in the resin. Sodium sulfate was used with better results,
The radioactivity can be concentrated in the range
of to 4o times depending on the particular ions involved
-3-
-w4-TABLE OF CONTENTS TITLE PAGE 1 ABSTRACT 2 ACINOWLE DGEEINI1'S3
TABLE OF CONTENTS LIST OF FIGURES 7 LIST OF TABLES 9 I INTRODUCTION 10 II THEORY OF SELECTIVITY 16III EXPERIMENTAL PROCEDURE 30
3.1 Experimental Apparatus 30
3.1.1 Pure Water Section 30
3.1.2 Elutriant Mixing and Storage 30
3.1.3 Column 32
3.1.4 Flow Measurement 33
3.2, Procedure 33
3.3 Variables 34
3.4 Selection of Test Ions 34
3.4.1 Test Ions 34
3.4.2 Selection Criteria 34
3.4.3 -Importance of Thorium Selection 36
3.5 Neutral Salts as Eluting Agents 37
3.5.1 Selection of Elutriants
3.5.2 Physical Properties of Eluting Agents
-5-3.6 Resin 41
3.6.1
Resin Properties 413.6.2 Resin Form 41
3.6.3 Resin Form Justification 41
3.6.4 Resin Loading 42 3.6.5 Loading Distribution 42 IV DISCUSSION OF RESULTS 43 4.1 Thorium 43 4.2 Scandium 62
4.3
Barium 68 4.4 Cesium 70 4.5 Iodide 73 V APPLICABILITY OF RESULTS 76 5.1 Introduction 76 5.2 Loading 765.3 Ion Distribution in the Column 79
5.4
Column Dimensions 805.5
Non-Equilibrium Elution 81VI PROCESS AND CALCULATIONAL EXAMPLE 88
VII CONCLUSIONS AND RECOMMENDATIONS 96
APPENDIX A - ELUTION CONDITIONS AND TYPICAL RUNS 99
APPENDIX B - ANALYTICAL TECHNIQUES 105
B,1 Colorimetric Analysis 105
B.1.1 Statistical Methods 105
-6-B.1,3 Thorium Analysi.3. 109
B.2 Radioactive Tracer Analysis 112
B,3 Titrimetric Analysis 115
B.3.1 Iodide 115
B.3.2 Sulfate 117
-7-LIST OF FIGURES
1. Experimental Flow Diagram 31
2. Plot of Ferric Sulfate and Thorium
Concen-trations Versus Effluent Volume 44
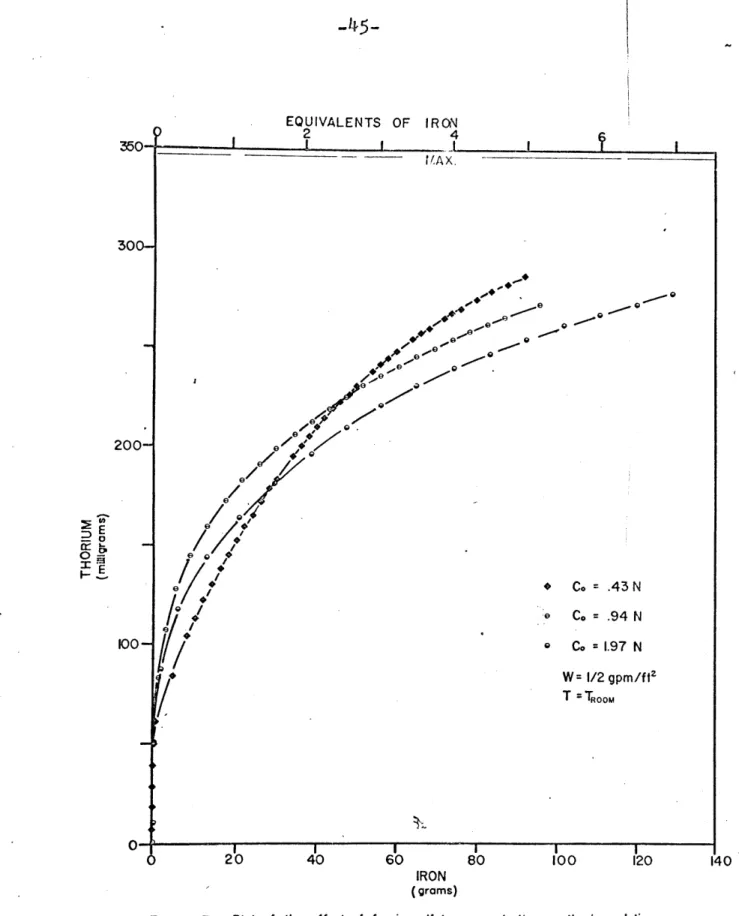
3. Plot of the Effect of Ferric Sulfate Con-4
centration on Thorium Elution 45
4. Plot of the Effect of Flow Rate on Thorium6
Elution by Ferric Sulfate 46
5.
Plot of the Effect of Temperature onThorium Elution Under Various Conditions 47 6. Plot of the Fraction of Thorium Remaining
on the Column Resin Versus Iron in the Effluent as a Function of Flow Rate for
Co = 0.94N, T = TR, and Ferric Sulfate 49 7. Plot of the Fraction of Thorium~Remaining
on the Column Resin Versus Iron in the Effluent as a Function of Concentration
for W = 1/2 gpm/ft 2 , T
=
TR, and FerricSulfate
50
8. Plot of the Fraction of Thorium Remaining on the Column Resin Versus Iron in the Effluent at T = 750C for Different Flow
Rates and Ferric Sulfate Concentrations 51
9. Plots of Thorium Elution Slopes Versus
Iron Concentrations and Flow Rates
56
10. Plot Demonstrating Experimental
Reproduci-bility 60
11. Elution of Thorium From an Initially Completely Loaded Resin Using Sodium Chloride as
Elutri-ant 61
12. Plot of Ferric Sulfate and Scandium Concentra- 63 tions Versus Effluent Volume
-8-13. Elution of Scandium for Varying Flow
Rates, Ferric Concentrations, and
Anions at Constant Temperature 64
14. Plot of the Fraction of Scandium
Remaining on the Column Resin Versus
Iron in the Effluent for Different
Elution Conditions at T = TR 65
15. Plot of Ferric Chloride and Scandium
Concentrations Versus Effluent Volume 67 16. Elution of Barium With Ferric Chloride 69
17. Plot of Cesium and Ferric Sulfate/Chloride
Concentrations Versus Effluent Volume 71 18. Elution of Cesium for Varying Flow Rates,
Ferric Concentrations, and Anions at
Constant Temperature 72
19. Elution of Iodide Using Sodium Sulfate
as Elutriant 74
20. Iron Calibration Curve Using Ni-troso-R as
Colorimetric Agent 108
21. Thorium Calibration Curve Using Carminic
Acid as Colorimetric Agent 111
22. Thorium Calibration Curve
Using
ArsenazoIII as Colorimetric Agent 113
23. Calibration Curve for Iodide Titration
Using Sodium Thiosulfate 118
24. Calibration Curve for Sulfate Titration
Using Barium Chloride 120
25. Sodium Chloride Calibration Curve Using
SelectIon Electrodes 122
26. Expanded Sodium Chloride Calibration
-9-LIST OF TABLES
1. Distribution Coefficients of Metal Ions
on Dowex 50 x 8 Cation Exchange Resin
in HC1 Solution of Different Concentrations 27
2. Experimental Conditions Studied 35
3. Density and Hydration Number of Eluting
Agents 39
4. Physical Properties of the Resins 40
5. Variat'ion of ln((S11/3-AS 2 1/3-1)) for
Differ-ent Loadings of Thorium and 90% Elution 86
6. Radioactive Ions Used in Elution Example 89
7. Example Process Data 95
8. Best Experimental Elution Data 97
9. Summary of Elution Conditions 99
10. Thorium Elution Using Fe2(SO ) 3 as the
Eluting Agent at Co = 0.94N, W=1/4gpm/ft
Ambient Temperature, p1 = 1.5, Run 11 102
11. Cesium Elution Using FeC1 as the Eluting
Agent at Co = 0.13N, W=2gpm/ft2, Ambient
Temperature, pH = 1.5, Run 19 103
12. Iodide Elution Using Na2SO as the Eluting Agent at Co=0.18N, W=2gpm/ft2 , Ambient
-10-CHAPTER I INTRODUCTION
In water-cooled nuclear reactors, fission products, activated corrosion products, and impurities in the
makeup water constitute the radioactive burden of the primary coolant loop. It is desirable to reduce this contamination to a low level in order to prevent fouling of heat transfer surfaces, to facilitate maintenance,
and to minimize the effect of any leakage.
Since the concentrations of the contaminants in the coolant are low, substantial removal or concentration is difficult. In nuclear plants like Connecticut Yankee, cobalt-58 (-1) has been a particular problem. It is formed in an (n, p) reaction on nickel-58-bearing alloys and de-posited as crud throughout the coolant system. When the reactor was shutdown and depressurized for refueling in
April, 1969 (the purification system did not operate in
this condition), the crud resolubilized and the activity in the primary coolant rose to 0.4 Ci/ml., corresponding to a concentration of 1.28sl5 g/ml. Once repressurized, this contamination loaded the exchanger to a high level
of activity.
Synthetic ion exchange resins such as Dowex HCR-W, a strong acid cation exchanger, and Dowex SBR-P, a strong
-11-base anion exchanger, are used in mixed form for purifica-. tion of nuclear reactor water coolant streams. These mixed ion exchangers are very rarely utilized to full capacity; tht; determining factor being the radiation level outside the exchange column. In present day practice these resins are not regenerated but are shipped off-site for disposal.
Connecticut Yankee is an exception to this rule. Their resin has been stored on-site since it is too radioactive
for their resin shipping casks.
The prohibitively high cost of regeneration, the re-duced capacity due to radiation damage, and the desire of
the electric utility companies to minimize on-site chemical processing of radioactive material tend to maintain this practice. However the overall cost of disposal is high
and has essentially two components (2). First is the cost
of transporting the radioactive ion exchange resin plus
its shielding and second is the cost of the final disposition
of the radioactive waste.
Of the two costs, it is in the cost of transportation
that the utilities could most readily effect -cost reductions. As the major fraction of the cost is for shipping the
shielding, a means of reducing the shielding weight could
realize a savings.
One possible means of decreasing the shielding is to elute the radioactive ions from the resin. Evaporation of
-12-the solvent and shipment of -12-the dried, solid radioactive residue could be effective in reducing costs if the volume of residue requiring shielding during shipment was s;-stantially below that of the ion exchange resin, The resin would be essentially decontaminated and would thus require very little shielding during shipment for disposal,
Under the criterion that the volume of dry residue be substantially smaller than the volume of the exchanger,
the use as 'eluting agents of strong acids/bases or neutral
salts was investigated. Strong acids/bases were found to
be ineffective for the elution while the patent of John H,
Noble at Stone and Webster Engineering Co. (32) indicated
that neutral salts could effect a major reduction in residue volume.
The strong acids/bases case was evaluated using the data of Nelson, Maurase, and Kraus (_, 18, 812). Their work provided experimental data on the effect of acid
con-centration on elemental ion exchange distribution coefficients. This information combined with the chromatographic elution
Equation (4)
vyax =X(D+ ) (1)
vMax is the volume of eluting solution necessary for the appearance of the concentration maximum of the band in the effluent after passage through the column,
-13--X is the volume of the column,
D is the volumetric distribution coefficient,
is the void fraction of the column (usually
~ 4)
indicated that strong acids would not fulfill the require-ment of small residue volume relative to that of the resin.
A sample calculation will illustrate this., Barium will be used since it is representative of ions that are tightly bound to the exchanger. Using HC1 as the elutriant the concentration at which the barium distribution
coeffi-cient is'a minimum was chosen (Dmin = 9 at 6M HCl). Under
these conditions and a resin volume of 1000 cc (Dowex 50x4 capacity: 5.12 equivalents per kg dry hydrogen form resinj density: .29 kg/l in water), the volume of elutriant
re-quired for the complete elution of barium is
9,41 (56.4 gm-moles of HC1). Neutralization of the HC1
with NaOH and. evaporation of the solvent leaves a salt
residue with a volume of 1520 cc.
(56.4)
(M WNaC1)Tolume of Residue
P
NaC 1(2)
-14-M WNaCl is the salt's gm molecular weight,
58.5
gm/gm moleNaC1 is the salt's crystal density, 2.16 gm/cc
This volume is 1.5 times the volume of resin, and hence would not reduce the shielding at all. Therefore if the volume of dried eluting agent is to be less than that of
the ion exchanger, HC1 and strong acids in general are excluded as possible eluting agents. For strong base
quarternary ammonium anion resins, the selectivity coeffi-cients of the halogens relative to the hydroxyl ion are greater than one (4); therefore halogen-halogen
distribu-tion coefficients (6) provide the necessary informadistribu-tion for the same type calculation (Dmin (bromide to chloride)= 9 at 6.5 M LiC1). Using Equation (1), the complete elution of bromide would require 9.4 1 (61.1 gm-mole LiC1) for
1000 cc of anion resin (Dowex-l). Substituting the appro-priate values for LiCl in Equation (2) (I 101= 2.07 gm/cc; M WLiC1= 42.4), yields a dry residue volume of 1250 cc
again a value greater than the resin volume. If the hydroxyl ion had been used, this value for the volume would have
been even larger, thus eliminating strong bases as eluting agents.
The use of neutral salts offered the possibility of reducing the amount of elutriant needed. Since the treated exchanger is not required to be in its original form but
only to be free from radioactivity, elutingj ions with a high affinity for the resin phase would be preferred as
Jluting agent' in order to kzoop the amount of elutriant )
to a minimum. These neutral salts should be used in
acidic solutions to prevent the precipitation of metal hydroxides.
In-terms of conventional elution processes, there are many similarities between elution with hydrogen and with anothe'r cation. In an elution process using a neutral salt, the same procedural steps of backwashing, resin separation, and the like occur as if the elutriant were a strong acid or base.
The present study is concerned with only the elution step and how, once the neutral salt has been chosen, the operating conditions of salt concentration flow rate, and temperature affect the residual salt volume.
CHAPTER II
THEORY OF SELECTIVITY
In the development of any commercial process, experi-mental data provide a set of points which delimit an
operating range for that process. Extrapolation beyond
this range requires an understanding of the physical effects
related to the process. For the case of ion-exchange,
knowledge concerning the factors influencing the equilib-rium and, in turn, the selectivity is needed. If these are
understood, improvement in the effectiveness of the elution
by reducing the amount of elutriant required may be possible.
In the "equilibrium" case of elution, the ion exchanger
is in equilibrium with its contacting solution, The elution
of a resin under "equilibrium" conditlons represents the minimal amount of eluting agent required for the eluant, its concentration, and the temperature. However, operation
under equilibrium conditions requires an almost infinite
amount of time by having flow rates only a small increment
above zero in order to achieve a quasi-equilibrium state at every point in the column. As this is infeasible,
operation under "non-equilibrium" conditions is used and necessitates the use of a larger volume of elutriant.
-17-upon the eluant cin.centration and temperature, operating under different eluant conditions could change the amount
of elutriant needed.
For operation under different eluant conditions, a
quantitative calculation of the change in the amount of eluant necessary for elution could be made in the equilib-rium case relative to some eluant condition where the
amount of elutriant needed for elution is known. In the non-equilibrium case, this may or may not be possible and only the sign of the elutriant volume change may be
predicted.
Thus it is important to establish a physical under-standing of the effects influencing the exchange process since they will be useful in evaluating the experimental results. The ensuing presentation provides a physical picture of selectivity and describes the major effects influencing it for ion exchangers such as Dowex HCR-W or Dowex SBR-P in aqueous systems.
In setting up an expression for the exchange equilib-rium between ions A and B of charge a and b respectively
and of the same polarity, the resin phase is considered
to be a concentrated electrolyte solution
(),
6,2,
8).aBb+ Ia A- b +b A (3)
The bar indicates the resin phase. If the same standard
-18-states are chosen for the ions in the resin and the aqueous phases (unit activity coefficients in an infinitely dilute solution), the equilibrium expression is
(Oi) Ia(A ) jb 3/A (B) IS( )I bI (4) - K B/A B/A
(
[
y
repr'esent activitiesrepresent concentrations, moles/liter is the ion activity coefficient
KB/A is the selectivity coefficient
QB/A is the thermodynamic equilibrium constant
Rewriting Equation (4) in terms of equivalent frae-tions of the exchanging ion, B , results in Equation. (5)
after a suitable rearrangement of terms.
RX6 ' lal C R|b - jal [al - IbI
(1-RXB) tl (1isB ao - n t ran
R XB Is the equivalent fraction in the resin,
XB is the equivalent fraction in solution,
CR is the capacity of the resin, equivalent/liter resin,
C is the normality of the solution.
Equation (5) represents the relationship between the equiv-alent fractions of the exchanging ions in each phase in
terms of an "apparent" selectivity coefficient. This
"apparent" selectivity is composed of the activity coeffi-cients, the equilibrium constant, and the ratio of the ionic concentrations of the two phases to the b - a power. If the activity coefficients are grouped with the equilibrium constant, the effect of solution concentration
(nass action effect) can be shown (20). Since CR is a
fixed value determined ,by the resin chosen, the selectivity of the resin for the higher valence ion is shown to be
inversely proportional to the total equivalent concentration
in the solvent to the
Ib
- lal power. That is, ifis the higher valence ion, B would show an increasing
preference for the resin phase as the solution became more dilute. Conversely if the valence of B was the smaller,
the preference of B would increase with increasing
concen-tration of exchanging solution demonstrating the mass action effect.
In terms of the elution process, it is desirable to consider using a polyvalent ion as the eluting species in order to reduce the amount of neutral salt needed for the elution. As seen from mass action law, it is desirable to use a dilute solution when the ion to be eluted is of lower valence than the eluting ion and a concentrated
solu--20-.
tion of the eluted ion's valence is higher, In the case
where the eluting ion's valence is the same as that of
the e3dd ion, the selectivity of the resin is not
concen+.ration dependent and the amount of eluant required is also concentration independent,
The degree of exchange or the selectivity in Equation (4) depends upon the activity coefficients of the
ex-changing ions. In dilute solutions, the aqueous phase activity-co:efficient ratio tends to unity and the degree of exchange depends on the resin phase activity coeffi-cients.
Selectivity could be qualitatively predicted if the activity coefficients of the resin monomer species for A and B in the aqueous phase were known, However the
differences between an aqueous electrolyte solution and the resin phase would have to be takeni into consideration. The major differences are that one type of ion is fixed
on the resin matrix, that the hydrocarbon matrix itself disturbs the water structure inside the resin, and that the elastic properties of the hydrocarbon matrix affect the exchange process, Corrections for these differences are needed if the selectivity is to be predicted,
Various models, as described in Helfferich (5), have attempted to account for the major resin phase
-21-developed a qualitative description of the -on exchange selectivity process. They consider the different types
of possible interactions and estimate which effect pre-dominates and ho- their comparative importance shifts
under varying conditions. The important effects are
water-water, ion-water, ion-ion, and ion-resin matrix
interactions.
Water-Water
At room temperature, water molecules form
a highly-hydrogen-bonded network with strong
intermolecular forces. This tendency of water
molecules to bond to each other has two important
consequences. First, the water structure tends to reject any other species unless the other has hydrophilic groups or is charged, If the water
structure is disrupted, it can more readily accept a foreign species. This happens inside the resin
since the internal phase water is constricted by
the resin matrix and is unable to surround itself
with other water molecules,
At room temperature, a rater molecule is
hydrogen bonded, on the average, to three other
water molecules in a pseutotetrahedral structure
(2,
8), In the resin phase, however, the resirfs-22-.
molecules about thcmselves and the matrix confines the internal water to capillaries, or pools, where
at lecast one dimension is on the order of tens of
Angstroms. Therefore the resin phase is weaker in
its relection of large ions and molecules than the external water phase.
Second, the structure of water has a tendency to force large weakly hydrated ions together to share one cavity in the water structure. Thus the water structure forces an ion pairing between a
large ion and the resin, thereby yielding a selec-tivity which increases with increasing ion size.
Ion-Water
All ions have a tendency to attract and orient
dipolar water molecules about themselves. This hydration process spreads the charge on an ion over a larger volume and lowers the free energy of the
system. Highly hydrated ions tend to be small and
highly charged. These ions will be preferred in
the aqueous phase since their energy of hydration is lost when they are transferred to the resin phase. Larger, less hydrated ions such as cesium or potassium possess smaller amounts of hydration
energy which are also lost on entering the resin
-23-.
as scandium or thorium tend to push the less hy-drated ions into the resin phase in order to achieve maximux hydration in the aqueous phase (Z, .).
Ion-Ion
An ion can lower its electrostatic free energy by attracting ions of the opposite sign, This
cation-anion complexing can stabilize these ions in either phase. This effect becomes increasingly import'ant in concentrated solutions such as the resin phase where the effective dielectric constant is lower than in a dilute aqueous phase,
Ion-Resin Matrix
These interactions are the result of dispersion forces acting between large ions and the hydrocarbon matrix. These forces are usually small in comparison
to the other interactions discussed.
From these interactions, a qualitative description of selectivity can be -made. Selectivity is looked upon as the competitive solvating (by the aqueous colon, the resin fixed ion, and the water molecules in.each phase) of exchanging ions where the ion with the smaller solvation requirements is pushed into the phase with weaker solvating properties.
The resin's preferential uptake of higher valence ions in dilute aqueous solutions (Th> Sc)3> Ba+2> Cs+1 ) can
-24-be explained either by the Donnan potential (§2) or by
solvation needs (6, 'Z 8),
The Donnan potential is an importart factor in the
exchange process. It occurs because one of the ions is fixed in the resin phase and is unable to diffuse into the aqueous solution. Since the resin-phase is usually more concentrated (for example: Dowex HCR-W, a cation resin has a capacity of 2.0 equivalents per liter in the
sodium form and Dowex SBR-P, an anion resin, 1.3 equiva-lents per liter of resin in the chloride form) than the water phase, the resin's counterions (counterions are mobile ions with charges of the opposite sign of the
fixed charges in the resin matrix. Coions are mobile ions of the same charge) tend to diffuse out to minimize the concentration differences in both phases. Also, for this reason the aqueous coions tend to move toward the resin phase. However this condition disturbs the electro-neutrality of the two phases. A potential difference is formed at the water-resin interface which tends to repel coions and exclude them from the resin phase while at the same time attracting counterions. The magnitude of the water-resin interfacial potential deponds upon the
con-centration difference between the two phases. The greater the dilution, the greater the potential. Additionally, since the force of attraction is also -proportional to the
valence, higher valence ions are preferred by the resin
pha se.
If the solvating properties for each phase are
looked at, it is seen that the higher valence ions can
lower their free energy move by being in a concentrated
solution where the effective dielectric constant is
lower. Thus for a system with a dilute aqueous phase, the higher valence ions prefer the resin phase.
In order to simplify the description of the ion:-exchange selectivity process, in general only the be-havior of tracer ions is considered. In dilute solution, resin invasion by macroelectrolyte is small and
anion-cation interactions can usually be neglected. However
the effects of the ion-water and the water-water inter-actions are important.
The distribution coefficient
D = A /[A] (6)
is a useful quantity in tracer analysis. It is a measure
of how strongly an ion- is held by the resin. When
-- 26-tla/bj l/b DA la/bi A/B a~ /bl
)
B a/bI|1/b
/b ' - a/b| lA/B *-A NBis obtained. In dilute aqueous solutions, the aqueous phase activity-coefficient ratio is essentially constant, resin invasion is negligible, and the concentration in
the resin is effectively equal to the number of resin
sites per unit volume. Under these conditions the ratio
of the resin-phase activity coefficients is also a
con-stant and DA is proportional to B] -la/b
DA -_,]- ja/b
The distribution coefficient displays the properties
of the mass action effect in showing the relationship
between the concentration of the eluting ion, B, and
the valences of the two ions. In addition, comparison
of the distribution coefficients of two ions would
indicate the relative affinity for the resin these ions
would display and, in turn, the relative ease with which elution wrould occur.
Table 1 contains values of distribution coefficients for selected elements at different HC1 concentrations (4).
Table 1
Distribution Coefficients of Metal Ions on Dowex
50
x 8 Cation Exchange Resin in HC1 Solution of Different ConcentrationsMetal Ion Ba+2 A id HC1 Normality 0.1 7105 7105 -7 10 4 8200 9000 1130
1650
182 4700 1600 1510 Cr+3 Co+2 C +1 Sr +2 Ni+2cu2+
0.5 2480 590 318 225 73 72 44 217 7065
1.0 -2049 265 127 60.8 34.45 26.69 21.29 19.41 60.2 21.85 17.5 2.0 239 48 36 12.5 5.2 7.9 6.7 10.4 17.8 7.2 4.3 29 13.87 7.4 K+1 106-28-.
If anion selectivity is considered first, it is noted that the most common anions, excluding OH~ and F, do not
possess a primary hydration shell and hence do not have
strong ion-water interactions. As these interactions do occur, however, to some extent, the anions are able to interact more in the aqueous phase than in the resin phase leading to a situation where both exchanging anions prefer the aqueous phase. The smaller or more highly charged
anion will be able to push the larger anion into the
resin phase. Further, once there, the larger anions are pushed into a water-structure enforced ion pairing with the resin's quat'ernary groups.
For monatomic ions, the hydrati.on requirements are inversely correlated to ionic size so that fluoride, whose ionic size is 1.3A , has stronger interactions
with water than iodide, whose ionic size is 2.2A0 , and
will be preferred in the aqueous phase.
Considering dilute solution cation selectivity next,
there is a shift in the relative emphasis for the various
interactions, The monatomic cations of a specified charge are a great deal smaller than the corresponding anions
thus hydration plays a much larger role in the competition for the ions between the phases. Although the fixed resin ions is better able to interact as a solvating agent than the quaternary ammonium group of anion-exchange resins,
-29-the hydration shell of -29-the cation is not removed as it enters the resin. Hence the ion pairing, which occurs
in anion exchange, is prevented.
In concentrated solutions, the selectivity is deter-mined by the same interactions as in dilute solutions.
The predominate effect, however, is no longer the hydration of the ions, but the complexing of the Ion, by either the colon or the resin ion, and the partial destru'Ction of the water structure
(6,
, 8). Other effects such aselectro-lytic invasion of the resin due to the falling Donnan potential also occur but are, in general, secondary.
These are the factors which determine the selectivity. It is important to understand how experimental conditions can affect the selectivity and hence the amount of eluant required for elution.
-30-CHAPTER III
EXPERIMENTAL PROCEDURE
3.1
Eerimental AppaatusThe description of the experimental apparatus is divided into several sections. A flow diagram, Figure 1,
is provided to aid in visualizing the experimental
con-figuration.
3.1.1 Prre WaterSection
Tap water was distilled, collected, and stored in
commercial
5
gallon plastic water containers, Whenneeded, this water was pumped by a finger, or positive
action, pump through two Barnstead mixed resin ion
ex-change cartridges to a
5
gallon polyethylene bottlelocated about 10 feet above the laboratory floor.
The deionized water leaving the cartridges had an
electrical resistance greater than 2 megohms-cm as
measured by a Solu Conductivity Bridge, This deionized
water was used either as a -wash liquid for the resin or
for analytical purposes. Gravity provided the driving
force for flow.
3.1.2 Elutriant Mixing and Storge
The solution used for elution was prepared in a
-32-polyethylene bottle' also 10 feet above the laboratory
floor. Excess fluid was returncd by a tube to the
mixing tank to assure a constant head was maintained. 3.1.3 Column
Initially, a pyrex column was used during the sodium
chloride elution experiments, However, to reduce the
hazard of breakage, a plastic column of the same
dimen-sions was used for all subsequent runs. The resin column
length was 30.0 inches, the diameter was 7/8 inches, and the volumes were 298 cc and 304 cc for the pyrex and
plastic columns respectively.
The resin was supported on a glass wool plug. During
resin loading, the column was shaken and deionized water
flowed down through the column until the settled resin height was 30.0 + 1/4 inches.
During the 75 C elevated temperature runs, heating
tapes were wrapped around the resin section and the liquid
section above the resin. The heated section above the resin was used to preheat the incoming liquid to the
desired operating temperature while the resin section
was heated to maintain a constant temperature (+ 3 0) along the length of the column. The temperature measure-ments were made with thermometers located at both ends of the resin section.
3.1.4 Flow Measurement
The flow was measured by the length of time needed
to collect a known effluent volume. A 25 ml burette at
the column exit and a timcr facilitated the flow rate
meas-urement.. The burette also served as a holding tank while volumetric flasks, used to collect the effluent,
were changed. The flow stability was + 10% in the range
1/4 - 2 gpm/ft 2 3.2 Proced'ure
As only monobed (one resin type) experiments were
performed to avoid the necessity of any elution of metal
ion-macroelectrolyte anion complexes, the resin in either
the sodium or chloride form was placed in the column,
The column was vibrated during resin loading and washing
to promote settling of the resin phase until a constant
height of 30 inches was achieved. Using dilute solutions
of the test ions (0.24N), the resin was "trace loaded" (approximately 1 %) and then washed with deionized water.
The wash effluent was collected and analyzed for any test
ion leakage. Following this, the elutuant was fed into
the column at a predetermined flow rate, When the
inter-face between the descending elutriant and the wash water
came in contact with the exchange resin, collection of
the effluent was initiated, These effluent samples were
later analyzed for the counterion plus the test ion(s)
3.3
VariablesTable 2 is a summary of the experimental parameters
and the range over which they were varied. Initially
pH was also investigated but, since many higher valence
metal ions such as thorium, ferric iron, bismuth, aluminum, and zirconium form insoluble hydroxides in slightly acidic
(pH
>4)
solutions, it was decided to use a pH thatwas sufficiently low to prevent hydrolysis of most ions (pH 1.5).
3.4
Selection of Test Ions 3.4.1 Test IonsA specific .ion in each valence grouping was selected
as a test ion. This was done primarily on the basis of the equilibrium data of Nelson, Maurase, and Kraus
(18, _) for ion exchange of elemental ions in H1C1 and
HC1O4 solutions. The test ions chosen were cesium (+1), barium (+2), scandium (+3), thorium (+4), and iodide (-1),
3.4.2 Selection-Criteria
To represent each valence group, the ion selected was the most tightly held by an exchanger. Because these ions were the most tightly held, they provided "boundary" conditions for each valence group.
If ions, other than the test ions, were present on an exchanger to be processed, the amount of eluant re-quired would then be less.
-35-Table 2
Experimental Conditions Studied
VARiIABLE Test Ions Elution Agents Elutriant Concentration Flow Rates Temperature RANGE
Valences: -1 to +4; ions: iodide, cesium, barium, scandium, and thorium
Ferric chloride, ferric sulfate, sodium chloride, and sodium
sulfate
0.13 - 1,97N 1/4 - 2 gpm/ft2
Room temperature and 750c
1.5 pTH
-36-The elution of the test ion defines the maximal amount of elutriant needed for complete elution of its
valence group. This also explains why these ions were
chosen over ions, such as cobalt-58, which are of interest to designers of radioactive waste disposal systems.
3.4.3 Importance of Thorium Selection
In the tetravalence group, thorium was chosen as the test ion and was of particular interest for two reasons. First, thorium is the most tightly held cation, regardless of valence group, on strong-acid type cation exchange
resins. Since thorium is more tightly held than other
elements like uranium DTh > 105 and DU > 102 at 0.5M HCi
(18)
],
which will be found on the reactor's exchange resin, the elution of thorium provides an indication of the maxi-mum amount of elutriant needed for complete elution ofthe resin.
Secondly, thorium has an extremely low diffusion coeffi-cient in' the resin phase 2.15 - 1010 em2 -seol at
250C for Dowex 50x8 (21) , Hence diffusion kinetics play
an extremely important role in the elution of thorium. Other
monatomic cations have diffusioh coefficients which are, in
general, larger than that of thorium (2, 2 3).
Due to these two factors, the elution of thorium presents more difficulties thaft that of other ions. For a specific set of operating conditions, thorium will
pro-
-37-vide either kinetic and/or equilibrium limitations on
the elution more severe than on other ions. Thus, the
elution of thorium could be called the "worst possible case" since it would require the maximal amount of eluant for a specific set of operating conditions.
3.5
Neutral Salts As Eluting Agents 3.5.1 Selection of ElutriantsThe initial criteria for selection of the eluting salt to be studied were availability, ease of handling, economy,
and high density. Sodium chloride was the first
investi-gated.
The ineffectiveness of sodium chloride as an eluting
agent (see Discussion of Results, Th.orium) caused additional criteria to be added to the initial criteria. These were
that the eluting cation possess a high affinity for the
resin, which can be measured by its distribution codificient
for hydrogen, the eluting anion possibly complexes cations
thus aiding the cation resin elution, and that the eluting
anion have a strong affinity for the anion resin (to elim-inate a possible multisalt process).
Under these criteria, ferric salts were selected for further investigation. The ferric ion had an additional advantage. It possesses a low distribution coefficient
(< 1) for the cation resin in 3 - 4 M HC1 solutions due
-38-be removed if the cation resin were to -38-be reused.
Both ferric chloride and ferric sulfate were
investi-gated. The advantages of using ferric sulfate over ferric chloride in a commercial process were several; the salt would be easier to process than the chloride (ferric
sul-fate would have a lower vapor pressure and would be less corrosive than ferric chloride) and the sulfate ion would
complex the higher valence cations more effectively (12,
2Z).
However several metals, primarily the alkalineearths -form a precipitate with sulfate, The literature
(13)
indicated that the elution difficulties engenderedby this precipitation could be alleviated by careful choice
of the elutriant concentration and the flow rate.
Experi-mentally, the precipitation problem did occur for barium and ferric chloride was used with better resultS,
Ferric salts were unsuitable for use in the anionic
resin elution, The ferric ion oxidizes the iodide which deposits in the resin as iodine.
2 Fe+3 + 21 2Fe+2 + 12
Alkali metal salts were investigated for the iodide elution. Of the common anions, sulfate has the highest preference for the strong base anion resin phase. Sodium sulfate was used as the anionic eluting agent.
-39-3.5.2 Physical Properties of Eluting_ Agents
Table 3 lists the physical properties (24, _5, 26)
that will be useful in the evaluation of the eluting agent effectiveness. These selected properties are the salt form after the solvent has been evaporated and the crystal density at ambient conditions.
3.6 Resin
3.6.1 Resin Properties
The re'sins used in the experiment were Dowex HCR-W and Dowex SBR-P. The physical properties (14, _1) of
each are listed in Table 4.
3.6.2
Resin FormIt was decided to study the elution characteristics of the exchange resins (either the cation exchange
Dowex HCR-W or the anion exchanger Dowex SBR-P), when
they were initially in the sodium or chloride form respec-tively.
3.6.3 Resin Form Justification
As part of the water purification system in water-cooled nuclear reactors, ion exchangers are used in either the hydrogen or alkali m&tal form for the cation exchanger and in the hydroxyl form for the anion resin. The resins are not exhausted prior to removal from the
coolant system, they are still primarily in these forms. Use of resins in these forms or in forms where the main
Table 3
Density and Hydration Number of Elution Agents
Hydration Number at 1000C 0 0 0 Crystal Density at 250C of 1000C Form 2.16 2.7 2.9 2.7 Salt NaC 1 Na FeC1 3 MOM NO" I X 0 1 F e2 (SOO ) -' 2
Table 4
Physical Properties of the Resin
Property/Resin
Type
Crosslinking (M)
Specific Gravity
Capacity
(meq./ml. wet resin)
Dowex HCR-W strong acid cation
8
1.28 (Na form)
2.0 (Na form)
Dowex SBR-P
strong base anion
'not defined 1.07 (C1 form) 1.3 (Cl form) Void Volume gal/ft3 Maximum Operating Temperature (OF) Effective pH range Sphericity (M) Minimum Standard Mesh Size (wet) Pressure Drop
(psi/ft of resin depth W=20gpm/ft 2 , T=750F)
3
3
140 (oH form) 300 (Cl form) 300 0-1495
20 - 40 90 16 - 40 1components distribution coefficient is not too different
from the reactor form utilized allows a "practical process"
problem to be modelled. As exchangers in the sodium or chloride form fulfill this requirement, it was decided to use the resins in these forms, as supplied by the
manu-facturer.
3.6.4 Resin Loading
In every elution run, six milliequivalents of a test ion were loaded on the column. This corresponded to a loading of 1% for the cation resin and 1.5% for the anion resin, each column having a volume of about 300 cc. Trace
loading was used for two reasons, First, it modellod the
true situation in reactor resins and. second the diffusion
of the trace ion is reported to be the rate-controlling
step (10, 11). This latter effect can be seen, if it
is realized that in a trace component system the individual diffusion coefficients, the activity coefficients, the
degree of swelling, etc. remain practically constant and
the coupled diffusion constant, TAB, is effectively that of the trace component (22).
The elution of thorium and iodine was run separately while the cesium, barium and scandium runs were done
simu-ltaneously.
3.6.5 Loadingr Distribution
The test ions were loaded in a band at the top of
-43-CHAPTER IV
DISCUSSION OF RESULTS
A summary of elution conditions plus typical elution
data can be found in Appendix A. Several of the graphs
have "equivalents of iron" as an abscissa, if "bed
equi-valents of iron" is desired instead, the abscissa value should be divided by 0.6 since each cation resin bed had a capacity of 0.6 equivalents of exchange capacity.
It should be noted. that the differential elution
curves were plotted starting with the first effluent sample which contained either eluting agent or test ion.
4.1 Thorium
The elution of thorium was studied as a function of
the flow rate and the concentration of the eluting agent. Figure 2 is an example of thorium elution as a function of effluent volume and exhibits behaviour characteristic
of the thorium-ferric sulfate system which is the
appear-ance of thorium prior to the breakthrough of iron. Also exhibited is an exponential decrease of the effluent's thorium content as a function of solution volume (or
amount of iron) after the iron concentration in the effluent
equals that of the inlet.
4O Th----Fe W I gpm/ft.-C= 0. 936N F-T TROOM N\ 20- --. --C~2 0000030 0050 VOLUE O EFFUEN ( ii7tr 2000 30000 VOLUMIE OF EFFLUENT (milliliters)
2 Plot of ferric sulfate and thorium concentrations versus effluent volume.
/Co
= .97 N W= 1/2 gpm/ftz T =TROOM 20 40 60 80 100 120 IRON (grams)-46-EQUIVALENTS OF IRON 4 20 4'0 60 80 100 121 -IRON (grams)
Figure 4 Plot of the effect of flow rate on thorium elution by ferric sulfate
EOUIVALENTS OF IRON 4
6 2O 40 60 80 (00 f2o
IRON IN ELUTRIANT
(gramrs)
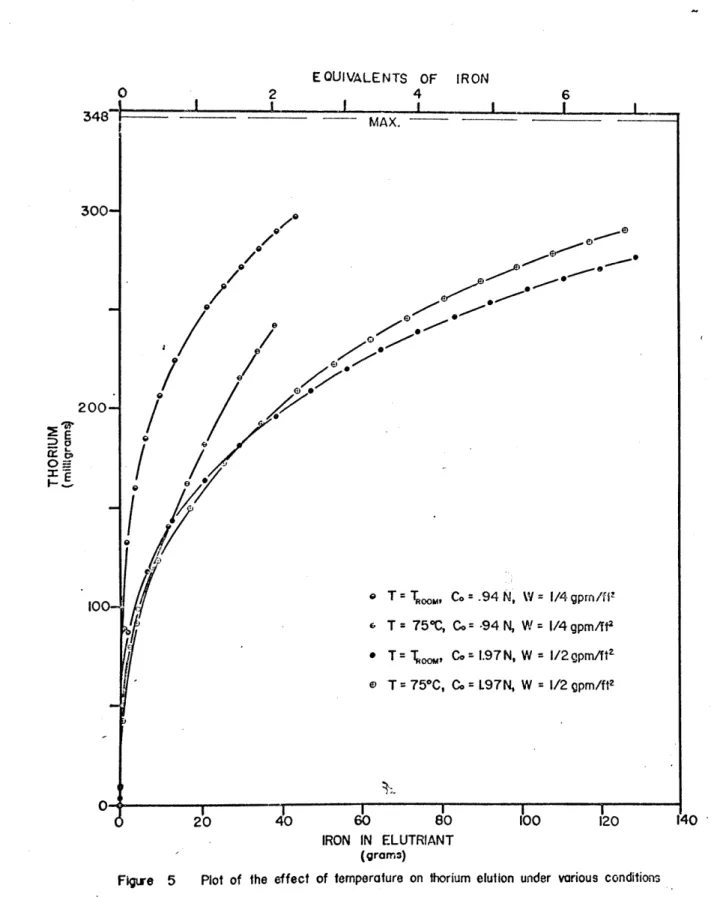
Figure 5 Plot of the effect of temperature on thorium elution under various conditions
I-M-
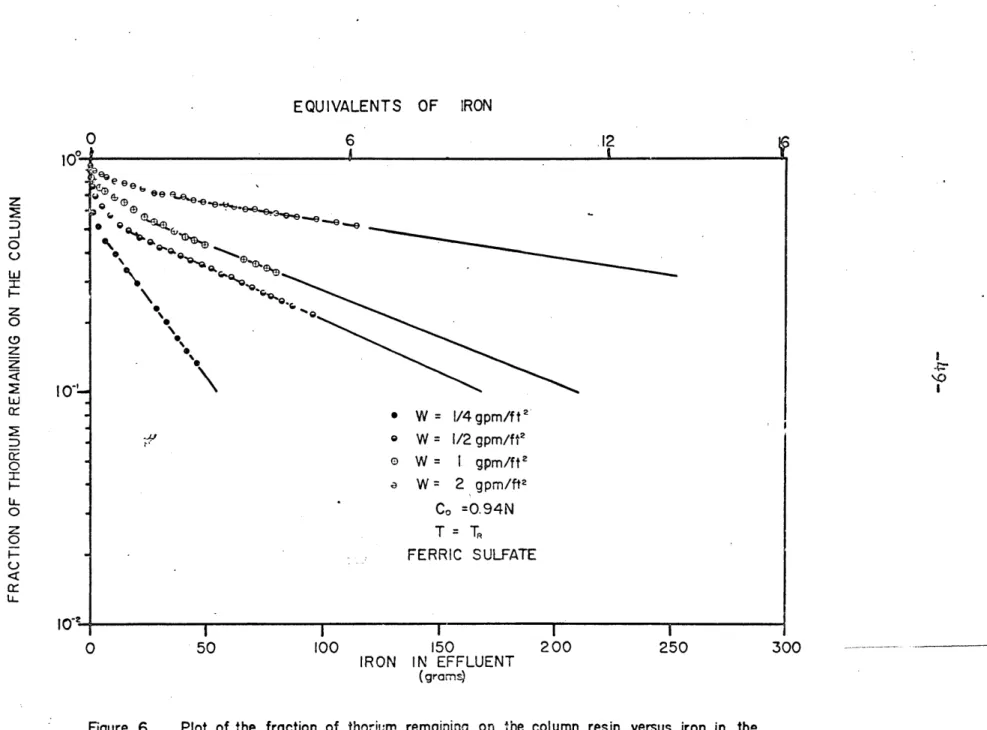
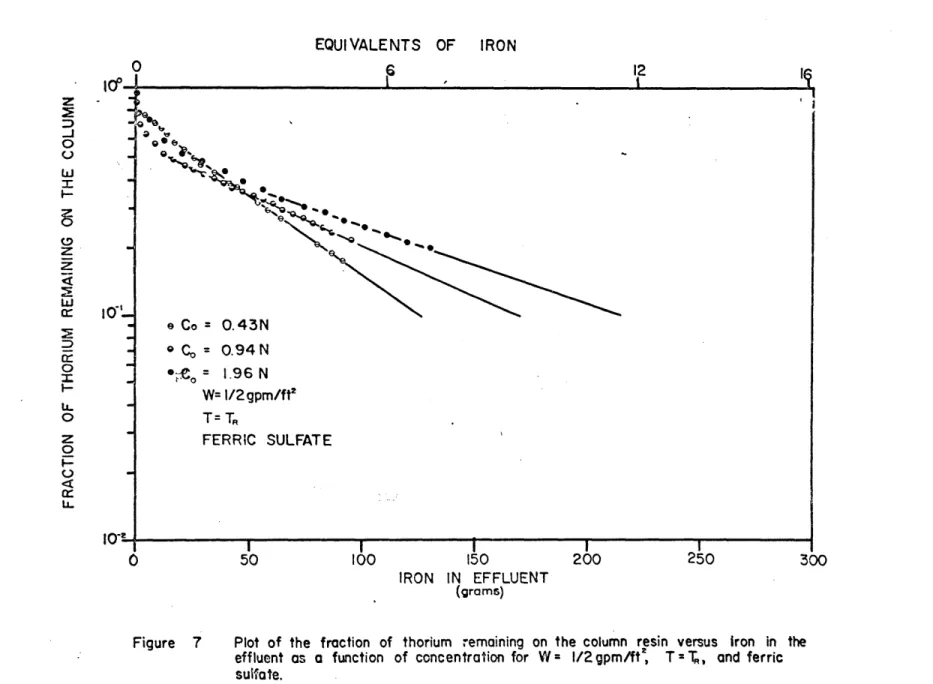
-48-eluted from a constant loading of 1% as a function of the amount of iron in the effluent. Figures 6, 7, and 8 plot the same data but in the form of the fraction of thorium remaining on the column instead of thorium eluted. The parameters varied are flow rate, concentration, and temperature.
In'Figures 6 through 8, after the iron concentration of the effluent equals that of the inlet, the thorium data lies on straight lines, with slopes(L, as if the elution were occurring in a well-stirred flow system instead of being eluted in a band as it was loaded.
Initially the slope of these curves changes very rapidly; this transient is probably.due to the high free
sulfate concentration which is present from the resin's absorption of the ferric ion. At the column inlet, the
free sulfate is only about 1/3 of the total sulfate in solution, with the'remainder complexing the iron (12).
Fe+3 + so4 -2 FeSO + K2 5 00 = 104 (10)
As the solution procedes down the column, the iron is exchanged for the sodium and thorium on the resin, The free sulfate concentration increases (sodium does not form complexes with sulfate) and drives the thorium complexing
EQUIVALENTS OF IRON O 6 12 100 -eee e 0 00 0 \ 0 4--z 0\) X W= 1/4 gpm/f t P e W = 1/2 gpm/ft' 0 0 W = I gpm/ft2 W = 2 gpm/ft2 LL o0Co =0.94N z T= T 0 0 50 100 150 200 250 300 IRON IN EFFLUENT (grams)
Figure 6 Plot of the fraction of thorium remaining on the column resin versus iron in the effluent as a function of flow rate for C0 =0.94N, T= TFt, and ferric sulfate.
-EQUIVALENTS OF IRON
IRON IN EFFLUENT
(grams)
Figure 7 Plot of the fraction of thorium remaining on the column resin versus Iron in the
effluent as a function of concentration for W = 1/2 gpm/ft , T = T, and ferric
sulfate. z 0 w 73 z w 0 U-0 z 0r U. a
EQUIVALENTS OF IRON
300
Figure 8 Plot of the fraction of thorium remaining on the column resin versus iron in the effluent at T = 75*C. for differeni flow rates and ferric sulfate concentrations. 10*-'0-. tO-0 50 100 150 200 250 IRON IN EFFLUENT (grams) I
T1h +4+ 20-2 ::, Th(SO )2 K2 5 0
C
1056()further to the right formation of anionic complexes can also occur (27) . If the amount of thorium complex-ing increases, the uncomplexed thorium concentration in solution drops. It is this uncomplexed concentration
which enters into the equilibrium expression, Equation (4), and into the rate expression
(n - ) (12)
n is the non-equilibrium concentration of exchangeable ion, i, in solution; mequivalents per unit column
length
Ni is the corresponding non-equilibrium concentration
in the resin, unit as n
t is time
is the effective rate constant for sorption of the exchanging ions, and
ni is the equilibrium concentration of the ion in solution
for the diffusion of thorium frm the resin. Decreasing the uncomplexed concentration causes the driving forces for mass transfer (and consequently its rate) to increase. This increased rate of mass transfer combined with the varying free sulfate concentration present in the initial
-53-in the beg-53-inn-53-ing of each elution with ferric sulfate.
The low diffusion coefficient of thorium in the resin
phase tends to support this kinetics-limited view since_. long contact timcos would be required for equilibrium to
be closely approached. However it is the variation in the effective use of the iron, for a constant iron con-centration, as a function ol flow rate, see Figure 4 or
6, which shows conclusively that the elution of thorium
is kinetic 'and not equilibrium controlled.
Figure 6 is a plot of the fraction of thorium left on the column versus iron in the effluent for a constant
iron concentration. It shows the dramatic decrease in
the amount of iron needed for elution when slow flow
rates are used. Slow flow rates permit a longer contact
time between the two phases and hence allow a closer
approach to equilibrium. However there is a flow rate
below which the effective use of the iron will only
marginally improve the elution due to the close approach to equilibrium. This limiting flow rate was not deter-mined and it might be the objective of some future research
or obtained from engineering pe6formance data.
The effect of temperature on the elution was studied,
Figures 5 and 8. It was expected that an elevated
tempera-ture would increase the diffusional rate and offer better utilization of iron through a closer approach to equilibrium.
- 54-.
The equilibrium constant for ion exchange is known not to have a strong temperature dependence (28). Thus it was expected that the thorium elution curve for elevated temperatures would be above that at ambient temperatures, all other parameters being the same. However this did not occur, see Figure
5.
Instead the initial portion of the elevated temperature runs were below those at ambient temperatures indicating thorium was more rapidly eluted at ambient 'temperatures than at 750C. As the elutioncurvescontinued, however, the 750C runs either cross or are about to cross the corresponding room temperature elution curves.
It is felt that the probable explanation to this "crossover" behaviour, although it was not proven, was
a strong temperature dependence of the complexing equilibria, Equation (11). If the equilibrium co'nstant for complex
formation is significantly decreased, the initial elution efficiency or iron utilization will be greatly decreased.
As the effluent iron approaches that of the inlet, the diffusional rate increase will begin to predominate. This increased rate of mass transfer will eventually cause the crossover of the higher temperature run over that at
ambient temperatures. Increasing the elutriant concentra-tion would be expected to cause a reducconcentra-tion in the magni-tude of the temperature effect. This would be due to the
-55-larger value for the free sulfate concentration which would tend to increase complexing. This is demonstrated
in the two sets of runs in Figure 5 where the difference
between the elevated and the room temperature runs at high inlet concentrations is smaller than those made at lower concentrations.
Figure 9 plots the slopes, a , for the linear por-tion of the elupor-tion curves in Figures 6 and 7 as a
function of' flow rate and concentration. a is a measure of the mass transfer coefficient, 6 , and the distribution coefficient, DTh. It is a measure of the rate at which thorium is transferred -from the resin phase to that of the solution, Equation (12). Inspection of the values of a shown in Figure 9, for a constant
iron concentration (0.94N), shows a 9 fold variation in a for an 8 fold variation in flow rite (1/4 - 2 gpm/ft
).
If thorium is eluted at a rate proportional to the amount present on the resin, .the variation in a would be 8 fold in going from 2 to 1/4 gpm/ft2 since the iron in the
effluent per unit time is proportional to the flow rate. The experimental value for the 16L variation is in good agreement with this idea.
The variation of a for different iron concentrations and constant flow rate can be explained this way also, since the amount of iron through the column per unit time is proportional to concentration. A 2.1 variation in corresponds to a 4.5 variation in concentration. This
FLOW RATES (gpm/ft2) 10*0 100 10' 0 e 10' FERRIC SULFATE COt\CENTRATION (normality)
Plots of thorium elution slopes versus iron concentrations and flow Tates.
-56-10-1 I 1 . 10 .u z 0 w Q::c(n a-0 r>~~' U)5 0 e * Co=.94N * W 1/2 gpm/f 2 T = T 10L 10 I0' Figure 9 . . . .. 3
.
I -103-57-apparent discrepancy is explained by considering the mass action e.fect for the uncomplexed iron in addition to the amount of iron in the effluent per unit time. Varying
the concentration will affect the mass transfer coefficient,
/2
, slightly; however the equilibrium concentration of thorium in solution, nh, will be affected due to the mass action effect. All other conditions remaining constant, a 4.5 variation in eluant concentration (this corresponds to a 1.7 variation in the uncomplexed iron concentration Equation (10).+104 (10a)
e3 SO 2
j
[d-yJ[e-ywhere
y = molar concentration of the iron .complex, m,/l/ d the total iron molar concentration m./1.
e total sulfate molar concentration, m./1.
F or an eluant concentration of 0.43 N and 1.97 N, the uncomplexed iron concentrations are 0.012M and 0.02M
respectively.) will cause a 2.0 variation in nh and the mass transfer rate. Dividing the 4.5 variation in concentration (or iron through the colvmn per unit time) by the 2.0 variation in the mass transfer rate leads to an expected variation in a of 2.25 which again is in
-58-The linear dependence of a on concentration and flow rate indicates that there is not a close approach to
equilibrium for the conditions studied. This is indicated since it appears that the driving force in the mass transfer relation, Equation (12), is primarily the equilibrium con-centration of thorium in solution,
rh.
It is assumedthat particle diffusion is rate-controlling in this elution, the half-time of the exchange reaction can be approximated in an infinite solution from a knowledge of the resin bead's radius 'and the internal diffusion coefficient in the resin
(22).
r2
= 0.030 - (13)
D
Thus the rate of exchange is proportional to the diffusion coefficient, D, in the exchanger and inversely proportional to the square of the bead radius, For thorium this
corres-ponds to a half-life of about 100 hours. If the flow rate were adjusted such that the residence time of the elutriant in a 3 ft resin section was equal to this, a flow rate of
2-about 0.001 gpm/ft would be required. However, since axial diffusion at this low flow rate plays a major role and since most metal ions have diffusion coefficients larger than
thorium, a flow rate of 0.01 gpm/ft2 is recommended for a.
-59-Experimentally the best operating condition for the elution of thorium using ferric sulfate as eluate was at Co
=94N,
W = 1/4 gpm/ft 2, and T = TROOM. For a 90%removal of thorium, see Figure 6, from the column, 54 grams of iron would be in the effluent. This corresponds to a
Fe2 (SO 4 ) 3 - 2H20 residual salt volume of 78 cc or 25.6%
of the cation resin volume. Since 600 mequivalents of iron were exchanged for sodium in the first part of the elution, the total amount of iron used in the elution was 65.1 grams. This corresponds to an inlet solution volume
of 12.4 cubic feet of solution per cubic foot of cation exchanger.
- Improvement on this elution per-formance can be made
using an extremely low flow rate (such as .01 gpm/ft2 )
ambient temperature, and an eluant concentration greater than 1N. (Increasing the concentration above 1N would involve the possibility of even further reductions in flow rate),
Figure 10 is a check on the reproducibility of the
data under identical operating conditions (C=0.94N, W=1/4
2
gpm/ft2). As can be seen, the agreement between the data
of the two runs is good.
The elution of thorium by sodium chloride was
extreme-ly inefficient. Figure 11 is the case where the entire
-60-EQUIVALENTS OF IRON
IRON IN EFFLUENT
(grams)
Figure 10 Plot demonstrating experimental reproducibility
E
%..W
0
I-2.5 2.0-
1.5-t
20 S1.0- 0.5- 0.0-/ / A / -/ A / W= 1/2 gpm/ftt C Lt4N . T =TR '7 7 77 A. 7' / / 77 * / / 7 / 7 / 2 3 4 VOLUME OF EFFLUENT (liters) / A. // ''A / /Figure it Elution of thorium from an initially competely loaded resin using sodium chloride as elutriant
7
-z
// / - '1 / 'A .71 K x/ // / A' /K7
K
/ / / / /-z
K
K
7Z / / / / / /, A / 7 7/
-4
K
/ / // -2.0 w -10 00 -10 o A 7 7 / I' I-I 7/ 7//
/ / C' 02
5 6 f I TM. No
-62-reasons
)
prior to elution. For 300 cc of dry sodium chloride, which equals one column volume of resin, only28% of the thorium was eluted. Since the siistribution
coefficient of a component decreases with increasing loading of that component (29, )Q), a greater fraction of the thorium was eluted for the saturated loading than if the thorium had been a trace component.
4.2 Scandium
With f'erric sulfate as the eluting agent, scandium follows the same general elution behaviour, Figure 12, as thorium, Figure 2. In this graph the fractions of scandium eluted per unit volume and iron concentration in the effluent are plotted versus the volume of effluent leaving the column. As with thorium, 6 mequivalents of scandium was loaded onto
the -resin.
Figures 13 ani 14 contain the scandium elution data. Figure 13 relates the total amount of scandium eluted while Figure 14 the fraction scandium remaining on the resin as a function of iron in the effluent for different flow rates, concentrations, and eluting agents.
In these two figures, one curve (eluting agent:
Fe2(SO 4 ) 3 ; Co = .36N; W= lgpm/ft ) shows a sharp discon-tinuity. Experimentally, the break was initiated by a
partial flow bloc1mge which was discovered and eliminated after one sample volume. However, for unknown reasons