HAL Id: hal-01182782
https://hal.inria.fr/hal-01182782
Submitted on 3 Aug 2015
HAL is a multi-disciplinary open access
archive for the deposit and dissemination of
sci-entific research documents, whether they are
pub-lished or not. The documents may come from
teaching and research institutions in France or
abroad, or from public or private research centers.
L’archive ouverte pluridisciplinaire HAL, est
destinée au dépôt et à la diffusion de documents
scientifiques de niveau recherche, publiés ou non,
émanant des établissements d’enseignement et de
recherche français ou étrangers, des laboratoires
publics ou privés.
LifeCLEF 2015: Multimedia Life Species Identification
Challenges
Alexis Joly, Hervé Goëau, Hervé Glotin, Concetto Spampinato, Pierre Bonnet,
Willem-Pier Vellinga, Robert Planqué, Andreas Rauber, Simone Palazzo, Bob
Fisher, et al.
To cite this version:
Alexis Joly, Hervé Goëau, Hervé Glotin, Concetto Spampinato, Pierre Bonnet, et al.. LifeCLEF
2015: Multimedia Life Species Identification Challenges. CLEF: Cross-Language Evaluation Forum,
Université de Toulouse. FRA., Sep 2015, Toulouse, France. pp.462-483,
�10.1007/978-3-319-24027-5_46�. �hal-01182782�
LifeCLEF 2015: Multimedia Life Species
Identification Challenges
Alexis Joly1, Herv´e Go¨eau2, Herv´e Glotin3, Concetto Spampinato4, Pierre
Bonnet5, Willem-Pier Vellinga6, Robert Planqu´e6, Andreas Rauber7, Simone
Palazzo4, Bob Fisher8, Henning M¨uller9
1 Inria, LIRMM, Montpellier, France 2
Inria, France
3 IUF & Univ. de Toulon, France 4
University of Catania, Italy
5 CIRAD-Amap, France 6
Xeno-canto foundation, The Netherlands
7
Vienna Univ. of Tech., Austria
8 Univ. of Edinburgh, UK 9
HES-SO, Sierre, Switzerland
Abstract. Using multimedia identification tools is considered as one of the most promising solutions to help bridging the taxonomic gap and build accurate knowledge of the identity, the geographic distribution and the evolution of living species. Large and structured communities of na-ture observers (e.g. eBird, Xeno-canto, Tela Botanica, etc.) as well as big monitoring equipments have actually started to produce outstand-ing collections of multimedia records. Unfortunately, the performance of the state-of-the-art analysis techniques on such data is still not well understood and is far from reaching the real world’s requirements. The LifeCLEF lab proposes to evaluate these challenges around 3 tasks re-lated to multimedia information retrieval and fine-grained classification problems in 3 living worlds. Each task is based on large and real-world data and the measured challenges are defined in collaboration with biol-ogists and environmental stakeholders in order to reflect realistic usage scenarios. This paper presents more particularly the 2015 edition of Life-CLEF. For each of the three tasks, we report the methodology and the data sets as well as the raw results and the main outcomes.
1
LifeCLEF lab overview
1.1 Motivations
Building accurate knowledge of the identity, the geographic distribution and the evolution of living species is essential for a sustainable development of humanity as well as for biodiversity conservation. Unfortunately, such basic information is often only partially available for professional stakeholders, teachers, scientists and citizens, and more often incomplete for ecosystems that possess the highest diversity, such as tropical regions. A noticeable cause and consequence of this
sparse knowledge is that identifying living plants or animals is usually impos-sible for the general public, and often a difficult task for professionals, such as farmers, fish farmers or foresters, and even also for the naturalists and special-ists themselves. This taxonomic gap [57] was actually identified as one of the main ecological challenges to be solved during Rio’s United Nations Conference in 1992.
In this context, using multimedia identification tools is considered as one of the most promising solutions to help bridge the taxonomic gap [18,37,9,54] [50,1,53,30,17]. With the recent advances in digital devices, network bandwidth and information storage capacities, the collection and production of multimedia data has indeed become an easy task. In parallel, the emergence of citizen sci-ence and social networking tools has fostered the creation of large and structured communities of nature observers (e.g. eBird10, Xeno-canto11, Tela Botanica12,
etc.) that have started to produce outstanding collections of multimedia records. Unfortunately, the performance of the state-of-the-art multimedia analysis tech-niques on such data is still not well understood and is far from reaching the real world’s requirements in terms of identification tools [30]. Most existing studies or available tools typically identify a few tens or hundreds of species with mod-erate accuracy whereas they should be scaled-up to take one, two or three orders of magnitude more, in terms of number of species (the total number of living species on earth is estimated to be around 10K for birds, 30K for fish, 300K for flowering plants (cf. The Plant list13) and more than 1.2M for invertebrates [5].
1.2 Evaluated Tasks
The LifeCLEF lab14originally evaluated these challenges in the continuity of the
image-based plant identification task [31] that was run within the ImageCLEF labs15 [43] during the last three years with an increasing number of
partici-pants. It recently however radically enlarged the evaluated challenge towards multimodal data by (i) considering birds and fish in addition to plants, (ii) considering audio and video content in addition to images, and (iii) scaling-up the evaluation data to hundreds of thousands of life media records and
thou-10 http://ebird.org/ 11http://www.xeno-canto.org/ 12 http://www.tela-botanica.org/ 13http://www.theplantlist.org/ 14 http://www.lifeclef.org/ 15 http://www.imageclef.org//
sands of living species. More concretely, the lab is organized around three tasks:
PlantCLEF: an image-based plant identification task
BirdCLEF: an audio-based bird identification task
FishCLEF: a video-based fish identification task
As described in more detail in the following sections, each task is based on big and real-world data and the measured challenges are defined in collaboration with biologists and environmental stakeholders so as to reflect realistic usage scenarios. For this year, the three tasks are mainly concerned with species iden-tification, i.e., helping users to retrieve the taxonomic name of an observed living plant or animal. Taxonomic names are actually the primary key to organize life species and to access all available information about them either on the web, or in herbariums, in scientific literature, books or magazines, etc. Identifying the taxon observed in a given multimedia record and aligning its name with a taxo-nomic reference is therefore a key step before any other indexing or information retrieval task. More focused or complex challenges (such as detecting species duplicates or ambiguous species) could be evaluated in coming years.
The three tasks are primarily focused on content-based approaches (i.e. on the automatic analyses of the audio and visual signals) rather than on interactive information retrieval approaches involving textual or graphical morphological attributes. The content-based approach to life species identification has several advantages. It is first intrinsically language-independent and solves many of the multi-lingual challenges related to the use of classical text-based morphological keys that are strongly language dependent and understandable only by few ex-perts in the world. Furthermore, an expert of one region or a specific taxonomic group does not necessarily know the vocabulary dedicated to another group of living organisms. A content-based approach can then be much more easily gen-eralizable to new flora or fauna contrary to knowledge-based approaches that require building complex models manually (ontologies with rich descriptions, graphical illustrations of morphological attributes, etc.). On the other hand, the LifeCLEF lab is inherently cross-modal through the presence of contextual and social data associated to the visual and audio content. This includes geo-tags or location names, time information, author names, collaborative ratings or com-ments, vernacular names (common names of plants or animals), organ or picture type tags, etc. The rules regarding the use of these meta-data in the evaluated identification methods will be specified in the description of each task. Overall, these rules are always designed so as to reflect real possible usage scenarios while offering the largest diversity in the affordable approaches.
1.3 Main contributions
The main outcomes of LifeCLEF evaluation campaigns are the following: – give a snapshot of the performance of state-of-the-art multimedia techniques
towards building real-world life species identification systems,
– provide large and original data sets of biological records, and then allow comparison of multimedia-based identification techniques,
– boost research and innovation on this topic in the next few years and encour-age multimedia researchers to work on trans-disciplinary challenges involving ecological and environmental data,
– foster technological bridges from one domain to another and exchanges be-tween the different communities (information retrieval, computer vision, bio-acoustic, machine learning, ornithology, botany, etc.),
– promote citizen science and nature observation as a way to describe, analyse and preserve biodiversity.
In 2015, more than 160 research groups and companies worldwide registered to at least one task of the lab. Of course, as in any evaluation campaign, only a small fraction of this raw audience did cross the finish line by submitting runs (actually 15 of them). Still, this shows the high attractiveness of the proposed data sets and challenges as well as the potential emergence of a wide community interested in life media analysis.
2
Task1: PlantCLEF
2.1 Context
Image-based plant identification methods are one of the most promising solution to bridge the botanical taxonomic gap, as illustrated by the proliferation of research work on the topic [27], [10], [33], [42], [28], [3] as well as the emergence of dedicated mobile applications such as LeafSnap [34] or Pl@ntNet [30]. Beyond the raw identification performance achievable by state-of-the-art computer vision algorithms, the visual search approach actually offers much more efficient and interactive ways of browsing large floras than standard field guides or online web catalogs. The first noticeable progress in this way was achieved by the US consortium at the origin of LeafSnap16. This popular iPhone application allows
a fair identification of 227 common American plant species by simply shooting a cut leaf on a uniform background (see [34] for more details). A step beyond was achieved recently by the Pl@ntNet project [30] which released a cross-platform application (iPhone [21], android17and web18) allowing (i) to query the system
with pictures of plants in their natural environment and (ii) to contribute to
16http://leafsnap.com/ 17
https://play.google.com/store/apps/details?id=org.plantnet
18
the dataset thanks to a collaborative data validation workflow involving Tela Botanica19 (i.e. the largest botanical social network in Europe).
As promising as these applications are, their performances are however still far from the requirements of a real-world participatory ecological surveillance scenario. Allowing the mass of citizens to produce accurate plant observations requires to equip them with much more accurate identification tools. Measuring and boosting the performances of content-based identification tools is therefore crucial. This was precisely the goal of the ImageCLEF20plant identification task
organized since 2011 in the context of the worldwide evaluation forum CLEF21.
In 2011, 2012, 2013 and 2014 respectively 8, 10, 12 and 10 international research groups crossed the finish line of this large collaborative evaluation by bench-marking their images-based plant identification systems (see [22], [23], [31] and [32] for more details). The evaluation data set was enriched each year with the new contributions and progressively diversified with other input feeds (annota-tion and cleaning of older data, contribu(annota-tions made through Pl@ntNet mobile applications). The plant task of LifeCLEF 2015 is directly in the continuity of this effort. The main novelties compared to the previous year are the following: (i) the doubling of the number of species, i.e. 1000 species instead of 500, (ii) the possibility to use external training data in order to foster the use of transfer learning methods (at the condition that the experiment is entirely re-producible).
2.2 Dataset
The PlantCLEF 2015 dataset is composed of 113,205 pictures belonging to 41,794 observations of 1000 species of trees, herbs and ferns living in West-ern European regions. This data was collected by 8,960 distinct contributors of the Tela Botanica social network in the context of the Pl@ntNet project [30]. Each picture belongs to one and only one of the 7 types of views reported in the meta-data (entire plant, fruit, leaf, flower, stem, branch, leaf scan) and is associated with a single plant observation identifier allowing to link it with the other pictures of the same individual plant (observed the same day by the same person). It is noticeable that most image-based identification methods and eval-uation data proposed in the past were based on leaf images (e.g. in [34],[4],[10]) whereas leaves are far from being the only discriminating visual key between species but, due to their shape and size, they have the advantage to be eas-ily observed, captured and described. More diverse parts of the plants however have to be considered for accurate identification. As an example, the 6 species depicted in Figure 1 share the same French common name of ”laurier” even though they belong to different taxonomic groups (4 families, 6 genera). The main reason is that these shrubs, often used in hedges, share leaves with more or less the same-sized elliptic shape. Identifying a laurel can be very difficult for a novice by just observing leaves, while it is indisputably easier with flowers.
19http://www.tela-botanica.org/ 20
http://www.imageclef.org/
21
Fig. 1. 6 plant species sharing the same common name for laurel in French, belonging to distinct species.
Another originality of the PlantCLEF dataset is that its social nature makes it closer to the conditions of a real-world identification scenario: (i) images of the same species are coming from distinct plants living in distinct areas, (ii) pictures are taken by different users that might not use the same protocol to acquire the images, and (iii) pictures are taken at different periods in the year. Each image of the dataset is associated with contextual meta-data (author, date, locality name, plant id) and social data (user ratings on image quality, collaboratively validated taxon names, vernacular names) provided in a structured XML file. The GPS geo-localization and the device settings are available only for some of the images.
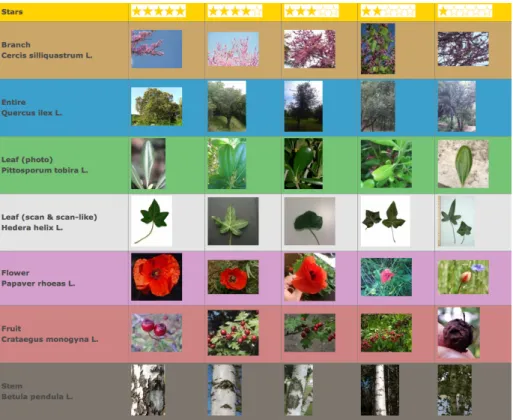
Figure 2 gives some examples of pictures with decreasing average users ratings for the different types of views. Note that the users of the specialized social network creating these ratings (Tela Botanica) are explicitly asked to rate the images according to their plant identification ability and their accordance to the pre-defined acquisition protocol for each view type. This is not an aesthetic or general interest judgement as in most social image sharing sites.
2.3 Task Description
The task was evaluated as a plant species retrieval task based on multi-image plant observations queries. The goal is to retrieve the correct plant species among the top results of a ranked list of species returned by the evaluated system. Contrary to previous plant identification benchmarks, queries are not defined as single images but as plant observations, meaning a set of one to several images depicting the same individual plant, observed by the same person, the same day. Each image of a query observation is associated with a single view type (entire plant, branch, leaf, fruit, flower, stem or leaf scan) and with contextual meta-data (data, location, author). Semi-supervised and interactive approaches were allowed but as a variant of the task and therefore evaluated independently from the fully automatic methods. None of the participants, however, used such approaches in the 2015 campaign.
Fig. 2. Examples of PlantCLEF pictures with decreasing averaged users ratings for the different types of views.
In practice, each candidate system was evaluated through the submission of a run, i.e. a file containing the set of ranked lists of species (each list corresponding to one query observation and being sorted according to the confidence score of the system in the suggested species). The metric used to evaluate the submitted runs is an extension of the mean reciprocal rank [56] classically used in information retrieval. The difference is that it is based on a two-stage averaging rather than a flat averaging such as:
S = 1 U U X u=1 1 Pu Pu X p=1 1 ru,p (1)
where U is the number of users (within the test set), Pu the number of
in-dividual plants observed by the u-th user (within the test set), ru,p is the rank
of the correct species within the ranked list of species returned by the evalu-ated system (for the p-th observation of the u-th user). Note that if the correct species does not appear in the returned list, its rank ru,pis considered as infinite.
Overall, the proposed metric allows compensating the long-tail distribution of the data. As any social network, few people actually produce huge quantities of
data whereas a vast majority of users (the long tail) produce much less data. If, for instance, only one person did collect an important percentage of the images, the classical mean reciprocal rank over a random set of queries will be strongly influenced by the images of that user to the detriment of the users who only contributed with few pictures. This is a problem for several reasons: (i) the per-sons who produce the more data are usually the most expert ones but not the most representative of the potential users of the automatic identification tools, (ii) the large number of the images they produce makes the classification of their observations easier because they tend to follow the same protocol for all their ob-servations (same device, same position of the plant in the images, etc.), (iii) the images they produce are also usually of better quality so that their classification is even easier.
2.4 Participants and Results
123 research groups worldwide registered to LifeCLEF plant challenge 2015 and downloaded the dataset. Among this large raw audience, 7 research groups suc-ceeded in submitting runs (from 1 to 4 depending on the participant). Details of the participants and the methods used in the runs are synthesised in the overview working note of the task [26] and further developed in the individual working notes of the participants for those who submitted one (EcoUAN [46], Inria ZENITH [11], Mica [36], QUTRV [19], Sabanci [41], SNUMED [13]). We here only report the official scores of the 18 collected runs and discuss the main outcomes of the task.
Figure 3 therefore shows the identification score S obtained by each run sub-mitted to the challenge. It is noticeable that the top-9 runs which performed the best were based on the GoogLeNet [52] convolutional neural network which clearly confirmed the supremacy of deep learning approaches over hand-crafted features as well as the benefit of training deeper architecture thanks to the im-proved utilization of the computing resources inside the network. The score’s deviations between these 9 runs are however still interesting (actually 10 points of MAP between the worst and the best one). A first source of improvement was the fusion strategy allowing to combine the classification results at the image level into classification scores at the observation level. In this regard, the best performing algorithm was a SoftMax function [6] as shown by the performance of QUT RV Run 2 compared to INRIA ZENITH run1 based on max pooling, or SNUMED INFO run1 based on a Borda count, or QUT RV run1 based on a sum pooling. The other source of improvement, which allowed the SNUMED group to get the best results, was to use a bootstrap aggregating (bagging) strategy [7] to improve the stability and the accuracy of the GoogLeNet Convolutional Neural Network. In SNUMED INFO Run 3 and SNUMED INFO Run 4, they actually randomly partitioned the PlantCLEF training set into five-fold so as to train 5 complementary CNN classifiers. Bagging is a well known strategy for reducing variance and avoiding overfitting, in particular in the case of decision trees, but it is interesting to see that it is also very effective in the case on deep
Fig. 3. Results of LifeCLEF 2015 Plant Identification challenge.
learning.
The second best approach that did not rely on deep learning (i.e. INRIA ZENITH run 2) was based on the Fisher Vector model [44] on top of a variety of hand-crafted visual features. It is important to note that this method did not not make use of any additional training data other than the one provided in the bench-mark (contrary to the CNN’s that were all previously trained on the large-scale ImageNet dataset). Within the previous PlantCLEF challenge in 2014 [32], in which using external training data was not allowed, the Fisher Vector approach was performing the best, even compared to CNN’s. But still, the huge perfor-mance gap confirms that learning visual features through deep learning is much more effective than sticking on hand-crafted visual features. Interestingly, the third run of the INRIA ZENITH team was based on a fusion of the fisher vector run and the GoogLeNet one which allows assessing in which measure the two approaches are complementary or not. The results show that the performance of the merged run was not better than the GoogLeNet alone. This indicates that the hand-crafted visual features encoded in the fisher vectors did not bring sufficient additional information to be captured by the fusion model (based on Bayesian inference).
A last interesting outcome that can be derived from the raw results of the task is the relative low performance achieved by the runs of the SABANCI research group which were actually based on the recent PCANet method [12]. PCANet is a very simple deep learning network which comprises only basic data pro-cessing components, i.e. cascaded principal component analysis (PCA), binary
hashing, and block-wise histograms. The learned visual features are claimed by the authors to be on par with the state of the art features, either prefixed, highly hand-crafted or carefully learned (by DNNs). The results of our challenge do not confirm this assertion. All the runs of SABANCI did notably have lower per-formances than the hand-crafted visual features used by MICA runs or INRIA ZENITH Run 2, and much lower performances than the features learned by all other deep learning methods. This conclusion should however be mitigated by the fact that the PCANet of SABANCI was only trained on PlantCLEF data and on a large-scale external data such as ImageNet. Complementary experiments in this way should therefore be conducted to really conclude on the competitiveness of this simple deep learning technique.
Further analysis of the raw results are provided in the overview working note of the task [26], in particular a study of the contribution of the different plant organs.
3
Task2: BirdCLEF
3.1 Context
The bird and the plant identification tasks share similar usage scenarios. The general public as well as professionals like park rangers, ecology consultants, and of course, the ornithologists themselves might actually be users of an automated bird identifying system, typically in the context of wider initiatives related to ecological surveillance or biodiversity conservation. Using audio records rather than bird pictures is justified by current practices [9],[54],[53],[8]. Birds are actu-ally not easy to photograph as they are most of the time hidden, perched high in a tree or frightened by human presence, and they can fly very quickly, whereas audio calls and songs have proved to be easier to collect and very discriminant. Only three noticeable previous initiatives on bird species identification based on their songs or calls in the context of worldwide evaluation took place, in 2013. The first one was the ICML4B bird challenge joint to the International Conference on Machine Learning in Atlanta, June 2013. It was initiated by the SABIOD MASTODONS CNRS group22, the University of Toulon and the
Na-tional Natural History Museum of Paris [20]. It included 35 species, and 76 participants submitted their 400 runs on the Kaggle interface. The second chal-lenge was conducted by F. Brigs at MLSP 2013 workshop, with 15 species, and 79 participants in August 2013. The third challenge, and biggest in 2013, was organised by University of Toulon, SABIOD and Biotope, with 80 species from the Provence, France. More than thirty teams participated, reaching 92% of av-erage AUC. The description of the ICML4B best systems are given in the on-line book [2], including for some of them references to some useful scripts.
In collaboration with the organizers of these previous challenges, BirdCLEF 2014 & 2015 challenges went one step further by (i) significantly increasing the species number by an order of magnitude, (ii) working on real-world social data
22
built from thousands of recordists, and (iii) moving to a more usage-driven and system-oriented benchmark by allowing the use of meta-data and defining infor-mation retrieval oriented metrics. Overall, the task is much more difficult than previous benchmarks because of the higher confusion risk between the classes, the higher background noise and the higher diversity in the acquisition con-ditions (devices, recordists uses, contexts diversity, etc.). It therefore produces substantially lower scores and offer a better progression margin towards building real-world generalist identification tools.
3.2 Dataset
The training and test data of the challenge consists of audio recordings collected by Xeno-canto (XC)23. Xeno-canto is a web-based community of bird sound
recordists worldwide with about 2400 active contributors that have already col-lected more than 240,000 recordings of about 9350 species (numbers for june 2015). Nearly 1000 (in fact 999) species were used in the BirdCLEF dataset, representing the 999 species with the highest number of recordings in october 2014 (14 or more) from the combined area of Brazil, French Guiana, Surinam, Guyana, Venezuela and Colombia, totalling 33,203 recordings produced by thou-sands of users. This dataset also contains the entire dataset from the 2014 Bird-CLEF challenge [25], which contained about 14,000 recordings from 501 species. To avoid any bias in the evaluation related to the used audio devices, each audio file has been normalized to a constant bandwidth of 44.1 kHz and coded over 16 bits in wav mono format (the right channel is selected by default). The conversion from the original Xeno-canto data set was done using ffmpeg, sox and matlab scripts. The optimized 16 Mel Filter Cepstrum Coefficients for bird identification (according to an extended benchmark [15]) have been computed with their first and second temporal derivatives on the whole set. They were used in the best systems run in ICML4B and NIPS4B challenges.
All audio records are associated with various meta-data including the species of the most active singing bird, the species of the other birds audible in the background, the type of sound (call, song, alarm, flight, etc.), the date and location of the observations (from which rich statistics on species distribution can be derived), some textual comments of the authors, multilingual common names and collaborative quality ratings. All of them were produced collaboratively by Xeno-canto community.
3.3 Task Description
Participants were asked to determine the species of the most active singing birds in each query file. The background noise can be used as any other meta-data, but it was forbidden to correlate the test set of the challenge with the original annotated Xeno-canto data base (or with any external content as many of them
23
are circulating on the web). More precisely and similarly to the plant task, the whole BirdCLEF dataset was split in two parts, one for training (and/or index-ing) and one for testing. The test set was built by randomly choosing 1/3 of the observations of each species whereas the remaining observations were kept in the reference training set. Recordings of the same species done by the same person the same day are considered as being part of the same observation and cannot be split across the test and training set. The XML files containing the meta-data of the query recordings were purged so as to erase the taxon name (the ground truth), the vernacular name (common name of the bird) and the collaborative quality ratings (that would not be available at query stage in a real-world mobile application). Meta-data of the recordings in the training set were kept unaltered. The groups participating to the task were asked to produce up to 4 runs containing a ranked list of the most probable species for each query records of the test set. Each species was associated with a normalized score in the range [0; 1] reflecting the likelihood that this species is singing in the sample. The primary metric used to compare the runs was the Mean Average Precision averaged across all queries.
3.4 Participants and Results
137 research groups worldwide registered for the bird challenge and downloaded the data but only 6 of them finally submitted runs notably because the scale of the data prevent many groups to complete a full experiment. Details on the participants and the methods used in the runs are synthesised in the overview working note of the task [24] and further developed in the individual working notes of the participants (Golem [38], Inria [29], MARF [39], MNB TSA [35], QMUL [51]). We here only report the official scores of the 17 collected runs and discuss the main outcomes of the task. Figure 4 therefore displays the two dis-tinct measured mean Average Precision (MAP) for each run, the first one (MAP 1) considering only the foreground species of each test recording and the other (MAP 2) considering additionally the species listed in the Background species field of the metadata.
The main outcome of the evaluation was that the use of matching-based scores as high-dimensional features to be classified by supervised classifiers (as done by MNB TSA and INRIA ZENITH) provides the best results, with a MAP value up to 0.454 for the fourth run of the MNB TSA group. These approaches notably outperform the unsupervised feature learning framework of the QMUL group as well as the baseline method of the Golem group. The matching of all the audio recordings however remains a very time-consuming process that had to be carefully designed in order to process a large-scale dataset such as the one deployed within the challenge. The MNB TSA group notably reduced as much as possible the number of audio segments to be matched thanks to an effective audio pre-processing and segmentation framework. They also restricted the extraction of these segments to the files having the best quality according to
Fig. 4. Official scores of the LifeCLEF Bird Identification Task. MAP 2 is the Mean Av-erage Precision avAv-eraged across all queries taking into account the background species (while MAP 1 is considering only the foreground species).
the user ratings and that do not have background species. On the other side, the INRIA ZENITH group did not use any segmentation but attempted to speed-up the matching though the use of a hash-based approximate k-nearest neighbors search scheme (on top of MFCC features). The better performance of the MNB TSA runs shows that cleaning the audio segments vocabulary before applying the matching is clearly beneficial. But using a scalable knn-based matching as the one of the INRIA ZENITH runs could be a complementary way to speed up the matching phase.
It is interesting to notice that the first run of the MNB TSA group is roughly the same method than the one they used within the BirdCLEF challenge of the previous year [25] and which achieved the best results (with a MAP1 equals to 0.511 vs. 0.424 this year). This shows that the impact of the increasing difficulty of the challenge (with twice the number of species) is far from negligible. The performance loss is notably not compensated by the bagging extension of the method which resulted in a MAP1 equals to 0.454 for MNB TSA run 4. As a final comment on this evaluation study, it is worth noting that none of the participants attempted to evaluate deep learning approaches such as using deep convolutional neural networks (CNN) that have been recently shown to achieve excellent classification performance on both image and audio contents. The most likely reason is that the use of external training data was not allowed. It was consequently not possible to employ transfer learning mechanisms such as
specializing a CNN previously trained on a large generalist training set. Without using such strategy, the provided training data might be insufficiently large to train the millions of parameters of the deep networks.
4
Task3: FishCLEF
4.1 Context
The goal of the fish identification task is to identify fish occurrences in video seg-ments. The typical usage scenario of automated underwater video analysis tools is to support marine biologists in studying thoroughly the marine ecosystem and fish biodiversity. Also, scuba divers, marine stakeholders and other marine prac-titioners may benefit greatly from this kind of tools. Recently, underwater video and imaging systems, able to continuously record the underwater environment, have gained a lot of interest as opposed to the traditional techniques used for studying fish populations, such as casting nets or human manned photography. Indeed, they do not affect fish behavior and may provide large amounts of vi-sual data at the same time. However, manual analysis as performed by human operators is largely impractical, and requires automated methods. Nevertheless, the development of automatic video analysis tools is challenging because of the complexities of underwater video recordings in terms of the variability of scenar-ios and factors that may degrade the video quality such as water clarity and/or depth.
Despite some preliminary work, mainly carried out in controlled environments (e.g., labs, cages, etc.) [40],[50],[16], the most important step in the automated vi-sual analysis has been done in the EU-funded Fish4Knowledge (F4K)24 project,
where computer vision methods were developed to extract information about fish density and richness from videos taken by underwater cameras installed at coral reefs in Taiwan [48],[48]. Since the Fish4Knowledge project, many researchers have directed their attention towards underwater video analysis [45],[47], includ-ing some recent initiatives by the National Oceanographic and Atmospheric Ad-ministration (NOAA) [49] and the fish identification task at LifeCLEF 2014 [14]. Although there are recent advances in the underwater computer vision field, the problem is still open and needs several (joint) efforts to devise robust methods able to provide reliable measures on fish populations.
4.2 Dataset
Training and test data of the fish task consists of several underwater video se-quences collected by NCHC in Taiwan and used in the Fish4Knowledge project. The training set is built up of 20 manually annotated videos, a list of 15 fish species and for each species, a set of sample images to support learning of fish appearance models. Each video is manually labelled and agreed by two expert annotators and the ground truth consists of a set of bounding boxes (one for
24
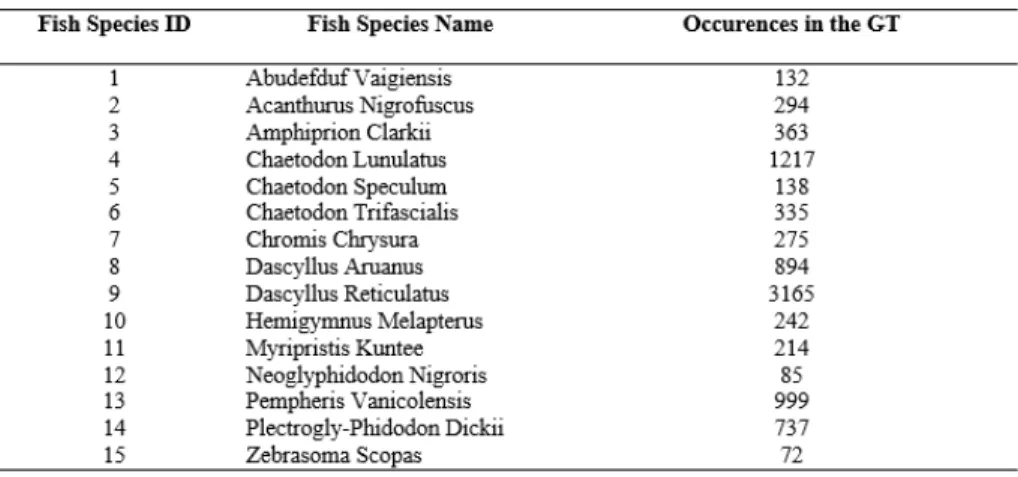
each instance of the given fish in the species list) together with the fish species. In total, the training dataset contains more than 9000 annotations (bounding boxes with species) and more than 20000 sample images (see Fig. 5). The train-ing set is unbalanced in the number of instances of fish species: for instance, it contains 3165 instances of Dascyllus Reticulate and only 72 instances of Zebra-soma Scopas. This has been done so as to not favour nonparametric methods over model-based methods. For each considered fish species, its fishbase.org link is also provided. In order to make the identification process independent from tracking, temporal information has not be exploited. This means that the annotators only labelled fish for which the species was clearly identifiable, i.e., if at time t the species of fish A was not clear, it was not labelled, no matter if the same fish instance was observed at time t − 1.
Fig. 5. Fish species occurrences in the training set.
The test set contains 73 underwater videos and an overview, in terms of fish species occurrences, is shown in Fig 6. For some fish species, there were no occurrences in the test set. Also some video segments contain no fish. This has been done to test the method’s capability to reject false positives.
4.3 Task Description
The main goal of the video-based fish identification task is to count automatically fish per species in video segments (e.g., video X contains N 1 instances of fish of species 1, ..., Nninstances of fish species N ). However, participants were also
asked to identify fish bounding boxes. The ground truth for each video (provided as an XML file) contains information on fish species and location as shown in Fig. 7.
Fig. 6. Fish species occurrences in the test set.
Fig. 7. An example of XML ground truth file. It contains information on fish species as well as bounding box coordinates.
The participants were asked to provide up to three runs. Each run had to contain all the videos included in the set and for each video the frame where the fish was detected together with the bounding box, and species name (only the most confident species) for each detected fish.
As metrics, we used the “counting score (CS)” and the “normalized counting score (NCS)”, defined as:
CS = e− d Ngt
(2) with d being the difference between the number of occurrences in the run (per species) and, Ngt, the number of occurrences in the ground truth. To define
NCS we needed to compute precision (P r) as
P r = T P
T P + F P (3)
with T P and F P being, respectively, the true positive and the false positive. As detection was considered a true positive if the intersection over union score of its bounding box and the ground truth was over 0.5 and the fish species was correctly identified. Finally, the normalised counting score (NCS) is computed as:
N CS = CS × P r (4)
4.4 Participants and Results
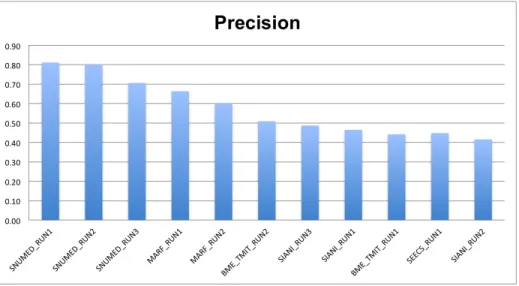
89 research groups registered for the fish challenge while only five of them finally submitted runs. This, however, is a notable increase with respect to the first FishCLEF edition in 2014. Thorough details on the employed methods for video-based fish identification can be found in the task overview working note [14] as well as in the participants’ working notes. The official scores achieved by the five teams (overall, 12 submitted runs) are given in the following. More specifically, figure 8 and 9 show, respectively, average (per video and species) precision and normalized counting score for all the 12 runs.
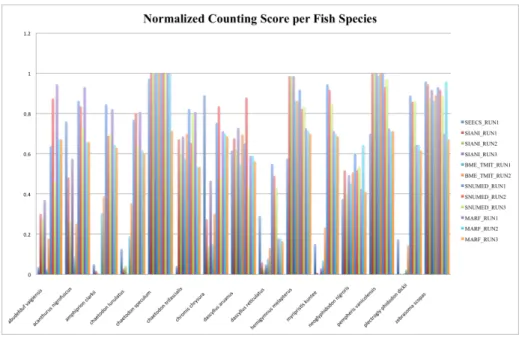
As with the Plant task, the best evaluated system was the one by the SNUMED INFO research group based on the GoogLeNet convolutional neural network [52] for classifying fish instances. Potential fish instances were previ-ously segmented from the video through a stationary foreground detection using background subtraction and a selective search strategy [55]. Producing the fi-nal output counts was fifi-nally achieved by grouping the temporally connected video segments classified by the CNN. Thanks to this framework, the monitor-ing performance of the 15 considered species is on average very effective, with a normalized counting score of about 80% for the best run SNUMED RUN1. As illustrated in Figure 10, showing the scores by species, the strength of the GoogLeNet approach is notably to provide good results for all species whereas most other methods fail on some of them. Scaling this experiment to more species
Fig. 8. Official precision scores of the LifeCLEF 2015 -Fish Identification Task.
Fig. 9. Official normalized counting scores of the LifeCLEF 2015 -Fish Identification Task.
is, however, required to validate the applicability of the approach in real-life un-derwater monitoring systems. The CNN-based approach outperformed greatly methods relying purely on background modelling (see BM E T M IT , SIAN I and SEECS results) and on multi-class classification using a set of low-level visual descriptors, thus indicating a new effective direction to deal with under-water videos. However, processing times would need to be taken into account to see which approach may represent a good accuracy-speed trade-off to be used for real-time monitoring.
Fig. 10. Official normalized counting scores per species of the LifeCLEF 2015 -Fish Identification Task.
5
Conclusions and Perspectives
With more than 160 research groups who downloaded LifeCLEF 2015 datasets and 15 of them who submitted runs, the second edition of the LifeCLEF evalu-ation did confirm a high interest of the proposed challenges in several commu-nities (computer vision, multimedia, bio-accoustic, machine learning). The main outcome of this collaborative effort is a snapshot of the performance of state-of-the-art computer vision, bio-acoustic and machine learning techniques towards building real-world life species identification systems. The results did show that
very high identification success rates can be reached by the evaluated systems, even on the unprecedent number of species of the bird and the plant challenge (actually 1000 species). The most noticeable progress came from the deploy-ment of deep Convolutional Neural Networks which definitely confirmed their ability to learn effective content specific features by transferring knowledge from generalist training sets. In this perspective, collecting and building appropriate training data continues being one of the most central problem and we believe it is essential to continue the LifeCLEF effort in the next years if we would like to use such tools for automatically monitoring real-world ecosystems.
References
1. MAED ’12: Proceedings of the 1st ACM International Workshop on Multimedia Analysis for Ecological Data, New York, NY, USA, 2012. ACM. 433127.
2. Proc. of the first workshop on Machine Learning for Bioacoustics, 2013.
3. E. Aptoula and B. Yanikoglu. Morphological features for leaf based plant recog-nition. In Proc. IEEE Int. Conf. Image Process., Melbourne, Australia, page 7, 2013.
4. A. R. Backes, D. Casanova, and O. M. Bruno. Plant leaf identification based on volumetric fractal dimension. International Journal of Pattern Recognition and Artificial Intelligence, 23(6):1145–1160, 2009.
5. H.-T. C. Baillie, J.E.M. and S. Stuart. 2004 iucn red list of threatened species. a global species assessment. IUCN, Gland, Switzerland and Cambridge, UK, 2004. 6. C. M. Bishop et al. Pattern recognition and machine learning, volume 4. springer
New York, 2006.
7. L. Breiman. Bagging predictors. Machine learning, 24(2):123–140, 1996.
8. F. Briggs, B. Lakshminarayanan, L. Neal, X. Z. Fern, R. Raich, S. J. Hadley, A. S. Hadley, and M. G. Betts. Acoustic classification of multiple simultaneous bird species: A multi-instance multi-label approach. The Journal of the Acoustical Society of America, 131:4640, 2012.
9. J. Cai, D. Ee, B. Pham, P. Roe, and J. Zhang. Sensor network for the monitoring of ecosystem: Bird species recognition. In Intelligent Sensors, Sensor Networks and Information, 2007. ISSNIP 2007. 3rd International Conference on, pages 293–298, Dec 2007.
10. G. Cerutti, L. Tougne, A. Vacavant, and D. Coquin. A parametric active polygon for leaf segmentation and shape estimation. In International Symposium on Visual Computing, pages 202–213, 2011.
11. J. Champ, T. Lorieul, M. Servajean, and A. Joly. A comparative study of fine-grained classification methods in the context of the lifeclef plant identification challenge 2015. In Working notes of CLEF 2015 conference, 2015.
12. T.-H. Chan, K. Jia, S. Gao, J. Lu, Z. Zeng, and Y. Ma. Pcanet: A simple deep learning baseline for image classification? arXiv preprint arXiv:1404.3606, 2014. 13. S. Choi. Plant identification with deep convolutional neural network:
Snumed-info at lifeclef plant identification task 2015. In Working notes of CLEF 2015 conference, 2015.
14. S. Concetto, S. Palazzo, B. Fisher, and B. Boom. Lifeclef fish identification task 2014. In CLEF working notes 2015, 2015.
15. O. Dufour, T. Artieres, H. GLOTIN, and P. Giraudet. Clusterized mel filter cep-stral coefficients and support vector machines for bird song idenfication. 2013.
16. F. Evans. Detecting fish in underwater video using the em algorithm. In Im-age Processing, 2003. ICIP 2003. Proceedings. 2003 International Conference on, volume 3, pages III–1029–32 vol.2, Sept 2003.
17. E. J. Farnsworth, M. Chu, W. J. Kress, A. K. Neill, J. H. Best, J. Pickering, R. D. Stevenson, G. W. Courtney, J. K. VanDyk, and A. M. Ellison. Next-generation field guides. BioScience, 63(11):891–899, 2013.
18. K. J. Gaston and M. A. O’Neill. Automated species identification: why not? 359(1444):655–667, 2004.
19. Z. Ge, C. Mccool, and P. Corke. Content specific feature learning for fine-grained plant classification. In Working notes of CLEF 2015 conference, 2015.
20. H. Glotin and J. Sueur. Overview of the first international challenge on bird classification. 2013.
21. H. Go¨eau, P. Bonnet, A. Joly, V. Baki´c, J. Barbe, I. Yahiaoui, S. Selmi, J. Carr´e, D. Barth´el´emy, N. Boujemaa, et al. Pl@ ntnet mobile app. In Proceedings of the 21st ACM international conference on Multimedia, pages 423–424. ACM, 2013. 22. H. Go¨eau, P. Bonnet, A. Joly, N. Boujemaa, D. Barth´el´emy, J.-F. Molino, P.
Birn-baum, E. Mouysset, and M. Picard. The ImageCLEF 2011 plant images classifi-cation task. In CLEF working notes, 2011.
23. H. Go¨eau, P. Bonnet, A. Joly, I. Yahiaoui, D. Barthelemy, N. Boujemaa, and J.-F. Molino. The imageclef 2012 plant identification task. In CLEF working notes, 2012.
24. H. Go¨eau, H. Glotin, W.-P. Vellinga, R. Planque, A. Rauber, and A. Joly. Lifeclef bird identification task 2015. In CLEF working notes 2015, 2015.
25. H. Go¨eau, H. Glotin, W.-P. Vellinga, and A. Rauber. Lifeclef bird identification task 2014. In CLEF working notes 2014, 2014.
26. H. Go¨eau, A. Joly, and P. Bonnet. Lifeclef plant identification task 2015. In CLEF working notes 2015, 2015.
27. H. Go¨eau, A. Joly, S. Selmi, P. Bonnet, E. Mouysset, L. Joyeux, J.-F. Molino, P. Birnbaum, D. Bathelemy, and N. Boujemaa. Visual-based plant species identifi-cation from crowdsourced data. In ACM conference on Multimedia, pages 813–814, 2011.
28. A. Hazra, K. Deb, S. Kundu, P. Hazra, et al. Shape oriented feature selection for tomato plant identification. International Journal of Computer Applications Technology and Research, 2(4):449–meta, 2013.
29. A. Joly, J. Champ, and O. Buisson. Shared nearest neighbors match kernel for bird songs identification - lifeclef 2015 challenge. In Working notes of CLEF 201 conference, 2015.
30. A. Joly, H. Go¨eau, P. Bonnet, V. Baki´c, J. Barbe, S. Selmi, I. Yahiaoui, J. Carr´e, E. Mouysset, J.-F. Molino, et al. Interactive plant identification based on social image data. Ecological Informatics, 23:22–34, 2014.
31. A. Joly, H. Go¨eau, P. Bonnet, V. Bakic, J.-F. Molino, D. Barth´el´emy, and N. Bou-jemaa. The Imageclef Plant Identification Task 2013. In International workshop on Multimedia analysis for ecological data, Barcelone, Espagne, Oct. 2013. 32. A. Joly, H. M¨uller, H. Go¨eau, H. Glotin, C. Spampinato, A. Rauber, P. Bonnet,
W.-P. Vellinga, and B. Fisher. Lifeclef 2014: multimedia life species identification challenges.
33. H. Kebapci, B. Yanikoglu, and G. Unal. Plant image retrieval using color, shape and texture features. The Computer Journal, 54(9):1475–1490, 2011.
34. N. Kumar, P. N. Belhumeur, A. Biswas, D. W. Jacobs, W. J. Kress, I. C. Lopez, and J. V. B. Soares. Leafsnap: A computer vision system for automatic plant species identification. In European Conference on Computer Vision, pages 502–516, 2012.
35. M. Lasseck. Improved automatic bird identification through decision tree based feature selection and bagging. In Working notes of CLEF 2015 conference, 2015. 36. T.-L. Le, D. N. Dng, H. Vu, and T.-N. Nguyen. Mica at lifeclef 2015: Multi-organ
plant identification. In Working notes of CLEF 2015 conference, 2015.
37. D.-J. Lee, R. B. Schoenberger, D. Shiozawa, X. Xu, and P. Zhan. Contour matching for a fish recognition and migration-monitoring system. In Optics East, pages 37– 48. International Society for Optics and Photonics, 2004.
38. I. Meza, A. Espino-Gamez, F. Solano, and E. Villarreal.
39. S. A. Mokhov. A marfclef approach to lifeclef 2015 tasks. In Working notes of CLEF 2015 conference, 2015.
40. E. Morais, M. Campos, F. Padua, and R. Carceroni. Particle filter-based predictive tracking for robust fish counting. In Computer Graphics and Image Processing, 2005. SIBGRAPI 2005. 18th Brazilian Symposium on, pages 367–374, Oct 2005. 41. E. A. O. M. Mostafa Mehdipour Ghazi, Berrin Yanikoglu and M. C. Ozdemir.
Sabanci-okan system in lifeclef 2015 plant identification competition. In Working notes of CLEF 2015 conference, 2015.
42. S. Mouine, I. Yahiaoui, and A. Verroust-Blondet. Advanced shape context for plant species identification using leaf image retrieval. In ACM International Conference on Multimedia Retrieval, pages 49:1–49:8, 2012.
43. H. M¨uller, P. Clough, T. Deselaers, and B. Caputo, editors. ImageCLEF – Ex-perimental Evaluation in Visual Information Retrieval, volume 32 of The Springer International Series On Information Retrieval. Springer, Berlin Heidelberg, 2010. 44. F. Perronnin, J. S´anchez, and T. Mensink. Improving the fisher kernel for large-scale image classification. In Computer Vision–ECCV 2010, pages 143–156. Springer, 2010.
45. M. Ravanbakhsh, M. R. Shortis, F. Shafait, A. Mian, E. S. Harvey, and J. W. Seager. Automated fish detection in underwater images using shape-based level sets. The Photogrammetric Record, 30(149):46–62, 2015.
46. A. K. Reyes, J. C. Caicedo, and J. E. Camargo. Fine-tuning deep convolutional networks for plant recognition. In Working notes of CLEF 2015 conference, 2015. 47. A. Rodriguez, A. Rico-Diaz, J. Rabu˜nal, J. Puertas, and L. Pena. Fish monitor-ing and sizmonitor-ing usmonitor-ing computer vision. In J. M. Ferr´andez Vicente, J. R. ´Alvarez S´anchez, F. de la Paz L´opez, F. J. Toledo-Moreo, and H. Adeli, editors, Bioinspired Computation in Artificial Systems, volume 9108 of Lecture Notes in Computer Sci-ence, pages 419–428. Springer International Publishing, 2015.
48. M. R. Shortis, M. Ravanbakskh, F. Shaifat, E. S. Harvey, A. Mian, J. W. Seager, P. F. Culverhouse, D. E. Cline, and D. R. Edgington. A review of techniques for the identification and measurement of fish in underwater stereo-video image sequences. In SPIE Optical Metrology 2013, pages 87910G–87910G. International Society for Optics and Photonics, 2013.
49. M. Sigler, D. DeMaster, P. Boveng, M. Cameron, E. Moreland, K. Williams, and R. Towler. Advances in methods for marine mammal and fish stock assessments: Thermal imagery and camtrawl. Marine Technology Society Journal, 49(2):99–106, 2015-03-01T00:00:00.
50. C. Spampinato, Y.-H. Chen-Burger, G. Nadarajan, and R. B. Fisher. Detecting, tracking and counting fish in low quality unconstrained underwater videos. In VISAPP (2), pages 514–519. Citeseer, 2008.
51. D. Stowell. Birdclef 2015 submission: Unsupervised feature learning from audio. In Working notes of CLEF 2015 conference, 2015.
52. C. Szegedy, W. Liu, Y. Jia, P. Sermanet, S. Reed, D. Anguelov, D. Erhan, V. Van-houcke, and A. Rabinovich. Going deeper with convolutions. arXiv preprint arXiv:1409.4842, 2014.
53. M. Towsey, B. Planitz, A. Nantes, J. Wimmer, and P. Roe. A toolbox for animal call recognition. Bioacoustics, 21(2):107–125, 2012.
54. V. M. Trifa, A. N. Kirschel, C. E. Taylor, and E. E. Vallejo. Automated species recognition of antbirds in a mexican rainforest using hidden markov models. The Journal of the Acoustical Society of America, 123:2424, 2008.
55. J. R. Uijlings, K. E. van de Sande, T. Gevers, and A. W. Smeulders. Selective search for object recognition. International journal of computer vision, 104(2):154–171, 2013.
56. E. M. Voorhees et al. The trec-8 question answering track report. In TREC, volume 99, pages 77–82, 1999.
57. Q. D. Wheeler, P. H. Raven, and E. O. Wilson. Taxonomy: Impediment or expe-dient? Science, 303(5656):285, 2004.