' - -"
MICHIGAN RESERVOIR DELINEATION RESEARCH
FACILITY
Roger. Turpening, Chantal Chauvelier
Earth Resources Laboratory
Department of Earth, Atmospheric, and Planetary Sciences Massachusetts Institute of Technology
Cambridge, MA 02139
John Queen
Conoco, Inc. P.O. Box 1267 Ponca City, OK 74603 andEarth Resources Laboratory
Department of Earth, Atmospheric, and Planetary Sciences Massachusetts Institute of Technology
Cambridge, MA 02139
V. Dale Cox
Conoco, Inc.
P.O. Box 1267 Ponca City, OK 74602
ABSTRACT
1995 was the most active year in recent history at the test site. Although the initial year of 1983 saw more work, we were still basking in the glow of the modern "oil boom"; the downsizing crash was ahead of us. In 1983, working around the clock, we recorded 13 VSPs, a suite of logs, a reverse VSP, borehole gravity survey, and a 3-D survey in two months of field time. In 1995, a single, four-man Conoco crew worked ten to twelve hour days, for 70 days, and recorded a massive cross-well, orbital vibrator data set-clearly a Herculean task. This paper outlines the pre-survey planning that
Turpening et al.
took place in anticipation of that effort. In addition, we document the single well data acquisition efforts of Conoco, Inc. and Lawrence .Berkeley Laboratory (LBL), and the dipole logging work of Halliburton Energy Services. These data are in the handling stages and processing has not yet begun.
BACKGROUND
1995 was a very active year at the test site, with four data acquisition programs taking place between mid-June and late October. Although the projects were different, they all involved some kind of "dipole" source in the borehole. In chronological order the projects were:
1. Orbital-vibrator, cross-well data acquisition at the reef level.
2. Orbital-vibrator, cross-well data acquisition at the Antrim shale level. 3. Single well data acquisition at the reef level.
4. Dipole logging with a new dipole tool.
Conoco provided the hardware and field personnel for the first three programs, with LBL heading the single well data acquisition effort. Halliburton provided the new dipole logging tool.
CROSS-WELL DATA ACQUISITION
The objectives and constraints for cross-well data acquisition have not changed since the inception of the technique. One wants a full range of ray paths in the suite of data from horizontal rays to the very steepest ray paths possible. One also desires a fine (small) spacing between the source positions as well as the receiver positions to avoid spatial aliasing. It is important that the target, in this case the producing portion of the reef, be in the middle of the survey. While the objectives have not changed, neither has the major constraint, namely that the survey must be economically feasible. At the Michigan Test Site it is easy to place the target in the middle of the survey since the boreholes are each 2,000 ft deeper than the reservoir. However, all other objectives are no more economical now than they were in 1990-1991, when we performed our first large cross-well survey. Therefore, trade-offs amongst those objectives must be sought.
Previous Data Acquisition
In 1990 and 1991, BP America, Inc. acquired cross-well data using a piezoelectric source and receivers. The survey was designed with an aperture of 2,000 ft in each borehole (Figure 1). The "center" of the reef was taken to be at a depth of 4,500 ft, thus the top of the survey was 3,500 ft and the bottom was at 5,500 ft. This created a "square"
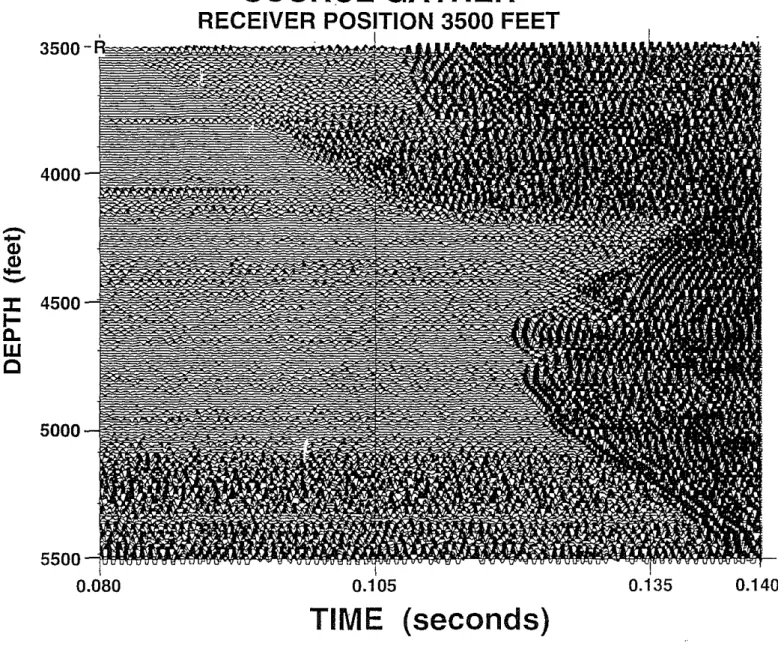
survey since the distance between the holes at the test site is nominally 2,000 ft. The spacing of the source positions and the re~eiverpositions was 10 ft, as shown in Figure 1, giving 201 source and 201 receiver locations. In the search for high-angle ray paths, it was not possible to increase the survey beyond the "square" configuration because of the radiation pattern of the source and receivers. In Figure 2, it is clear that we have lost the signal even before reaching the corners of the survey (approximately 450 in the radiation pattern).
Design of the 1995 Survey-The Orbital Vibrator
The parameters that were central to the design of the survey were the telemetry time and the fact that sweeps could not be stacked downhole. The Conoco/ Amoco receiver string consisted of five wall-clamping sondes, 8 ft apart, with a three-component accelerometer in each sonde. The telemetry of the 15 channels of data took 50 seconds for each sweep of the source. A complete set of data requires the source to be rotated first in one direction and then in the opposite direction. The sweep length was 8 seconds (4.5 seconds, upsweep; 3.5 seconds, downsweep). A rudimentary set of data would thus take two minutes to acquire and one minute was needed for every additional sweep.
A hypothetical aperture of, say, 3,000 ft. taken at 8 ft intervals would require four months of time, assuming 30 working days in each month, or nearly 6 months if one assumes only 20 working days in each month. Iffour sweeps were necessary, then these times would be doubled because stacking downhole was not available; clearly some tradeoffs were necessary.
Survey Design
Given that a small, uniform spacing of sources and receivers over the entire aperture was not possible, one is then left with the problem of deciding which of the infinite number of smaller surveys is best for this particular situation. It was anticipated that the orbital vibrator would be a stronger source than the piezoelectric source, but this was not known. Therefore, a small initial test was planned. Although both sources merely hang in the fluid, the orbital vibrator uses a much lower frequency band and a much longer sweep. Ifthe orbital source proved to be stronger, then obviously that strength should be used to obtain steeper ray paths.
Although it is clear that steep ray paths are desired, it is not obvious how one should best achieve that goal given the parameters of the source and receivers and financial constraints. As mentioned above, there are five receivers on a wireline with a spacing of 8 ft between them. Thus, these five receivers move as a unit. The source is a single device on a wireline and since it does not clamp it is easily moved in its borehole while the receivers remain fixed.
Turpening et al.
The Producing Zone
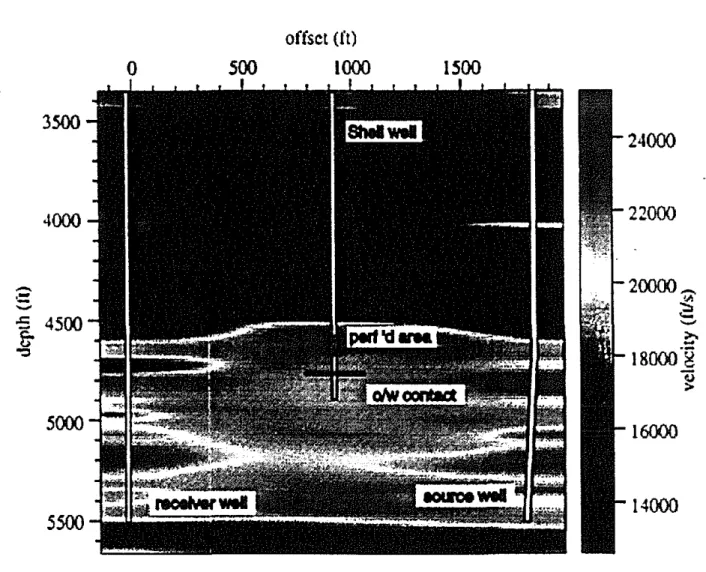
Shell Oil Company's engineering records, obtained in 1992, show perforations over the interval from 4,770 ft to 4,662 ft. Therefore, that general area of the reef (beneath the A1 Carbonate) is an interesting region to be imaged. The P wave tomographic image, obtained in 1991 (Figure 3) shows a slight reduction in velocity in that area. Thus, it is important in this data acquisition that we obtain steep ray paths so that energy actually penetrates the producing zone instead of propagating across the region as head waves in the A2 Carbonate.
Requirements
At the outset it was determined that one month of field time would be the maximum amount of time that Conoco's field crew could provide. Therefore, a data acquisition plan should respect the following parameters and desires:
• Steepest ray paths possible.
• Ray paths that pass through the producing zone.
• Receivers move as a unit of five sondes with 8 ft spacing between sondes. • Sweep length plus data telemetry time is approximately one minute. • Source requires at least two sweeps (in opposite directions).
• More sweeps may be required; a preliminary field test is needed. • Time in the field must not exceed one month.
We turned to numerical modeling to aid us in selecting a data acquisition plan that would satisfy the above requirements.
Modeling
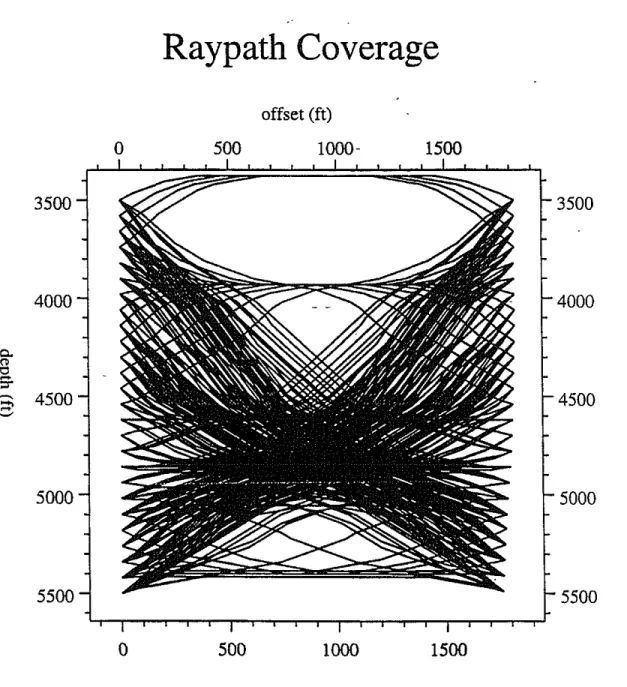
Numerical modeling was done for P wave propagation because compressional wave ve-locity is better known throughout the test site than shear wave veve-locity. We assume that the ray path trajectories are essentially the same, at least good enough for the design of a data acquisition plan. The velocity field used for the modeling was the tomogram (Figure 3) obtained from the high-frequency piezoelectric data set provided by BP America in 1990 and 1991. The entire cross-well data set was not used in the generation of that tomogram; half of the source locations were used in the top two-thirds of the survey, while all of the receiver positions were used. Figure 4 shows the ray paths for the survey and although it appears at first glance that the coverage of the reef is good, a closer look (Figure 5) shows that many of the rays pass over the reef itself as head waves in the A2 and A1 Carbonates.
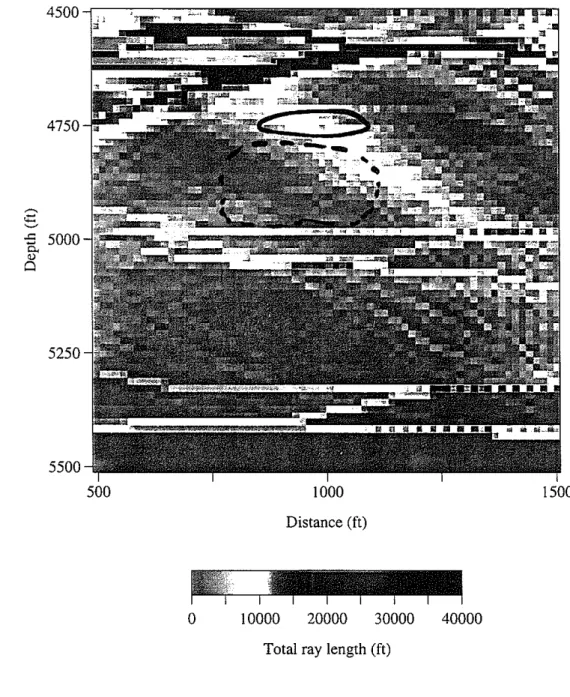
The first plan placed a denser source array (spacings of 8 ft) at the bottom and at the top of the source well with a coarse spacing (32 ft) in the middle giving a total of approximately 200 source locations. This allows for a higher density of rays with high angles. In addition, the receiver distribution was separated into distinct groups, each consisting of four placements of Conoco's five sondes for a total of 20 receiver positions. Gaps of approximately 200 ft were placed between these ten groups. Figure 6 shows the ray paths that are generated by such a design (the color coding indicates the length of the ray paths). Ifone looks closely at the producing zone of the reef, we see (Figure 7) that we have high-angle ray paths passing through this area that were not present in the 1990-1991 survey.
Several different ideas for source and receiver placement were tried in an effort to increase even more the ray coverage inside the reef. The final design does not cliffer markedly from the initial plan. In an effort to reduce costs, the number of groups was reduced to eight from ten and in some cases a given group was pulled apart into smaller groups of two placements. Figure 8 shows that the ray coverage inside the reef has improved slightly with the final design.
Data Acquisition
Given the design described above, Conoco deployed the orbital vibrator at the Michigan Test Site in the summer and fall of 1995, a total of 70 operational days in the field. The sweep length was 8 seconds, the upper limit in frequency was approximately 380 Hz, and the lower limit was (techn·.cally speaking) DC. However, experience shows that the sweep becomes visible at approximately 70 Hz. Itshould also be noted that the upper limit varies a small amount as a function of borehole radius.
Typical field plots of the data are shown in Figures 9-11. Figure 9 shows a special effort designed to highlight the shear wave reflections seen in and around the reef. The source was moved in 8 ft increments over the 2,936 ft aperture, but due to the large amount of field time required for such a complete fan, this was done only once. Figure 9 is a subset of the entire suite of data.
Geophone Orientation
A vibrator was placed at a distance of 5,000 ft from the receiver borehole (the Stech borehole) and it was swept every time the geophone string was moved. Thus, P wave data exists for determining the orientation of all the three-component geophones. This arrangement also resulted in an excellent offset VSP. In fact, Conoco spent extra field time to fill in all the levels that would have been missed in this particular cross-well design. The end result was that a complete high-frequency offset VSP was collected.
Turpening et at.
Data Handling
Before this data can be processed it has to pass 'through a preliminary data handling step. This involves adding and subtracting the sweeps of opposite rotation to obtain P or S wave data and the plotting of these subsets, as seen on the oriented geophones. This data handling currently is being undertaken by Conoco.
Data Processing
Processing of the data will be done at MIT's Earth Resources Laboratory (ERL).
DATA ACQUISITION IN THE ANTRIM SHALE
A few days of field time were set aside to investigate the Antrim Shale. This Devonian shale is a major gas play in Michigan now, with production tied to the existence of fractures. This 130 ft shale occurs at the test site at a depth of approximately 1,DOO ft. The major orbital vibrator field program taking place around the Niagaran reef does not come near the Antrim Shale, Thus, a separate data acquisition effort had to be undertaken at the level of the Antrim Shale.
Given only a few days of field time, a full tomographic data set centered on the Antrim Shale was not contemplated. A few locations of the source and receivers were used in the Ellsworth Shale, Antrim Shale, Traverse Formation, and the Traverse Lime-stone. These provided ray paths that are essentially straight across between our two holes. Again, the surface vibrator was used to provide data for the determination of the orientation of the geophones.
These data are being processed by Conoco.
SINGLE WELL IMAGING OF THE SIDE OF THE REEF
A high-frequency (1 to 7 KHz), piezoelectric version of the orbital vibrator was built by TomoSeis Corp. under contract to Conoco. This source was then turned over to LBL for operation. Since any orbital vibrator is an excellent candidate for use in single well imaging tasks, it was proposed that LBL run this source with a string of hydrophones hanging beneath it at the test site. This source requires the large Conoco wireline and Conoco personnel for operation; therefore, its runs were scheduled to immediately follow the conventional orbital vibrator. The source was placed at a single offset from the end of a string of six hydrophones. The tool was then run at several locations in the MIT/Stech 1-21A at reef level. No tube wave dampers were run.
Preliminary data have been plotted at LBL with no obvious reflections from the side of the reef observable. Although the hydrophones cannot provide directional informa-tion, such data is not needed at the test site. Ifreflections are seen at all, we know their direction of arrival since we know the location of the reef.
The B Salt/A2 Carbonate interface, with an impedance contrast of two, should make an excellent reflector with the only uncertainty being its roughness with respect to the 3 ft wavelengths used in the data acquisition program. Although this interface is not the reef itself, it would serve as an excellent way to locate reefs throughout Michigan.
DIPOLE LOGGING
One segment of the 1995 field program was the running of the new MPI dipole logging tool by Halliburton Energy Services. This occurred late in October 1995 and will provide ERL with the best shear wave logs ever obtained at the site. This is not the first time that our holes have been logged with a dipole tool but this is the most modern dipole tool ever used. This strongly complements the massive amounts of orbital vibrator data collected in 1995. The log is being processed by Halliburton at this time.
CONCLUSIONS
Activity at the test site is accelerating. 1995 was the most active field season in the twelve-year history of the site and 1996 is scheduled to be very active. Special com-mendation must go to Conoco for their Herculean efforts in providing orbital vibrator data through the oil reservoir (the reef) and through the gas play (the Antrim Shale). In addition, they provided the wireline and personnel to run the piezoelectric orbital vibrator (POV). They also provided the financial support for the construction of the POV. We thank Lawrence Berkeley Laboratory for choosing our site to be the first to obtain single well imaging data, currently a hot topic in oil field services research. Halliburton Energy Services continues its long history of support to the test site. They have provided logs and cross-well recording services free of charge for many years.
With the 1995 data, ERL now has complete cross-well data sets from the orbital vibrator and the piezoelectric cylindrical bender. We have smaller data sets from the pneumatic vertical vibrator and the air gun. In 1996, we plan to add the hydraulic vertical vibrator to our inventory of data. Conoco's orbital vibrator is also the first cross-well data set we have ever collected with three-component receivers of known orientation.
Turpening et al.
CROSSHOLE SURVEY
CYLINDRICAL BENDER-SOURCE
a
RECEIVERS COMPLETION - 1991,
~(
)~>3500
,\
~::: ~
S S S S S 201 S SourceJ~
4480- S Posilions·~~.
W
I 4770 ReseJ voir S 8rown iOQoron ____ S S S S•
-1800ft..
~
5500 RR
R
R
RR
RR
RR
R R~
R R R R R R F U ·1nl 3488 F Sail F Sail 3855 Strln .r 1ft F Sail F all n E Unil Sha Ie 4088 CShole!rIll irS 'II ,
201 '8 Sail Receiver Positions A2 Carbonate 4563 A I rnrhnnnfo AI Sall/ A I Evaporite Gray Niagaran Schoolcraft Carbonate 8 urn I 8 luff Carbonate
Cobol Head Shole 5531
Manitoulin Dolomll.
Cincillnorlon Sllol.
Figure 1: Cross-section of the cylindrical bender cross-hole survey, The sources and receivers spanned the section from 3,500 to 5,500 ft at 10 ft intervals,
3500-4000
-
-
Q) Q)-:r:
4500
l-e..
W
C
5000
5500
0.080
SOURCE'GATHER
RECEIVER POSITION 3500 FEET
I
0.105
TIME (seconds)
0.135
0.140
Figure 2: A source gather showing the longest ray path in the survey, The receiver is at 3,500 ft, At the bottom of the section, below 5,000 ft, the signal-to-noise ratio begins to deteriorate,
3500
4000
-54500
to
":l5000
5500
o
offset
(l't)SOO
1000
1500
24000
22000
16000
14000
Figure 3. Tomographic image of the reserv.oir at MIT's Michigan Test Site. This image was generated from the piezoelectric data gathered in 1990-1991 by BP America Inc. The oil/water contact is known from the logs taken in Shell's production well. Note that the majority of the yellow zone in the core of the reef (presumed to be the porous zone of the
Raypath Coverage
o
500
offset (ft)
1000-
1500
3500
3500
5500
5000
5500
5000
4000
4000
c.."
"0 ~ ::r-~4500
4500
:::> ~o
500
1000
1500
Figure 4: Raypath coverage for the 1990-1991 tomogram of the reef from the piezoelec-tric cylindrical bender data. The curvature of the source positions in the borehole on the right is real. The regions avoided by the first arriving compressional waves are the low velocity F Salt (around 3,600 ft) and B Salt (around 4,300 ft).
4500--r---,---,---"."..,_ .<:: 5000
~
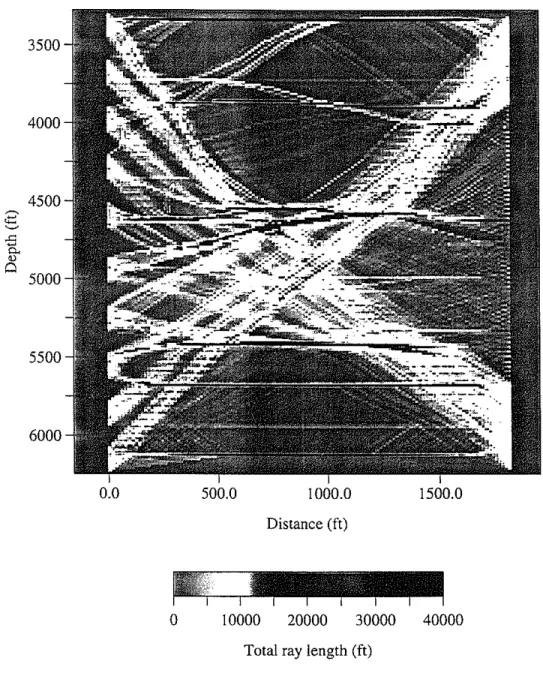
Q 5250 5500 500 1000 Distance(ft) 1500o
10000 20000 30000 40000Total ray length (ft)
4000 4500 ~ 0:; ~
.s
""
"
P 5000 5500 6000 0.0 500.0 1000.0 Distance Cft) 1500.0o
10000 20000 30000 40000 Total ray length Cft)4500 .~ 4 4750 .c 5000
~
a
5250 5500 500 750 1000 Distance (ft) 1250 1500o
10000 20000 30000 40000Total ray length (fl)
4750
R
5000a
5250 5500 500 750 1000 Distance (ft) 1250 1500o
10000 20000 30000 40000Thrpening et al. 3,300
ft.·
4,050ft.
4,800ft..:..
5,350ft.
6,300ft.
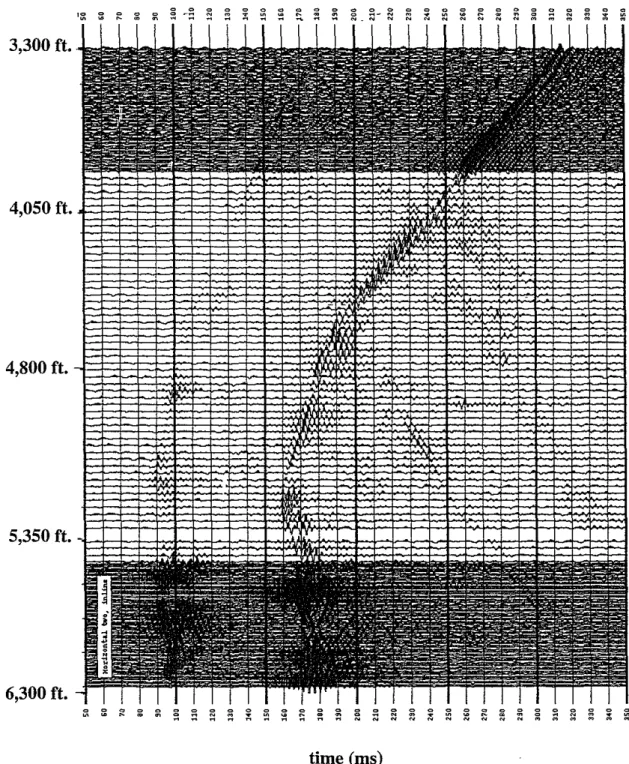
time (ms)Figure 9: Field plot of the output of one horizontal geophone for all orbital vibrator source positions over the 3,000 ft aperture. The large apparent velocity .changes around 4,050 ft are not real, but are artifacts caused by plotting source spacings of 32 ft at the same scale as spacings fo 8 ft.
3,300
ft.
4,800
ft.
5,350 ft.
6,300
ft.
time (ms)
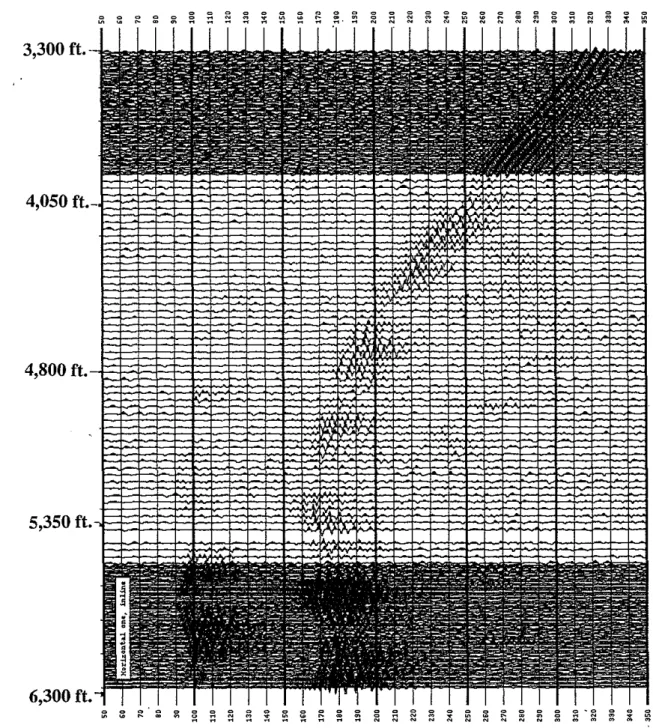
Figure 10: Field plot of orbital vibrator data from an unoriented horizontal geophone at 5,856 ft. Note that the shear wave signal strength is good right up to the end of the 3,000 ft aperture. Source level spacings are 32 ft in the middle and 8ft on the top and bottom.
Turpening et aI. 3,300
ft.-' " ' " ' " ' " ' " ~ N 4,800
ft.
5,350ft.
6,300ft.
time (ms)Figure 11: Field plot of orbital vibrator data from a horizontal geophone at a depth of 5,880 ft.